

Аннотация
Medicinal plants contain various biologically active substances. This study aimed to investigate properties of plant extracts and component composition of plant raw materials from the continental part Kaliningrad region (Guards district). For this, we used column chromatography and IR spectroscopy.The objects of the study were samples of plant extracts of Eryngium maritimum, Hedysarum neglectum, Melilotus officinalis, and Aesculus hippocastanum. To produce medicinal plant extracts, we prepared methanol extraction by the Soxhlet method for 8 h (15 cycles). The antioxidant activity of the studied samples was determined by their ability to reduce the radical 2,2-diphenyl-1-picrylhydrazyl. The disk-diffusion method was used to evaluate the antimicrobial activity of the plant extracts against such test strains as Bacillus subtilis, Escherichia coli, Pseudomonas aeruginosa, and Candida albicans.
In the extracts, 3,4-dihydroxybenzoic acid, astragalin, luteolin-7-glucoside, rosmarinic acid, and chlorogenic acid were identified. However, more research is needed to determine which of the individual phenolic compounds in E. maritimum, H. neglectum, M. officinalis, and A. hippocastanum are involved in exhibiting antioxidant activity. It was found that the plant extract of H. neglectum had activity against the bacterium B. subtilis and the mold fungus C. albicans, while the plant extract of E. maritimum was detrimental to the growth and development of both Gram-positive and Gram-negative bacteria.
Infrared spectroscopy can help in further studies to determine properties of medicinal plants to ensure the safety and efficacy of plant-based products.
Ключевые слова
Medicinal plants, Eryngium maritimum, Melilotus officinalis, Hedysarum neglectum, Aesculus hippocastanum, extracts, infrared spectroscopy, antioxidant propertiesВВЕДЕНИЕ
Medicinal plants contain various phenolic compounds and their derivatives. These are important biologically active substances, which are powerful antioxidants used in the production of flavorings, synthetic dyes, protective agents against various oxidative stresses, and therapeutic agents for the human body [1]. Plants are sources of antioxidants which play an important role in preventing cell damage and controlling oxidative stress in the body [2]. Plant antioxidants, such as polyphenolic compounds, are considered important ingredients because of their beneficial properties [2, 3]. In Chinese phytotherapy, various parts of the plant (roots, bark, leaves, fruits, and seeds) are used to treat many human diseases [4, 5]. Benefits of antioxidants are stabilization or inactivation of free radicals, protection of cells during oxidation, and prevention of the destruction of cellular components [6].
Antimicrobial resistance poses a serious threat to human health worldwide [7]. The cost of developing a new generation of antibiotics from discovery to market is high, and the return on investment is low. For this reason, the development of new antibiotics has slowed dramatically. However, plants produce many bioactive secondary metabolites that exhibit antimicrobial activity in varying degrees and can help solve the problem [7].
Infrared (IR) spectroscopy is a powerful analytical technique for analyzing any medicinal plant sample under any conditions. IR spectra are used to measure the vibrations of molecules excited by infrared radiation and to identify organic, inorganic, and polymeric materials for scanning in infrared light [8].
We found no research on the use of high performance liquid chromatography to examine various biologically active substances from sea holly (Eryngium maritimum L.), sweet yellow clover (Melilotus officinalis Pall.), red root (Hedysarum neglectum Ledeb.), and horse chestnut (Aesculus hippocastanum L.). Additionally, important bioactive compounds were quantified using solvent extraction methods, and their antioxidant activity was evaluated using standard methods. Over the past decade, several analytical methods have been used to measure the freeradical activity of herbaceous plants [7]. Spin splitting methods for detecting free radical activity in tea trees and fruits have been demonstrated to be a more appropriate and advanced extraction process [9]. Biologically active compounds of these plants have a variety of high biological activity, such as antioxidant, free radical absorption activity, antimicrobial, anti-inflammatory, and anticancer activity. The Kaliningrad region is a unique region of Russia, primarily due to its geographical location and climatic conditions. Favorable conditions for vegetation growth are contributed by such factors as the natural characteristics of the region’s mild maritime climate, the smooth course of temperatures throughout the annual cycle, the long frost-free period, rapid soil formation due to the constant ingress of organic matter and its rapid decomposition, as well as the abundance of precipitation [10–12].
Official medicine recognizes the general potential and gives priority to medicinal plants in the treatment of many diseases. In this regard, the study of the biological activity of E. maritimum, M. officinalis, H. neglectum, and A. hippocastanum as understudied plants is very relevant [12]. It is well known that these potentially beneficial plant species have a diverse composition of biologically active substances, pharmacological activity, but have received little attention [11].
E. maritimum contains essential and fatty oils, flavanoids, steroids, coumarins, terpenoids, polyacetylene compounds, and carbohydrates. E. maritimum is used as a diuretic, tonic, antibacterial, antispasmodic agent [13, 14]. The plant is used in the treatment of cancer due to the presence of biologically active substances which have antitumor activity, such as coumarins, xanthotoxins, and leucoanthocyanins [14]. H. neglectum is used in medicine for the treatment of cardiac, pulmonary, as well as cold and skin diseases of viral nature. It exhibits antituberculosis, antitumor, hepatoprotective, antibiotic, immunostimulating, choleretic, diuretic, hyperglycemic effects and stabilizes lysosomal membranes. H. neglectum has therapeutic properties due to a unique combination of biologically active substances, including xanthones, flavonoids, and polysaccharides [14]. A. hippocastanum is used to treat cardiovascular diseases, gastrointestinal disorders, a number of nervous disorders, skin, parasitic, and other diseases [15]. The key biologically active substances of A. hippocastanum are chicoric acid, ferulic acid, vitexin, epicatechin, dihydrocoumarin, water-soluble polysaccharide complexes, polyphenolic compounds of phenyl benzo-γ-pyrone, benzo-γ-pyrone, and phenolcarboxylic acid derivatives [15]. The plants mentioned above have unique properties due to the mild marine climate, slight temperature fluctuations, illumination, are a valuable source of new pharmaceuticals and the basis for the development of functional products. In addition, various parts of medicinal plants are increasingly used in the cosmetic industry [1]. There are modern ideas about oxidative stress and extreme radicals. Antioxidants help prevent these harmful effects. This article describes methods used in the quantitative description of antioxidants of medicinal plants of the Kaliningrad region.
The use of herbal medicines and supplements has increased over the past few decades. This is consistent with the growth of self-medication, so there is a trend toward returning to traditional and natural products. Consumers prefer herbal and natural products because they are safer and more likely to reduce the side effects of chemical drugs, improve health, and lower treatment costs [1]. This can have negative consequences for the consumer. Product quality assurance can be evaluated both qualitatively and quantitatively. Quantitative assessment of plant products focuses on phytochemical components found naturally in a sample as well as impurities that should not be present [2, 3].
Various analytical techniques, such as high-performance liquid chromatography (HPLC), ultra-high-performance liquid chromatography, liquid chromatographymass spectrometry, gas chromatography-mass spectrometry, nuclear magnetic resonance (NMR), and thin layer chromatography, can be used to check the phytochemical content and impurities in medicinal herbs. However, the methods have a number of drawbacks. HPLC and NMR methods are commonly used methods to obtain data on the composition of plant components. However, the main disadvantage of these methods is the high cost and long time of research [16]. In addition, when analyzing plant-based medicines, one of the obstacles is the efficiency of analysis because the complex components of plant-based medicines can complicate the process. Furthermore, the analysis process can also damage the material [15].
In light of the foregoing, this study aimed to investigate properties of plant extracts and component composition by using column chromatography and IR spectroscopy plant raw materials from the continental part of the Kaliningrad region (Guards district). The results of an infrared spectroscopy study of biologically active compounds from E. maritimum, M. officinalis, H. neglectum, and A. hippocastanum are presented in this paper. This method is promising for the pharmaceutical industry as a future green line of highly effective plant antioxidants [17]. Extracts of E. maritimum, M. officinalis, H. neglectum, and A. hippocastanum exhibit significant antioxidant and antimicrobial activity.
ОБЪЕКТЫ И МЕТОДЫ ИССЛЕДОВАНИЯ
Objects of research. Medicinal plants of the Kaliningrad region, namely Eryngium maritimum L., Melilotus officinalis Pall., Hedysarum neglectum Ledeb., and Aesculus hippocastanum L. The biomaterial was confirmed by A.V. Pungin, the head of the herbarium of the Institute of Living Systems of Immanuel Kant Baltic Federal University (Protocol No. 6/2022). The above-ground parts of E. maritimum, M. officinalis, H. neglectum, and A. hippocastanum (stem, leaves, and flowers) were collected during the flowering period (July-August 2022). Herbs were dried in well-ventilated rooms in the shade under a roof.
Extract productions. To produce E. maritimum, M. officinalis, H. neglectum и A. hippocastanum methanolic extracts, we applied the Soxhlet method for 8 h (15 cycles). The extract was then vaporized under reduced pressure and then dissolved in a mixture of methylene chloride:methanol (1:1). Samples of E. maritimum for subsequent IR spectroscopy were obtained using preparative liquid chromatography. For this purpose, a silica gel suspension in methylene chloride was loaded into a glass chromatography column (Agilent Technologies Prep LC, Santa Clara, California, USA) in such an amount that the silica gel occupied no more than half of the column volume. The solvent composition for the elution was chosen by thin-layer chromatography on DC-Fertigfolien Alugram SIL G/UV254 plates; the sorbent was silica gel (Agilent Technologies Prep LC, Santa Clara, CA, USA). Elution was performed in the gradient mode in the methylene chloride:methanol system with a gradient of 0–100%, at the rate of 10% increase in methanol concentration every 10 fractions [18, 19]. The volume of the fractions was 4 mL. Some methylene chloride:methanol (8:2) fractions were selected.
The eluted fractions were determined by the time of release of the maximum of its chromatography peak. HPLC parameters: reversed-phase, 2-channel (binary) pumps, flow rate 1.0 cm3/min, injection volume 0.005 cm3, temperature 40°C, UV spectrophotometric detection on a diode matrix at λ = 254 nm, approximate retention time 5 min. The wavelength was selected in accordance with State Standard R ISO 17735-2021 for chromatography with a UV detector. This is the optimal wavelength for the HPLC chromatograph used. Glass chromatography column operates in open access mode, the chromatograph is modular with possible switching of columns, using MassHunter Walkup software for identifying substances. Column parameters: analytical, 46 mm in diameter, densely packed, flow rate 1000 µL/min. The mobile phase is more polar than the graft phase and is supplied under pressure up to 200–500 atm.
All standards and reagents, graded chemically pure or higher, were purchased from AG Analitekspert, Moscow, Russia.
Preparation of E. maritimum, M. officinalis, H. neg- lectum, and A. hippocastanum extracts for IR spectrometry. KBr powder (m = 0.11 g) (Pike Technologies, Madison, Wisconsin, USA) was impregnated with the sample solution (V = 0.5 mL). Next, the powder with the sample was dried in a drying cabinet (Memmert GmbH, Memmert, Germany) at 50°C until the liquid evaporated completely for 40 min. The resulting dry powder was ground in an agate mortar to grind the fraction. The resulting mixture was further pressed into a transparent tablet. The IR spectrum of the prepared samples of plant extracts was measured on an IR spectrometer IRPrestige-21 (Shimadzu, Kyoto, Japan): the spectral range 500–4000 cm–1, a spectral resolution of 2 cm–1, frequency (wave number) 100 cm–1, and the number of scans of 32. The spectra of the comparison samples were obtained under similar conditions. The relative standard deviation of the method was 1.97% and the signal-tonoise ratio was 60 times.
Determination of antioxidant activity of E. mari- timum, M. officinalis, H. neglectum, and A. hippocastanum extracts. To study the antioxidant activity, the plant extracts were dissolved in 1 mL of dimethyl sulfoxide and sonicated (Sonorex Super RK 100 H, Bandelin, Germany) for 5–10 min until they dissolved completely. The samples were dissolved right on the day of analysis.
The antioxidant activity of the studied samples was determined by their ability to reduce the radical 2,2-diphenyl-1-picrylhydrazyl (DPPH, C18H12N5O6, M = 394.33) [20]. The interaction reaction of antioxidants with DPPH-radical proceeds according to the scheme:
The reduction of the DPPH radical by an antioxidant results in a reduction of the purple-blue color of DPPH in ethanol, and the reaction was monitored by the change in optical density using the spectrophotometric method.
The samples of plant extract solutions were mixed with 2.85 mL of a freshly prepared 0.1 mM solution of 2,2-diphenyl-1-picrylhydrazyl for analysis. The mixture was incubated in dark at room temperature for 30 min. The decrease in optical density compared to the control (dimethyl sulfoxide solution) was recorded at 517 nm (UV-3600 spectrophotometer, Shimadzu, Kyoto, Japan). Ascorbic acid solutions of known concentration were used as standard solutions. The results were expressed in mg of ascorbic acid equivalent per gram of extract or individual compound (mg AA/g). In the absence of sample mass, the antioxidant activity was expressed by the EC50 value per µL of solution required to bind 50% of the DPPH radical [10].
The antioxidant activity of the samples was analyzed in three replicates.
Determination of antimicrobial activity of E. maritimum, M. officinalis, H. neglectum, and A. hippocastanum extracts. The antimicrobial activity of the plant extracts was studied by the disk-diffusion method, against such test strains as Bacillus subtilis (Grampositive bacteria), Escherichia coli, Pseudomonas aeruginosa (Gram-negative bacteria), and Candida albicans. E. coli, P. aeruginosa, and B. subtilis strains were cultivated on solid LB nutrient media at 37°C [21, 22].
C. albicans microscopic fungi strains were cultivated on Ringer’s medium (ammonium chloride, 0.4 g; sodium hydrogen carbonate, 0.005 g; calcium chloride dihydrate, 0.040 g; potassium chloride, 0.0525 g; sodium chloride, 1.125 g) at 25°C.
The concentration of the microbial suspension during the experiment was at least 1.5×10⁸ CFU/mL. The disc diameter was 6 mm. Kanamycin (for bacteria) and fluconazole (for the yeast-like fungus, C. albicans) was used as a comparison in a concentration of 50 and 500 µg/disk, respectively. A mixture consisting of 1% trifluoroacetic acid (31%) and acetonitrile (69%) was used as control. For reliability of the results, the experiment was repeated three times. The average value was used as the result of the measurement [21].
All standards and reagents, graded chemically pure or higher, were purchased from AG Analitekspert, Moscow, Russia.
Statistical analysis. Each experiment was repeated three times, and the results were presented as mean ± standard deviation. Standard statistical methods were used to process the obtained data.
РЕЗУЛЬТАТЫ И ИХ ОБСУЖДЕНИЕ
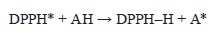
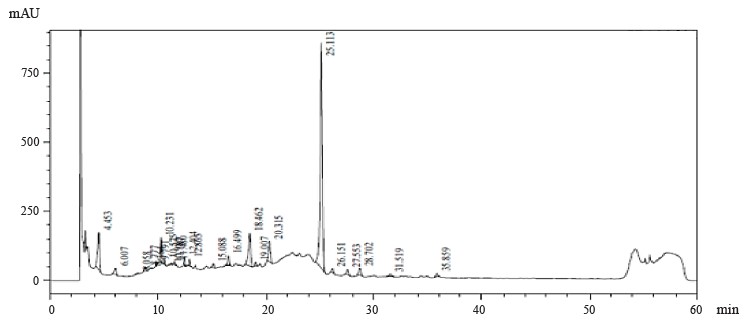
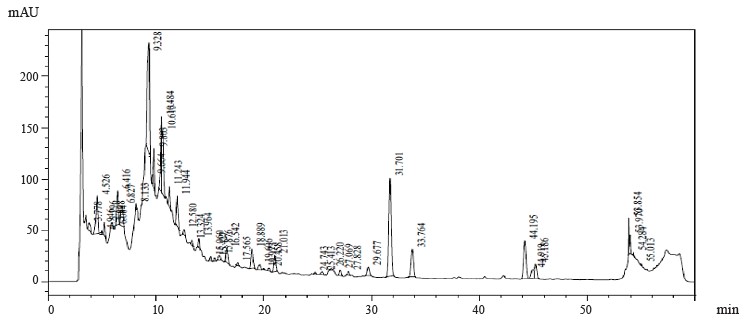
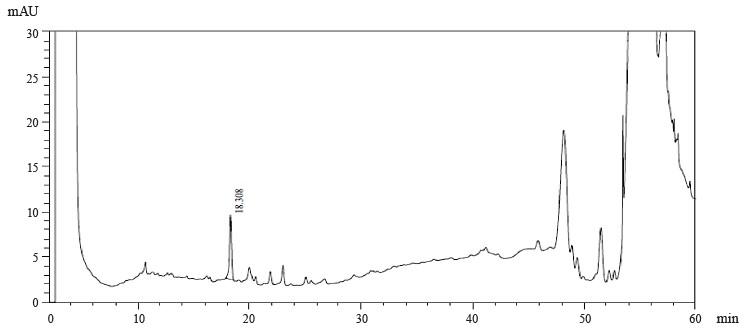
Figures 1–4 show the results of preparative chromatography of Eryngium maritimum L., Melilotus officinalis Pall., Hedysarum neglectum Ledeb., and Aesculus hippocastanum L.
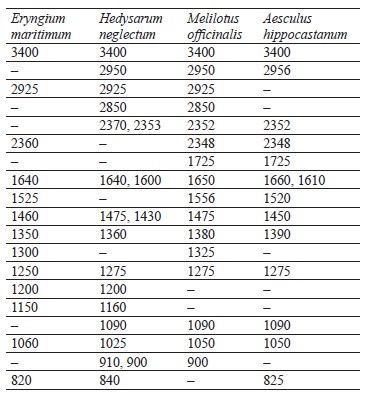
Peaks of the IR spectra of extracts of medicinal plants are presented in Table 1.
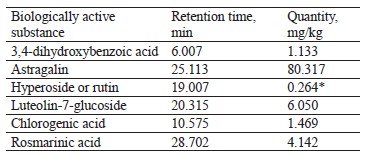
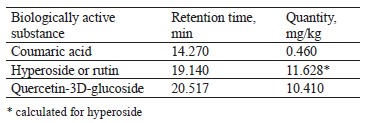
The qualitative composition of the extract fractions of E. maritimum, M. officinalis, H. neglectum, and A. hippocastanum are presented in Tables 2–5.
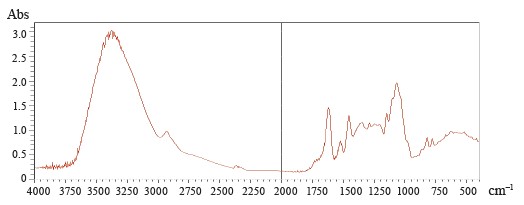
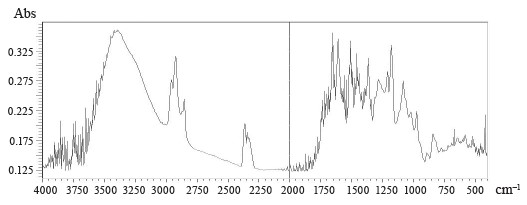
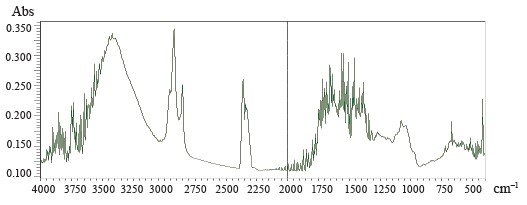
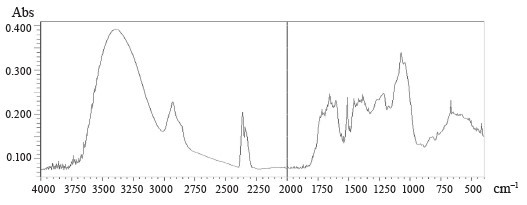
Figures 5–8 demonstrate IR absorption spectra of the E. maritimum, M. officinalis, H. neglectum, and A. hippocastanum extracts. They allow us to amplify data about the structure and properties of the extracts.
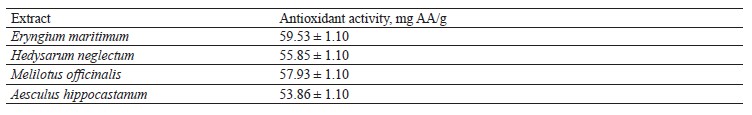
The values of antioxidant activity of the studied plants are presented in Table 6.
The antimicrobial activity of E. maritimum, M. officinalis, H. neglectum, and A. hippocastanum extracts is presented in Table 7.
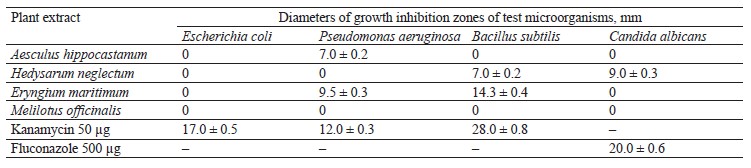
The results of the studies (Table 7) show that the extracts had the greatest antibacterial activity against Bacillus subtilis. The experiment revealed that the diameter of the inhibition zone of E. maritimum was 14 mm. None of the extracts showed activity against Escherichia coli. The zone of inhibition of H. neglectum extracts was 7 mm. However, all these values did not exceed the inhibitory activity of the positive control, kanamycin, which had an inhibition zone diameter of 28 mm.
It was found that against the test strain of P. aeruginosa, the highest activity was observed in the plant extracts of E. maritimum and A. hippocastanum. The H. neglectum extracts showed little activity against C. albicans.
Next, in order to establish the minimum inhibitory concentration of the studied extracts, plant extracts that exhibited antimicrobial (antibacterial and fungicidal) activity against the test strains were selected. For such extracts, dilutions of 2, 4, and 6 times were prepared. However, none of the extracts of A. hippocastanum, H. neg- lectum, E. maritimum, and M. officinalis that were isolated showed activity against the test strains of P. aeruginosa, C. albicans, E. coli, and B. subtilis.
Analysis of Fig. 1 and the data obtained Table 2 shows that the main component of E. maritimum extract was astragalin (peak 25.113 min, 80.31 mg per kg of plant material). In addition, 3,4-dihydroxybenzoic acid, astragalin, luteolin-7-glucoside, rosmarinic acid, and chlogenic acid were identified in the indicated fraction. In addition, peak 19.007 may correspond to hyperoside or rutin.
Coumaric acid and quercetin-3D-glucoside were identified in the obtained samples of H. neglectum extract (Table 3). The 19 140 peak may correspond to hyperoside or rutin. The quantitative composition of the fraction is shown in Table 1. Large peaks of 9.883, 13.369, 15.502, 15.701, and 18.203 min were unidentified (Fig. 2). Identification of trace organic compounds in multicomponent mixtures is one of the most difficult problems in ecoanalytical and biochemical studies, and control of impurities in process samples. In these cases, the nature of the objects excludes the possibility of preparative isolation of components and the study of individual substances. However, the spectra in many cases are insensitive to the isomerization of the carbon skeleton of molecules and conjugated systems, so some compounds remain unrecognized [23].
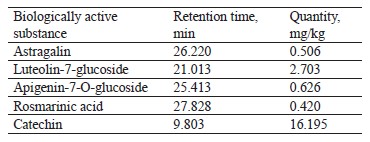
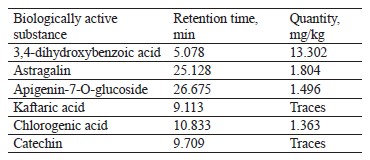
Astragalin, luteolin-7-glucoside, apigenin-7-O-glucoside, rosmarinic acid, and catechin were identified in the extract samples obtained from M. officinalis (Table 4). The extract samples of A. hippocastanum contained 3,4-dihydroxybenzoic acid, astragalin, apigenin-7-O-glucoside, chlorogenic acids, and kaftaric acid and catechin traces (Table 5). Major peaks (6.386, 13.451, and 28.388 min) were not identified (Fig. 4).
The peak recorded in the spectra of all the studied samples at 3400 cm–1 is associated with absorption due to strain vibrations of the -OH group [24]. The peaks located in the region of 2950 to 2850 cm–1 are attributed to the asymmetric stretch of the -CH2 group [24].
The wavelength region from 4000 to 2500 cm–1 is not used for determining individual phenolic compounds because it contains primarily broad bands associated with stretching vibrations of hydroxyl groups, as well as bands associated with stretching vibrations of aromatic ring groups-C-H in all spectra.
The best region for identification of phenolic compounds by infrared spectroscopy is the so-called fingerprint region, which is located in the range from 1725 to 820 cm–1. The absorption peak at 1725 cm–1 was due to the stretching vibration of the carbonyl group and was present only in the spectra of M. officinalis and A. hippocastanum. Furthermore, IR spectra of all the samples revealed peaks in the range of 1660–1600 cm–1 (Figs. 5–8), which is typical of hydroxybenzoic acids and/or hydroxycinnamic acids [25].Chlorogenic acid gives an absorption band around 1725–1720 cm–1, which could be related to the, β-unsaturated aliphatic ester vibrations, which register between 1740 and 1705 cm–1, or the carbonyl CO stretch of a protonated carboxylic acid [24]. Consequently, the band located at 1725 cm–1 may be related to the presence of this acid in the M. officinalis, and A. hippocastanum extracts. In the medicinal plant M. officinalis, the content of coumarins reached 1.5–2%, among them coumarin, dihydrocoumarin, dicoumarol, etc. In the IR spectra of coumarins, as in the structure of α-pyrones, the bands of stretching vibrations of the carbonyl group lie in the region of 1750–1700 cm–1. The variability depends on the structural features of coumarins.
The absorption peaks at 1200–1025 cm–1 were associated with C-OH, C-O-C, and C-C vibrational stretching, indicating the presence of a ring structure, a heterocyclic oxygen-containing (pyrane) ring [26].
The aromatic nature of the compounds was also confirmed by the intensive absorption of all the extracts at 900–820 cm–1. The bands between 1200 and 1275 cm–1 represent the deformation vibrations of the C-O phenols and carboxyl group [27]. Thus, the IR spectra confirmed the presence of the biologically active substances in the extracts indicated in Tables 2–5.
Infrared spectroscopy can be used in qualitative and quantitative analysis. This method provides information on compound content in complex samples with small levels. The complexity of the information provided can be solved using chemometric methods. Chemometric methods can help in extracting information from spectra through multivariate analysis. Spectroscopy is considered a fast, time-saving, cost-effective, accurate, and nondestructive analytical tool [28]. Infrared spectroscopy has been successfully used for quantitative analysis in various fields, including pharmaceutical, food, agricultural, and biological evaluation. The root mean square error of calibration (RMSEC), root mean square error of prediction (RMSEP), root mean square error of crossvalidation (RMSECV), and coefficient of determination (R2) are used to assess the success of this method [29]. Several factors influence the good linearity and accepted standard errors of the prediction model. The choice of pretreatment spectra and variables can affect the accuracy and precision of infrared spectroscopy methods.
Analysis by infrared spectroscopy is ideal. If the evaluation results show R2 values approaching the value of 1, low standard error (RMSEC, RMSECV, RMSEP) or the predicted square of the sum of residual errors, and relative percent difference. Values should be at least 2.4 or higher [29, 30]. Calibration R2 values describe the linearity of the calibration curve generated from the infrared spectrum data (x-value) with these concentrations measured using the reference method (y-value). R2 values close to 1 indicate that the infrared spectrum data are able to explain the concentration of compounds as the dependent variable. Most of the analysis of plant materials using infrared spectroscopy is performed on solid samples, which makes them prone to scattering [31–33]. Scattering causes irrelevant changes in the spectral data. If the pre-processing spectra are missing, a mixture of information and noise will occur, and this may lead to a decrease in the predictive ability of the model. Scattering typically reduces the number of midinfrared reflectance measurements than near-infrared reflectance. This is due to the inhomogeneity of the particle size during measurement [31]. The particle size is inversely correlated with the scattering coefficient, according to studies by Otsuka [34].
The choice of spectra preprocessing methods is very important for successful calibration model generation because it can reveal or exclude important information related to the content measurement [35–37]. However, the success of the influence of spectra preprocessing on the formation of the calibration model can only be known after model validation [38–40]. It is important to compare several spectra preprocessing methods and their combinations to determine the more appropriate method for the data being analyzed. Preprocessing methods are appropriate if they reduce standard errors by reducing or minimally preserving model complexity [41–43].
The selection of CARS variables consists of three steps. The first step is to randomly sample the datasets and then the number of these variables will be reduced again using the exponential decreasing function method where the number of variables decreases rapidly. The remaining variables that lead to a low RMSECV value will be selected as informative variables included in the calibration model [44, 45]. This method can make the calibration model simpler and more efficient [35]. Unlike GA based on random selection of a subset of variables followed by calibration, the PLS model allows for the selection of the variable with the greatest influence. In addition, crosses and mutations are performed to form new variables, and recalibration is performed to decide which variable is the most appropriate [36, 37].
Our findings are consistent with those of Baltacıoğlu et al. [46]. When studying aqueous extracts of E. maritimum, it was found that such phenolic compounds and flavonoids as gallic acid, chlorogenic acid, caffeic acid, vanillic acid, catechin, rutin, quercetin and luteolin were isolated [47]. The extracts were examined by infrared spectroscopy. Phenolic compounds derived from E. maritimum play a very important role in the biological activities of medicinal plants, such as antiinflammatory, antitumor, antioxidant, and antimicrobial effects [48].
We investigated the total content of phenols and flavonoids as well as the antioxidant properties of E. maritimum. IR analysis of E. maritimum extracts revealed a significant amount of phenolic compounds. The total content of phenols and flavonoids was higher in leaves than in roots and stems. This can be explained by the influence of the plant development stage on the distribution of phytocomponents. These observations are consistent with the findings of Markl et al. [49]. The antioxidant properties of E. maritimum evaluated using DPPH free radical scavenging activity showed that the in vitro activity is different for raw materials of different parts of the plant. The leaf extract showed the greatest antioxidant activity compared to other extracts. This agrees with the results of Nagy et al., who revealed high antioxidant properties of Erythronium caucasicum leaf extract in comparison with the flower extract [50]. According to [46], the important antioxidant abilities of E. maritimum extracts were primarily due to the good correlation between phenolic and flavonoid content and antioxidant activity. This conclusion is consistent with the results of Sisay et al., who have demonstrated such linear correlation [51]. In addition, the difference in the radical scavenging activity of E. maritimum may be related to the nature of their six phenolic components (gallic acid, catechin, chlorogenic acid, vanillic acid, caffeic acid, and cinnamic acid) and three flavonoids (rutin, quercetin, and luteolin). The therapeutic potential of these compounds has been reported in many papers [52]. For example, chlorogenic and caffeic acids are powerful antioxidants, both in vivo and in vitro [53]. Palmer et al. suggested that rutin, quercetin, luteolin, and caffeic acid derived from E. maritimum leaf extract may be responsible for their antioxidant properties [53].
A study made by Pauli et al. showed that gas chromatography-mass spectrometry analysis of n-hexane extract of M. officinalis revealed twelve compounds with a total peak area of 98.33%, mainly (9Z,12Z)-octadecadienoic acid (20.22%, 366 ppm), 14-methylpentadecanoic acid (19.52%, 353 ppm), and (9E)-octadecenoic acid (15.94%, 289 ppm) [54]. Two compounds, namely, cis-coumaric acid-2-O-β-D-glucopyranoside (cis-melilotoside, 1) and 1,2-benzopyron (coumarin, 2), were isolated from MeOH extract of M. officinalis. The structures of the isolated compounds were determined by spectroscopic methods such as NMR, UV-visible region, and Fourier-transform infrared spectroscopy (FTIR). The MeOH extract of M. officinalis was tested for its antioxidant activity using the DPPH assay. MeOH extraction of M. officinalis resulted in the isolation of cis-melilotoside and coumarin [54]. The MeOH-extract of M. officinalis showed an antioxidant activity of 54.06 ± 1.27 mg AA/g. In our case, extraction with methanol resulted in a value of 57.93 ± 0.70 mg AA/g of antioxidant activity of the extract. This discrepancy can be explained by the nature of the extractant. Methyl alcohol derivatives more efficiently extract BAS such as astragalin, luteolin-7-glucoside, apigenin-7-O-glucoside, rosmarinic acid, and catechin, which have increased antioxidant activity (Table 6).
According to Sacher et al., extraction of M. officinalis with chloroform resulted in the isolation of biologically active substances such as hexadecanoic acid, lupanone, lupeol, betulinic acid, oleanolic acid, and campferol-3-O-glucopyranoside, which were identified by infrared spectroscopy [55]. The antioxidant activity of these extracts was 52.38 1.2 mg AA/g, which is by 9.6% lower than the antioxidant activity of the M. officinalis methanol extract obtained in our work.
Zaborenko et al. proved the anticoagulant and antioxidant activity of ethanolic M. officinalis extracts [56]. It was noted that coumarin is a natural phenolic product obtained from sweet yellow clover (M. officinalis) by maceration in ethanol solvent. The crude extract was analyzed by high-performance liquid chromatography, then divided into two parts. The first part was characterized by FTIR and examined for anticoagulant and antioxidant activity, and the second part was fractionated by column chromatography. The results of the anticoagulant activity of the crude extract were revealed to be dose-dependent. The value of the antioxidant activity of M. officinalis was 53.61 ± 1.10 mg AA/g, which is by 7.5% lower than what our results. M. officinalis was found to be a good source of coumarin and coumarin derivatives. In addition, the advantage of FTIR analysis over column chromatography, which are considered valuable separation and characterization methods, was demonstrated [56].
Dmitrieva et al. described the antioxidant properties of H. neglectum (a forage plant) [57]. The xanthone glycoside mangiferin was extracted from this plant and used for the drug Alpizarin. In addition to substances of xanthone nature (mangiferin and isomangiferin), H. neglectum contains sugars, vitamins and provitamins, tannins; the underground part contains oligomeric catechins, isoflavonoids, butylphenols, alkaloids, tannins, flavonoids, saponins, coumarins, carbohydrates, and vitamin C. The researchers have found that in order to select the optimal biologically active substances fractionation schemes, it is necessary to resort to multistage grouping schemes: broad (preliminary) isolation and preparative accumulation. In some cases, it is important to consider the presence of accompanying substances, as well as the efficiency and selectivity of the sorption and chromatographic technology used. According to the results of the authors, the use of silica gel and Sephadex LH-20 for the isolation of the flavonoid and gallic acid complex is the most effective method for selecting the optimal option for the preparative isolation of total biologically active substances in µg/mL. The results of the study enabled the isolation of the desired biologically active substances with a degree of extraction of at least 80%: xanthone, flavonoid, and gallic acid fractions. The value of the antioxidant activity of H. neglectum biologically active substances was 54.90 ± 1.10 mg AA/g. The data obtained in the study by Dmitrieva et al. are almost identical to ours (55.85 ± 1.10 mg AA/g) [57]. Slight differences are explained by differences in the approaches to determining the biologically active substances composition.
Infrared spectrometry revealed that A. hippocastanum aqueous extracts contain the coumarin glycosides scopolin, fraxin, and esculent [57]. A number of quercetin and camperfol flavonoid glycosides are also found in leaf tissue. Escin, as well as leucanthocyanins, cis-, trans-polyprenols, amino acids, fatty acids, and sterols were also found. According to the results of the FTIR analysis, the inhibitory effect on free radicals and oxidative processes in the human body is due to the phenolic components of A. hippocastanum polyols. Our results are confirmed by Küp et al. [58]. The value of the antioxidant activity of A. hippocastanum in a study by Kumar et al. was 53.86 ± 1.10 mg AA/g, which is by 4.0% less than in our study [59].
In a study by Konstantinovitch et al., extracts of A. hippocastanum bark generally had weak antibacterial activity (MPC ≥ 0.625 mg/mL) and bacteriostatic potential (minimum bactericidal concentration/minimum inhibitory concentration ≥ 16) against both Gram-positive and Gram-negative bacteria, which confirms our studies [60]. Dahash et al. demonstrated that A. hippocastanum extract exhibited a significant antibacterial effect on tested Gram-negative and Gram-positive bacteria compared to negative controls: p < 0.05 for Klebsiella pneumoniae and P. aeruginosa and p < 0.01 for E. coli, Staphylococcus epidermidis, and Staphylococcus aureus [61]. On the other hand, the extract had a relatively lower antibacterial effect on K. pneumoniae, E. coli, and P. aeruginosa compared to the positive control (p < 0.01), while the A. hippocastanum extract showed a comparable effect to the positive control for Grampositive S. epidermidis, p = 0.05. In addition, the extract showed a concentration-dependent antibacterial effect against Gram-positive S. epidermidis and S. aureus compared to different concentrations (p < 0.01). The minimum inhibitory concentration and minimum bactericidal concentration of A. hippocastanum extract were high for Gram-negative bacteria and low for Gram-positive bacteria compared to the minimum inhibitory concentration of positive controls.
According to Ehsani et al., aromatic M. officinalis is high in essential oils with antimicrobial properties [62]. The chemical components of essential oils were identified using chromatography-mass spectrometry analysis, and the antimicrobial activity of essential oils was evaluated using disk diffusion analysis, as well as determining the minimum inhibitory concentration and minimum bactericidal concentration against four important food bacteria: Salmonella typhimorium, E. coli, Listeria monocytogenes, and S. aureus. The key results revealed that M. officinalis has a strong antimicrobial effect on the bacteria tested. S. aureus with the lowest MPC value (0.12 mg/mL) was the most sensitive bacterium, although the antibacterial effect of M. officinalis was quite strong [63, 64].
Mosyagin et al. indicated that medicinal plants used in cosmetology are subject to mandatory quality control [65]. Physical and chemical methods of research are the most common. A comparative study of mint (Mentha piperita L.), thyme (Thymus serpyllum L.), and celandine (Chelidonii herba L.) infusions was performed using infrared spectroscopy for the first time. The results of mid-wave spectroscopy revealed infrared absorption peaks in different wavelength ranges for infusions of different medicinal plants. Thus, they amounted to 2900.41, 2830.12, 2123.51, and 1223.12 cm–1 for the gel based on thyme infusion; 3527.17, 2879.64, 2822.89, 1449.25, 1393.66, 1290.91, 1116.51, and 1083.03 cm–1 for celandine; and 3863.60, 3724.47, 2904.68, 2835.10, 1453.00, 1271.44, 1111.11, 1102.16, and 1034.30 cm–1 for mint.
The data obtained in the infrared spectrum of medicinal plant infusions allowed for the identification of stretching bands of carbonyl, hydroxyl, carboxyl, methyl, ether, acetal groups, compounds with aromatic ring, heterocyclic rings, in particular pyridine and quinoline rings, as well as mineral substances containing mainly phosphorus and sulfur compounds.
These groups and compounds are typical of some chemical compounds with biological activity (terpenoids, carotenoids, alkaloids, flavonoids, vitamins, acetylsalicylic, ursolic, oleanolic, and other organic acids and compounds). The results of the study can be used as reference identification IR spectra for rapid identification of medicinal plant infusions. The use of FTIR spectroscopy to study the chemical composition of medicinal plant infusions can have a wide practical value as a method of rapid analysis of medicinal plant infusions [65, 66].
ВЫВОДЫ
This study examined Eryngium maritimum L., Hedysarum neglectum Pall., Melilotus officinalis Ledeb., and Aesculus hippocastanum L. extracts. IR spectroscopy determined that the main component of E. maritimum extract samples was astragalin. Also, 3,4-dihydroxybenzoic acid, astragalin, luteolin-7-glucoside, rosmarinic acid, and chlorogenic acid were identified in the extract. In addition, peak 19.007 may correspond to hyperoside or rutin. Coumaric acid and quercetin-3D-glucoside were identified in the H. neglectum extract. Peak 19.140 may correspond to hyperoside or rutin. Large peaks of 9.883, 13.369, 15.502, 15.701, and 18.203 min were unidentified.
Astragalin, luteolin-7-glucoside, apigenin-7-O-glucoside, rosmarinic acid, and catechin were identified in M. officinalis extract samples. The extract samples of A. hippocastanum contained 3,4-dihydroxybenzoic acid, astragalin, apigenin-7-O-glucoside, kaftaric and chlorogenic acids, and catechin. The peak recorded in the spectra of all the studied samples at 3400 cm–1 is associated with absorption due to deformation vibrations of the -OH group. The absorption peak at 1725 cm–1 was due to the tensile vibration of the carbonyl group and was present only in the spectra of M. officinalis and A. hippocastanum. Furthermore, the IR spectra of all samples recorded peaks in the range 1660–1600 cm–1, which is typical of hydroxybenzoic acids and/or hydroxycinnamic acids.
We suggeste that phenolic compounds contained in E. maritimum, H. neglectum, M. officinalis, and A. hippocastanum extracts may be responsible for their antioxidant properties. Thus, the results indicated that these plant extracts might be recommended as natural antioxidants required to treat diseases caused by the presence of free radicals. However, further studies are required to determine which of the individual phenolic compounds in the E. maritimum, H. neglectum, M. officinalis, and A. hippocastanum leaves are involved in exhibiting antioxidant activity.
The plant extract of H. neglectum was found to be active against the bacteria Bacillus subtilis (diameter of the inhibition zone was 7.0 mm) and the mold fungi Candida albicans (diameter of the inhibition zone was
9.0 mm); the plant extract of E. maritimum was found to be detrimental to both Gram-positive and Gramnegative bacteria growth and development. It was found that E. maritimum extract had no fungicidal activity (test strain C. albicans).
Infrared spectroscopy is useful for the quantification of phytochemical components and impurities in plant-derived medicines and supplements. This analysis can help in further studies to determine the quality of nutritious plants to ensure the safety and efficacy of plantbased products. It has been found that chemometrics can overcome the complexity of the chemical composition of herbs. Optimization of preprocessing methods and variable selection and their combination are usually valuable in improving the predictive ability of models. This is indicated by an increase in the linearity value (in calibration and validation) and a decrease in the standard error in the model on spectra that undergo preprocessing, variable selection, and a combination of both compared to unprocessed spectra. A validation value (close to 1) indicates that the measurement of compound concentrations using the FTIR method gives an accuracy proportional to the measurement results of the reference method.
Вклад авторов
Conceptualization: O.O. Babich and S.A. Sukhikh; methodology and analyzed and interpreted the data: I.G. Samsuev, A.V. Tcibulnikova, E.S. Zemlyakova, V.A. Larina and A.D. Popov; formal analysis: O.O. Babich, S.A. Ivanova, S.Yu. Noskova and S.A. Sukhikh; writing, review and editing: O.O. Babich, S.A. Ivanova and S.A. Sukhikh; project administration: S.A. Sukhikh.
КОНФЛИКТ ИНТЕРЕСОВ
The authors declare that they have no known competing financial interests or personal relationships that could have appeared to influence the work reported in this paper.
БЛАГОДАРНОСТИ
The authors express their gratitude to V.V. Larina, senior lecturer at the BFU named after I. Kant, for her help in conducting research.
ФИНАНСИРОВАНИЕ
This research was funded by the Russian Science Foundation (RSF) , grant number 22-16-00044.СПИСОК ЛИТЕРАТУРЫ
- Altemimi A, Lakhssassi N, Baharlouei A, Watson DG, Lightfoot DA. Phytochemicals: Extraction, isolation, and identification of bioactive compounds from plant extracts. Plants. 2017;6(4). https://doi.org/10.3390/plants6040042
- Akharaiyi FC, Ehis-Eriakha CB, Olagbemide PT, Igbudu FH. Hyptis suaveolens L. leaf extracts in traditional health care systems. Foods and Raw Materials. 2023;11(2):293–299. https://doi.org/10.21603/2308-4057-2023-2-577
- Batçıoğlu K, Küçükbay F, Alagöz MA, Günal S, Yilmaztekin Y. Antioxidant and antithrombotic properties of fruit, leaf, and seed extracts of the Halhalı olive (Olea europaea L.) native to the Hatay region in Turkey. Foods and Raw Materials. 2023;11(1):84–93. https://doi.org/10.21603/2308-4057-2023-1-557
- Manley L, Shi Z. Characterizing drug product continuous manufacturing residence time distributions of major/minor excipient step changes using near infrared spectroscopy and process parameters. International Journal of Pharmaceutics. 2018;551(1–2):60–66. https://doi.org/10.1016/j.ijpharm.2018.08.059
- Babich O, Sukhikh S, Prosekov A, Asyakina L, Ivanova S. Medicinal plants to strengthen immunity during a pandemic. Pharmaceuticals. 2020;13(10). https://doi.org/10.3390/ph13100313
- Atasoy N, Yücel UM. Antioxidants from plant sources and free radicals. In: Ahmad R, Blumenberg M, editors. Reactive oxygen species. IntechOpen; 2022. https://doi.org/10.5772/intechopen.100350
- Chassagne F, Samarakoon T, Porras G, Lyles JT, Dettweiler M, Marquez L, et al. A systematic review of plants with antibacterial activities: A taxonomic and phylogenetic perspective. Frontiers in Pharmacology. 2021;11. https://doi.org/10.3389/fphar.2020.586548
- Koczoń P, Hołaj-Krzak JT, Palani BK, Bolewski T, Dabrowski J, Bartyzel BJ, et al. The analytical possibilities of FT-IR spectroscopy powered by vibrating molecules. International Journal of Molecular Sciences. 2023;24(2). https://doi.org/10.3390/ijms24021013
- Ahmed W, Azmat R, Khan SM, Khan MS, Qayyum A, Mehmood A, et al. Pharmacological studies of Adhatoda vasica and Calotropis procera as resource of bio-active compounds for various diseases. Pakistan Journal of Pharmaceutical Sciences. 2018;31(5):1975–1983.
- Napreenko MG, Napreenko-Dorokhova TV. The main patterns of present-day zonal vegetation development in Kaliningrad oblast, Russian Federation (Southeastern Baltic), inferred by palynological data. Vestnik of Saint Petersburg University. Earth Sciences. 2020;65(2):337–361. (In Russ.). https://doi.org/10.21638/spbu07.2020.207
- Ahmed W, Azmat R, Mehmood A, Qayyum A, Ahmed R, Khan SU, et al. The analysis of new higher operative bioactive compounds and chemical functional group from herbal plants through UF-HPLC-DAD and Fourier transform infrared spectroscopy methods and their biological activity with antioxidant potential process as future green chemical assay. Arabian Journal of Chemistry. 2021;14(2). https://doi.org/10.1016/j.arabjc.2020.102935
- Arumugam B, Subramaniam A, Alagaraj P. A review on impact of medicinal plants on the treatment of oral and dental diseases. Cardiovascular and Hematological Agents in Medicinal Chemistry. 2020;18(2):79–93. https://doi.org/10.2174/1871525718666200219140729
- Amantayeva ME, Kozhanova KK. Study plants of the genus Eryngium as perspective sources for obtaining phyto-substances. Vestnik KazNMU. 2019;(1):446–448. (In Russ.).
- Roshanravan N, Asgharian P, Dariushnejad H, Mesri Alamdari N, Mansoori B, Mohammadi A, et al. Eryngium billardieri induces apoptosis via Bax gene expression in pancreatic cancer cells. Advanced Pharmaceutical Bulletin. 2018;8(4):667–674. https://doi.org/10.15171/apb.2018.075
- Lin H, Zhang Z, Markl D, Zeitler JA, Shen Y. A review of the applications of OCT for analysing pharmaceutical film coatings. Applied Sciences. 2018;8(12). https://doi.org/10.3390/app8122700
- Almenova GP, Muradova SZ. Economic significance of Melilotus officinalis L. Pall. from the Fabaceae Lindl family crop wild relatives of cultivated plants of the Republic of Karakalpakstan. Academic Research in Educational Sciences. 2021;2(3):861–866. (In Russ.). https://doi.org/10.24411/2181-1385-2021-00478
- Ahmed W, Azmat R, Qayyum A, Mehmood A, Khan SM, Liaquat M, et al. The role of chitosan to prolonged the fresh fruit quality during storage of grapefruit cv. ray ruby. Pakistan Journal of Botany. 2018;50(1):151–159.
- Li W, Wang H, Dong A. Preparative separation of alkaloids from stem of Euchresta tubulosa Dunn. by high-speed counter-current chromatography using stepwise elution. Molecules. 2019;24(24). https://doi.org/10.3390/molecules24244602
- Nguyen T-D, Nguyen T-H-A, Do T-H, Tran VT-H, Nguyen H-A, Pham D-V. Anti-inflammatory effect of a triterpenoid from Balanophora laxiflora: Results of bioactivity-guided isolation. Heliyon. 2022;8(3). https://doi.org/10.1016/j.heliyon.2022.e09070
- Baliyan S, Mukherjee R, Priyadarshini A, Vibhuti A, Gupta A, Pandey RP, et al. Determination of antioxidants by DPPH radical scavenging activity and quantitative phytochemical analysis of Ficus religiosa. Molecules. 2022;27(4). https://doi.org/10.3390/molecules27041326
- Markl D, Bawuah P, Ridgway C, van den Ban S, Goodwin DJ, Ketolainen J, et al. Fast and non-destructive pore structure analysis using terahertz time-domain spectroscopy. International Journal of Pharmaceutics. 2018;537(1–2):102–110. https://doi.org/10.1016/j.ijpharm.2017.12.029
- Zimina MI, Sukhih SA, Babich OO, Noskova SYu, Abrashina AA, Prosekov AYu. Investigating antibiotic activity of the genus bacillus strains and properties of their bacteriocins in order to develop next-generation pharmaceuticals. Foods and Raw Materials. 2016;4(2):92–100. https://doi.org/10.21179/2308-4057-2016-2-92-100
- Johansson J, Sparén A, Wikström H, Tajarobi P, Koch R, Lundin P, et al. Optical porosimetry by gas in scattering media absorption spectroscopy (GASMAS) applied to roller compaction ribbons. International Journal of Pharmaceutics. 2021;592. https://doi.org/10.1016/j.ijpharm.2020.120056
- Jackson P, Borman P, Campa C, Chatfield M, Godfrey M, Hamilton P, et al. Using the analytical target profile to drive the analytical method lifecycle. Analytical Chemistry. 2019;91(4):2577–2585. https://doi.org/10.1021/acs.analchem.8b04596
- Manandhar S, Luitel S, Dahal RK. In vitro antimicrobial activity of some medicinal plants against human pathogenic bacteria. Journal of Tropical Medicine. 2019;2019. https://doi.org/10.1155/2019/1895340
- Goodwin DJ, van den Ban S, Denham M, Barylski I. Real time release testing of tablet content and content uniformity. International Journal of Pharmaceutics. 2018;537(1–2):183–192. https://doi.org/10.1016/j.ijpharm.2017.12.011
- Harms ZD, Shi Z, Kulkarni RA, Myers DP. Characterization of near-infrared and Raman spectroscopy for in-line monitoring of a low-drug load formulation in a continuous manufacturing process. Analytical Chemistry. 2019;91(13):8045–8053. https://doi.org/10.1021/acs.analchem.8b05002
- Yun Y-H, Li H-D, Deng B-C, Cao D-S. An overview of variable selection methods in multivariate analysis of near-infrared spectra. TrAC – Trends in Analytical Chemistry. 2019;113:102–115. https://doi.org/10.1016/j.trac.2019.01.018
- Atalay H, Kahriman F, Alatürk F. Estimation of dry matter, crude protein and starch values in mixed feeds by near-infrared reflectance (NIR) spectroscopy. Journal of Istanbul Veterinary Sciences. 2020;4(3):125–130. https://doi.org/10.30704/http-www-jivs-net.786427
- Ciuca MD, Racovita RC. Curcumin: Overview of extraction methods, health benefits, and encapsulation and delivery using microemulsions and nanoemulsions. International Journal of Molecular Sciences. 2023;24(10). https://doi.org/10.3390/ijms24108874
- Peris-Díaz MD, Krężel A. A guide to good practice in chemometric methods for vibrational spectroscopy, electrochemistry, and hyphenated mass spectrometry. TrAC – Trends in Analytical Chemistry. 2021;135. https://doi.org/10.1016/j.trac.2020.116157
- Junaedi EC, Lestari K, Muchtaridi M. Infrared spectroscopy technique for quantification of compounds in plant-based medicine and supplement. Journal of Advanced Pharmaceutical Technology and Research. 2021;12(1):1–7.
- Fatmarahmi DC, Susidarti RA, Swasono RT, Rohman A. Identification and quantification of metamizole in traditional herbal medicines using spectroscopy FTIR-ATR combined with chemometrics. Research Journal of Pharmacy and Technology. 2021;14(8):4413–4419. https://doi.org/10.52711/0974-360X.2021.00766
- Otsuka M. Comparative particle size determination of phenacetin bulk powder by using Kubelka-Munk theory and principal component regression analysis based on near-infrared spectroscopy. Powder Technology. 2004;141(3):244–250. https://doi.org/10.1016/j.powtec.2004.01.025
- Wang Y, Yang Y, Sun H, Dai J, Zhao M, Teng C, et al. Application of a data fusion strategy combined with multivariate statistical analysis for quantification of puerarin in Radix puerariae. Vibrational Spectroscopy. 2020;108. https://doi.org/10.1016/j.vibspec.2020.103057
- Shi Z, Hermiller J, Muñoz SG. Estimation of mass-based composition in powder mixtures using Extended Iterative Optimization Technology (EIOT). AIChE Journal. 2019;65(1):87–98. https://doi.org/10.1002/aic.16417
- Wilde AS, Haughey SA, Galvin-King P, Elliott CT. The feasibility of applying NIR and FT-IR fingerprinting to detect adulteration in black pepper. Food Control. 2019;100:1–7. https://doi.org/10.1016/j.foodcont.2018.12.039
- Kamal M, Munawar AA, Sulaiman MI. Comparison of principal component and partial least square regression method in NIRS data analysis for cocoa bean quality assessment. IOP Conference Series: Earth and Environmental Science. 2021;667. https://doi.org/10.1088/1755-1315/667/1/012058
- Mishal MR, Islam TT, Antor SH, Rahman T. A quantitative analysis of glucose from enhanced NIR spectra through linear regression model coupled with optimized bandpass filtering. Proceedings. 2018;2(13). https://doi.org/10.3390/proceedings2131010
- Grosskopf EK, Simmonds MSJ, Wallis CJ. Combining near-infrared (NIR) analysis and modelling as a fast and reliable method to determine the authenticity of agarwood (Aquilaria spp.). Analytica. 2023;4(2):231–238. https://doi.org/10.3390/analytica4020018
- Li H, Jiang D, Cao J, Zhang D. Near-infrared spectroscopy coupled chemometric algorithms for rapid origin identification and lipid content detection of Pinus koraiensis seeds. Sensors. 2020;20(17). https://doi.org/10.3390/s20174905
- Savitzky A, Golay MJE. Smoothing and differentiation of data by simplified least square procedure. Analytical Chemistry. 1964;36(8):1627–1639.
- Yang Y, Wu Y, Li W, Liu X, Zheng J, Zhang W, et al. Determination of geographical origin and icariin content of Herba Epimedii using near infrared spectroscopy and chemometrics. Spectrochimica Acta Part A: Molecular and Biomolecular Spectroscopy. 2018;191:233–240. https://doi.org/10.1016/j.saa.2017.10.019
- Johnson JB, Walsh KB, Naiker M, Ameer K. The use of infrared spectroscopy for the quantification of bioactive compounds in food: A review. Molecules. 2023;28(7). https://doi.org/10.3390/molecules28073215
- Crouter A, Briens L. Methods to assess mixing of pharmaceutical powders. AAPS PharmSciTech. 2019;20. https://doi.org/10.1208/s12249-018-1286-7
- Baltacıoğlu H, Baltacıoğlu C, Okur I, Tanrıvermiş A, Yalıç M. Optimization of microwave-assisted extraction of phenolic compounds from tomato: Characterization by FTIR and HPLC and comparison with conventional solvent extraction. Vibrational Spectroscopy. 2021;113. https://doi.org/10.1016/j.vibspec.2020.103204
- Kadiroglu P. FTIR spectroscopy for prediction of quality parameters and antimicrobial activity of commercial vinegars with chemometrics. Journal of the Science of Food and Agriculture. 2018;98(11):4121–4127. https://doi.org/10.1002/jsfa.8929
- Markl D, Strobel A, Schlossnikl R, Bøtker J, Bawuah P, Ridgway C, et al. Characterisation of pore structures of pharmaceutical tablets: A review. International Journal of Pharmaceutics. 2018;538(1–2):188–214. https://doi.org/10.1016/j.ijpharm.2018.01.017
- Markl D, Wang P, Ridgway C, Karttunen A-P, Bawuah P, Ketolainen J, et al. Resolving the rapid water absorption of porous functionalised calcium carbonate powder compacts by terahertz pulsed imaging. Chemical Engineering Research and Design. 2018;132:1082–1090. https://doi.org/10.1016/j.cherd.2017.12.048
- Nagy B, Farkas A, Borbás E, Vass P, Nagy ZK, Marosi G. Raman spectroscopy for process analytical technologies of pharmaceutical secondary manufacturing. AAPS PharmSciTech. 2018;20. https://doi.org/10.1208/s12249-018-1201-2
- Sisay MA, Mammo W, Yaya EE. Phytochemical studies of Melilotus officinalis. Bulletin of the Chemical Society of Ethiopia. 2021;35(1):141–150. https://doi.org/10.4314/bcse.v35i1.12
- Nagy B, Petra D, Galata DL, Démuth B, Borbás E, Marosi G, et al. Application of artificial neural networks for Process Analytical Technology-based dissolution testing. International Journal of Pharmaceutics. 2019;567. https://doi.org/10.1016/j.ijpharm.2019.118464
- Palmer J, O’Malley CJ, Wade MJ, Martin EB, Page T, Montague GA. Opportunities for process control and quality assurance using online NIR analysis to a continuous wet granulation tableting line. Journal of Pharmaceutical Innovation. 2020;15:26–40. https://doi.org/10.1007/s12247-018-9364-7
- Pauli V, Roggo Y, Pellegatti L, Nguyen Trung NQ, Elbaz F, Ensslin S, et al. Process analytical technology for continuous manufacturing tableting processing: A case study. Journal of Pharmaceutical and Biomedical Analysis. 2019;162:101–111. https://doi.org/10.1016/j.jpba.2018.09.016
- Sacher S, Wahl P, Weißensteiner M, Wolfgang M, Pokhilchuk Ye, Looser B, et al. Shedding light on coatings: Real-time monitoring of coating quality at industrial scale. International Journal of Pharmaceutics. 2019;566:57–66. https://doi.org/10.1016/j.ijpharm.2019.05.048
- Zaborenko N, Shi Z, Corredor CC, Smith-Goettler B, Zhang L, Hermans A, et al. First-principles and empirical approaches to predicting in vitro dissolution for pharmaceutical formulation and process development and for product release testing. The AAPS Journal. 2019;21. https://doi.org/10.1208/s12248-019-0297-y
- Dmitrieva AI, Drozdova MYu, Dolganyuk VF. Development of methods for purification of individual biological active substances obtained from extracts of Hedysarum neglectum. https://doi.org/10.1101/2021.06.06.447004
- Küp FÖ, Çoşkunçay S, Duman F. Biosynthesis of silver nanoparticles using leaf extract of Aesculus hippocastanum (horse chestnut): Evaluation of their antibacterial, antioxidant and drug release system activities. Materials Science and Engineering: C. 2020;107. https://doi.org/10.1016/j.msec.2019.110207
- Kumar B, Smita K, Cumbal L. Biosynthesis of silver nanoparticles using Lavender leaf and their applications for catalytic, sensing and antioxidant activities. Nanotechnology Reviews. 2016;5(6):521–528. https://doi.org/10.1515/ntrev-2016-0041
- Khar’kov YK, Mbarga MJA, Martynenkova AV, Podoprigora VI, Volina EG, Azova MM, et al. Assessment of antimicrobial activity of ethanolic and aqueous extracts of Aesculus hippocastanum L. (horse chestnut) bark against bacteria isolated from urine of patients diagnosed positive to urinary tract infections. Frontiers in Bioscience (Scholar). 2022;14(2). https://doi.org/10.31083/j.fbs1402011
- Dahash SL, Abass OK, Abdul-Razaq MM, Al-Kuraishy HM, Al-Gareeb AI. Aesculus hippocastanum-derived extract β-aescin and in vitro antibacterial activity. Journal of Microscopy and Ultrastructure. 2021;9(1):26–30.
- Ehsani A, Alizadeh O, Hashemi M, Afshari A, Aminzare M. Phytochemical, antioxidant and antibacterial properties of Melilotus officinalis and Dracocephalum moldavica essential oils. Veterinary Research Forum. 2017;8(3):223–229.
- Yu M, Gouvinhas I, Rocha J, Barros AIRNA. Phytochemical and antioxidant analysis of medicinal and food plants towards bioactive food and pharmaceutical resources. Scientific Reports. 2021;11. https://doi.org/10.1038/s41598-021-89437-4
- Zhang C, Xin X, Zhang J, Zhu S, Niu E, Zhou Z, et al. Comparative evaluation of the phytochemical profiles and antioxidant potentials of olive leaves from 32 cultivars grown in China. Molecules. 2022;27(4). https://doi.org/10.3390/molecules27041292
- Mosyagin VV, Ryzhkova GF, Bialyaev AG, Minenkov NA, Kanunnikova TV, Lebedeva NV. Infrared spectroscopy of cosmetic gels based on medicinal plants. Advances in Health Sciences Research, Volume 28. Atlantis Press; 2020. pp. 12–15. https://doi.org/10.2991/ahsr.k.201001.003
- Prosekov AYu, Babich OO, Bespomestnykh KV. Identification of industrially important lactic acid bacteria in foodstuffs. Foods and Raw Materials. 2013;1(2):42–45. https://doi.org/10.12737/2053
