

Аннотация
Whole-wheat flour of purple wheat varieties contains anthocyanins and other phenolic compounds with high antioxidant activity, which makes it a potential raw material for functional foods. The content and composition of phenolic compounds in whole-wheat flour depends on the genotype and weather conditions; in the bread, however, they also depend on the bread-making technology. This article offers a comparative analysis of phenolic compounds in purple whole-wheat flour and bread baked from this flour.The study featured purple soft spring wheat (Triticum aestivum L.) of two varieties, Nadira and Line 193, which were harvested in 2016 and 2017, and corresponding bread samples. The antioxidant activity and phenolic content were measured spectrophotometrically while the qualitative analysis relied on the method of high-performance liquid chromatography (HPLC).
In the hot and dry year of 2016, the content of bound phenolic acids reached 2.0–2.4 mg/g dry weight in the flour of both genotypes. In the cool and humid year of 2017, the content of anthocyanins in the Nadira flour increased by 2.7 times and amounted to 0.65 mg/g dry weight. However, the corresponding bread sample had a much lower phenolic content: soluble phenolics were halved, anthocyanins dropped by 3–4 times, and bound phenolic acids went down by 7–17 times. The content of bound phenolic acids in the flour correlated positively with the content of free phenolic acids in the bread. The HPLC analysis revealed an increase in the content of free hydroxycinnamic acids in the bread: p-coumaric acid was the most abundant and amounted to 0.14–0.22 mg/g dry weight.
Conventional State Standard 27669-88 for bread making resulted in a total decrease in anthocyanins, bound phenolic acids, and most free phenolics. Therefore, this technology cannot be applied to functional bread. The results can help develop a breadmaking technology for purple wheat varieties.
Ключевые слова
Triticum aestivum L., purple wheat, whole-wheat flour, bread, phenolic compounds, anthocyanins, phenolic acids, antioxidant activityВВЕДЕНИЕ
Bread has always been part of the daily dietary pattern in Russia and worldwide. As a source of basic nutrients, minerals, and biologically active substances, bread provides 10–20% of calories, 20% simple and complex carbohydrates, 20% dietary fiber and 11% protein [1–3]. White-flour bread comes from debranned/ refined grain, which means that each seed has been cleaned from its pericarp, seed coat, and germ. While white-flour bread remains the most popular flour product, whole-grain wheat flour is a much more balanced raw material in terms of amino acids, fibers, phenolic compounds, carotenoids, vitamins, and minerals [1–4].
Whole grains are an inherent part of almost any healthy diet [5]. Whole-grain foods reduce excess weight, normalize cholesterol, as well as prevent diabetes, cardiovascular diseases, metabolic conditions, and cancers [6, 7]. Dietary fiber improves gastrointestinal motility and intestinal microbiota while phenolic compounds produce a certain antioxidant effect [5–11]. Humans and higher animals cannot synthesize phenolic compounds and have to obtain them with plant foods. In this respect, cereals are a daily source of not only proteins and carbohydrates, but also phenolic compounds [12]. Grain contains both free and bound phenolic compounds, e.g., in cell walls or as links between polysaccharide and/or protein molecules. Free phenolic compounds are antioxidants [10]. As a rule, symbiont intestinal microflora releases bound phenolic compounds gradually.Phenolic acids and flavonoids are the main phenolic compounds in cereals [2, 7]. These powerful antioxidants are to be found in the pericarp, the seed coat, and the germ [7, 10, 11]. Purple wheat also contains anthocyanins in its pericarp, which give these sorts extra antioxidant properties [9, 13, 14]. Whole-wheat flours have higher antioxidant activity levels than traditional white flours, with whole-wheat flours of anthocyanin-pigmented cultivars having the highest levels of antioxidant activity [2, 11, 13]. Similarly, whole-wheat bread, especially that made of purple varieties, possesses greater antioxidant effect than white-flour bakery products [13]. In Europe and North America, purple wheats are a source of popular functional foods, e.g., bread, crackers, and even confectionery bakery products [8, 13, 15–17].
In the Russian Federation, purple-grain wheat lines adapted to the local climatic conditions have been developed [18, 19]. However, the share of therapeutic bakery products on the Russian market is as low as 2% of total production, not to mention that purple wheat has never found its way on it [20, 21]. The beneficial properties of domestic purple-wheat bread and pastry have just barely attracted scientific attention [19, 22], and no reliable production technology has been developed so far. The Nadira variety is the first Russian patented purple wheat [23]. Its white flour demonstrated baking properties very similar to those of traditional premium wheat [19]. The total baking score for white flour bread was 4.4 out of 5, while the whole wheat flour bread had a score of 4 [19]. Obviously, the Nadira flour proved suitable for baking. However, whole-wheat bread from the Nadira variety has never been tested for antioxidant properties and phenolic compounds.
Bread making includes four basic stages: kneading, fermenting, proofing, and baking. Each stage causes certain chemical changes that lead to qualitative and quantitative changes in the composition of the final product. During kneading and fermentation, gluten proteins bind water while polypeptide chains cross-link with disulfide bridges to form a single gluten matrix. The rheological properties of the dough depend on this matrix. Hydrolase activation occurs when glycosidases break down polysaccharides into simple sugars, and esterases release phenolics bound with polysaccharides [24]. Kneading, fermentation, and proofing reduce the content of anthocyanins while simultaneously increase the content of phenolic acids. The resulting content of phenolic acids depends both on the total phenolics in the flour and the duration of each stage [13]. The high temperatures triggers various processes that affect phenolic structure, i.e., isomerization and cleavage of glycosidic and/or ether bonds. As a result, during the baking stage both the formation and conversion/degradation of phenolic compounds occur. Indeed, the content and composition of anthocyanins and other phenolics in bread and other bakery products may differ from those in the grain they were made from [13, 15–17]. By changing the baking time and temperature, bakers can modify phenolic composition [13, 16, 25]. Therefore, bread making causes dynamic changes in the qualitative and quantitative phenolic content of the final product, depending on the production technology, as well as on the phenolic content and genotype of cereals [16, 17, 26].
However, genotype is not the only factor that affects phenolics. Biotic and abiotic stress factors, e.g., weather conditions, are able to increase phenolic synthesis [2]. Each genotype has its own stress-causing conditions. In a previous study, we proved that the Nadira variety experiences moderate temperatures and sufficient moisture as optimal, in contrast to line 193 [27]. Under different weather conditions, the content and composition of anthocyanin and other phenolics may vary greatly for one and the same genotype [27]. The question remains, to what extent these differences in the composition of whole-wheat flour will be passed on to the corresponding bread. Presumably, the phenolic content in bakery products from whole-wheat flour of the same genotype will be different if the harvest year is different. Numerous publications feature the effect of weather conditions on the phenolic content of cereals [2, 28, 29]. However, no studies so far attempted to identify the correlation between the genotype- and weatherrelated phenolic composition of whole-wheat flour and the phenolic composition in the bread baked from this whole-wheat flour.
This article introduces a comparative quantitative and qualitative assessment of phenolic and anthocyanin profile of bread samples baked according to State Standard 27669-88 from whole-grain flour of two varieties of purple spring soft wheat grown and harvested under contrasting weather conditions.
ОБЪЕКТЫ И МЕТОДЫ ИССЛЕДОВАНИЯ
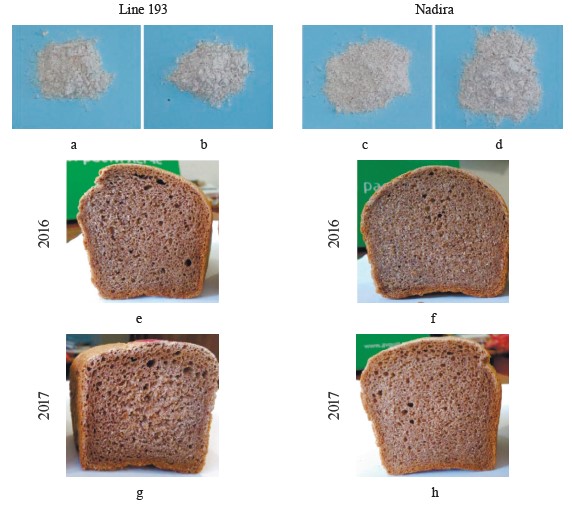
This research featured purple spring soft wheats (Triticum aestivum L.) of two varieties, namely cultivar Nadira (hereinafter Nadira) and line Kk-193-08-1 (hereinafter line 193). The varieties were harvested by the Tatar Research Institute of Agriculture, FRC Kazan Scientific Center of RAS, in 2016 and 2017. To obtain whole-wheat flour (Fig. 1a–d), we ground the grain in a MM400 ball mill (Retsch, Germany) at 25 Hz for 3 min. The bread-making procedure followed State Standard 27669-88 under laboratory conditions. The resulting bread samples (Fig. 1e–h) were freeze-dried in an Alpha 14 LD-2 freeze dryer (Martin Christ, Germany) and ground in a ball mill under the above mentioned conditions.
After that, the homogenate was centrifuged in a MiniSpin centrifuge (Eppendorf, USA) at 10 000 g for 10 min. Upon collecting the supernatant, we washed the precipitate twice with 0.25 mL of 60% acidified ethanol and subjected it to ultrasonic treatment. The combined supernatants were used to determine the antioxidant activity as well as the content and composition of anthocyanins and other phenolics.
We used the Folin – Ciocalteu method to define the content of soluble phenolics, as well as free and bound phenolics [30]. The procedure involved a LAMBDA 25 spectrophotometer (PerkinElmer, USA). The results were calculated as milligram equivalent of gallic acid per 1 g dry weight. The anthocyanin content was determined by measuring the optical density of ethanol extracts at 525 nm. We used cyanidin-3-O-glucoside (Sigma-Aldrich, USA) to plot the calibration curve. The results were expressed as milligram equivalent of cyanidin-3-O-glu- coside per 1 g dry weight. The antioxidant activity tests involved diphenylpicrylhydrazine (AlfaAesar, USA) and followed the pattern previously described [27].
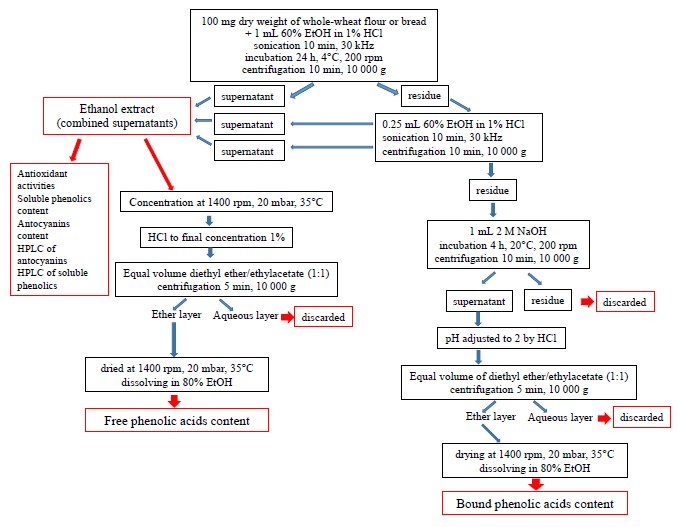
To isolate phenolic acids, we modified the method developed by Kim et al. (Fig. 2) [31]. For free phenolic acids, we concentrated the ethanol extract at 35°C and 20 mbar on a vacuum concentrator (Concentrator Plus, Eppendorf, USA) and poured in 1% HCl to reach the final volume of 1 mL. After that, we added a mix of diethyl ether and ethyl acetate (1:1). The resulting mix was centrifuged for 5 min at 10 000 g to collect and dry the upper ether phase. The dry sample was dissolved in 80% ethanol to define the content of free phenolic acids.
For bound phenolic acids, we extracted 2 M NaOH from the sediment that remained after the extraction of soluble phenolics. The procedure lasted 4 h at 20°C on a shaker. After collecting the supernatant from the homogenate centrifuged at 10 000 g for 10 min, the pH of the extract was adjusted to 2 and added a mix of diethyl ether and ethyl acetate (1:1). To isolate bound phenolic acids from the solvent mix, we performed the same procedure as for free phenolic acids (Fig. 2). The dried samples were dissolved in 80% ethanol to determine the content of bound phenolic acids.
To compare the phenolic content in the bread samples with that in the whole-wheat flour, we used the formula below [26]:
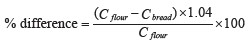
where C flour is the content of phenolics in 1 g of flour, mg, and C bread is the content of phenolics in 1 g of bread, mg. The coefficient equaled 1.04 and depended on the share of flour in the total weight of dry ingredients specified in State Standard 27669-88.
A similar formula was used to calculated the difference in antioxidant activities.
The chromatographic analysis involved reverse-phase high performance liquid chromatography (RP-HPLC) on a Breeze chromatograph (Waters, USA) and a Waters 2489 UV/VIS dual-wave detector (Waters, USA). A reverse-phase Symmetry® C18 column (Waters, USA) served as the stationary phase: 3.9×150 mm column size, 5 μm particle size, 100 Å pore size.
To study anthocyanins, we used two solutions as the mobile phase. Solution A consisted of 10% acetic acid while solution B involved acetonitrile, water, and glacial acetic acid (10:9:1, v/v). The separation was in line with the following pattern: 2 min – 100% solution A, 10 min – 25% solution B, 10 min – 50% solution B. The mobile phase feed rate was 0.5 mL/min. The volume of the injected sample was 20 µL. The peak detection occurred at 525 nm. Cyanidin-3-glucoside and cyanidin (Sigma-Aldrich, USA) served as standards.
For other phenolics, the mobile phase was represented by solution A (6% acetic acid) and solution B (60% methanol in 6% acetic acid). Solution B was graded as follows: 0–1 min – solution A; 1–6 min – 0–25% solution B; 6–16 min – 25–100% solution B; 16–21 min – 100% solution B; 21–25 min – 100% solution B. The mobile phase feed rate was 0.5 mL/min. The volume of the injected sample was 20 µL. The peaks were detected at 280 nm. For phenolic acids and flavonoids, the procedure relied on the reference peaks for gallic, p-coumaric, ferulic, sinapic, and benzoic acids and rutin, quercetin, and kaempferol (Sigma-Aldrich, USA). The contents of the chromatographically identified phenolics were determined using the calibration curves constructed from the areas of chromatographic peaks for standard phenolics.
The statistical data processing involved the SigmaPlot program and a two-factor analysis of variance (ANOVA) to be presented as mean ± standard error. The differences were declared significant based on the Tukey multiple comparison test (p ≤ 0.05). Pearson's correlation coefficients were calculated at p ≤ 0.05. The principal component analysis was carried out using OriginPro 2017.
РЕЗУЛЬТАТЫ И ИХ ОБСУЖДЕНИЕ
Defining soluble phenolics and antioxidant properties of flour and bread. The purple wheat varieties line 193 and Nadira were harvested in 2016 and 2017. Those years differed in weather conditions. The year of 2016 was hot and dry while 2017 was cool and humid. The content of soluble phenolics in the Nadira flour samples from 2016 was by 18% lower compared to the samples harvested in 2017. For line 193, the content of soluble phenolics in the 2016 samples was, on the contrary, by 7% higher (Fig. 3a). As for the bread, the phenolic content was by 44–48% lower than in the flour (Table 1) and amounted to 1.1–1.3 mg/g dry weight (Fig. 3b). Table 2 demonstrates that the year-related changes in the phenolic content correlated in the bread and the flour (r = +0.81).
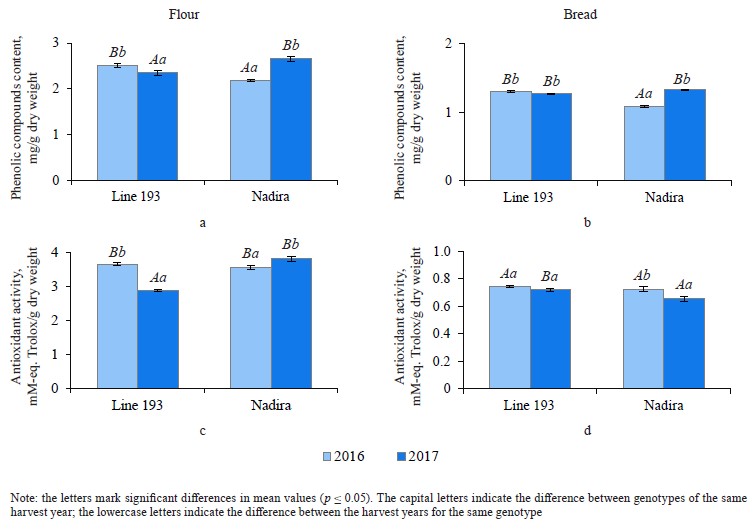
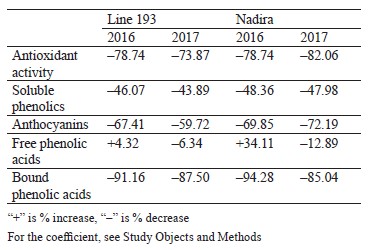
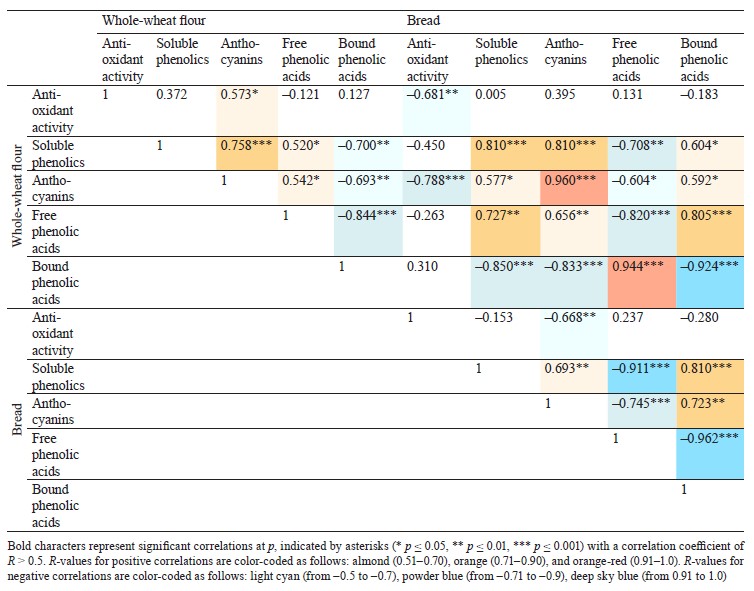
In the bread samples, the antioxidant activity was by 74–82% lower than that in the flour (Table 1). In addition, it did not depend on the phenolic content (Fig. 3c and d, Table 2). The antioxidant properties are known to depend on the phenolic structure. A particular phenolic composition may cause synergism, additivity, or antagonism [10]. Consequently, phenolic composition has a greater effect on the antioxidant activity of bread than the phenolic content in whole-wheat flour.
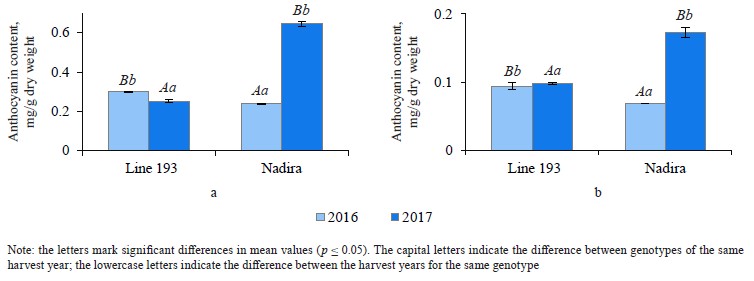
Analyzing the composition and content of anthocyanins in flour and bread. The anthocyanin content in the wheat of two genotypes depended on weather conditions. The dry and hot year of 2016 increased the anthocyanin content in line 193. However, it was the cool and wet year of 2017 that had the same effect on the Nadira variety (Fig. 4). After baking, the anthocyanin content dropped by 3.3–3.6 times in the Nadira variety irad by 2.5–3.1 times in line 193 (Fig. 4). As a result, the bread samples maintained only 28–40% of the initial anthocyanin content (Table 1). The anthocyanin content in the flour samples correlated with their phenolic content (r = +0.76) and antioxidant activity (r = +0.57), as well as with the anthocyanin content in the corresponding bread samples (r = +0.96) (Table 2). However, we detected no positive correlation between the antioxidant activity of the bread and its anthocyanin content (Table 2). Probably, anthocyanins with high antioxidant activity were more affected by the baking process that those with poor antioxidant properties. Since anthocyanins vary in antioxidant properties and thermal stability,0,6 me of them can be strong antioxidants and thermolabile compounds at the same time [9, 16, 17].
Under the effect of peroxidases, anthocyanins may start degrading as early as during kneading [24]. Beta et al. used the Canadian Short Process Bread Baking to register a significant decrease in anthocyanins (1.1–1.2 times) and qualitative changes in the phenolic composition during the first three stages [13]. However, it was the baking stage that produced the most significant effect and reduced the anthocyanin content by 2.2 times [13]. Bartl et al. reported that a shorter baking time preserved more anthocyanins [16]. After 30 min at 180°C, 27% of anthocyanins remained in the flour; however, 21 min at even higher temperatures (240°C) spared 39% of anthocyanins [16]. Gamel et al. reported similar results for the bread-making standards published by the American Association of Cereal Chemists (Method 10.10.3) [15]. After 17 min at 215°C, the bread maintained 38% of the initial anthocyanins. Consequently, fermentation and baking time is as important as the initial anthocyanin composition and content in the flour.
According to Eliášová et al., different purple wheat varieties had different anthocyanin composition, hence the different anthocyanin content in the corresponding bread [17]. The AF Jumiko variety with its peonidin-3-glucoside demonstrated the best resistance to anthocyanin degradation. The Konini variety had a lot of thermolabile delphinidin glycosides (30%) and proved to be the least resistant sample in the test. Thus, the anthocyanin content in bread depends both on the total anthocyanin content in the flour, the qualitative composition of anthocyanin in the flour, and the baking mode.
Figure 5 illustrates the HPLC analysis of anthocyanins in the flour and in the corresponding bread samples. Since the anthocyanins obtained from the flour and the bread demonstrated very different peak absorption intensity, the chromatograms contained two ordinate axes: the left axe illustrated the data obtained for the flour samples and the right axe was reserved for the bread samples. The HPLC revealed ten compounds (peaks 1–10): nine belonged to both lines while the compound that peaked 9 was specific to line 193. Cyanidin-3-glucoside (peak 1) and its aglycone, cyanidin (peak 10), covered the largest area (Fig. 5). In 2017, the content of cyanidin-3-glucoside in the Nadira flour was 2.7 times higher than in 2016. It exceeded the data for line 193 by 2.2 and 2.6 times in 2016 and 2017, respectively. Most publications report cyanidin-3-glucoside as the most frequent anthocyanin identified for purple wheats [2, 32]. Other studies may report other cyanidin glycosides, as well as glycosides of pelargonidin, peonidin, malvinidin, petunidin, and sometimes delphinidin [16, 32].
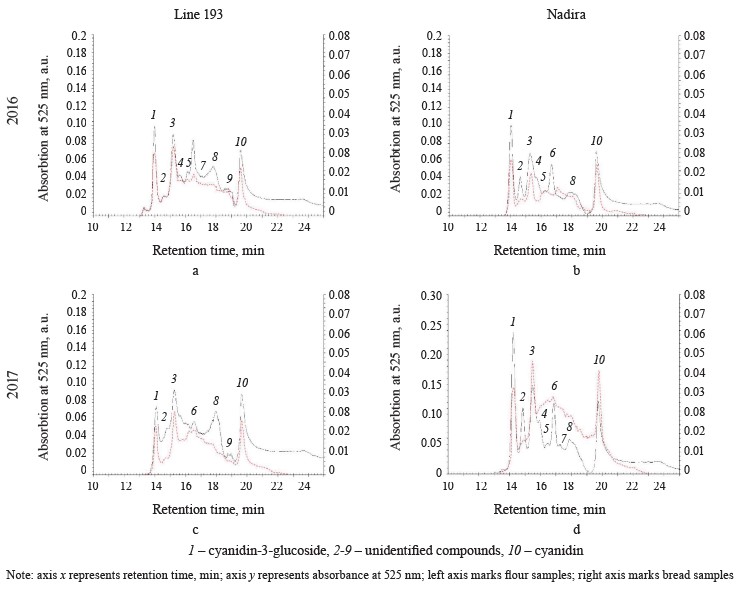
The HPLC-analysis also revealed genotype differences. The height of peak 8 in the line 193 samples exceeded that in the Nadira samples, while peak 2 showed an opposite trend (Fig. 5). The whole-wheat flour obtained from line 193 in 2016 (peak 8) had less anthocyanin than the samples obtained from the harvest of 2017; peaks 3, 6, and 9 were more intensive. Compared to 2016, the content of all anthocyanins of Nadira increased in 2017 and the changes in the proportions of anthocyanins were minor.
The bread samples demonstrated a different HPLC anthocyanin spectrum. The total area of all peaks combined dropped by 4.5–5.4. Peaks 1, 3, and 10 were the most common, their share in the total area of all anthocyanin peaks occupied 87% for line 193 and 91% for the Nadira variety. Other peaks became minor (Fig. 5): apparently, they corresponded with thermolabile anthocyanins. Cyanidin-3-glucoside, peak 3, and cyanidin appeared to be the most variable peaks for the bread samples. The changes were quantitative and mirrored the variations in the corresponding flour samples.
It takes some time for heat to destroy anthocyanins. First, they are deacylated and deglycosylated, releasing sugars. Acylated anthocyanins release phenolic acids. Acylated anthocyanins are the most numerous anthocyanins in purple wheats [16, 32]. Long thermal exposure destroys anthocyanidins, releasing phloroglucinaldehyde and hydroxybenzoic phenolic acids, corresponding to the structure of the B-ring of the anthocyanin. For example, protocatechuic acid comes from cyanidin, while gallic acid comes from delphinidin [33]. Since phloroglucinaldehyde is thermolabile and hydroxybenzoic acids are more stable, these phenolic acids usually end up in the fraction of free phenolic acids of bread [33].
Phenolic acid fractions in flour and bread. Table 2 clearly demonstrates a high degree of negative correlation between the fractions of free and bound phenolic acids in the flour samples (r = –0.844). In the dry year of 2016, the Nadira variety had a 1.2-fold decrease in soluble phenolic acids and a 1.7-fold increase in bound phenolic acids, compared to 2017. The line 193 samples also demonstrated an increase in bound phenolic acids, although to a lesser extent (1.22 times), compared to the Nadira variety (Fig. 6). During droughts, more phenolics enter cell walls to strengthen their structure [34]. However, this process is different in different genotypes.
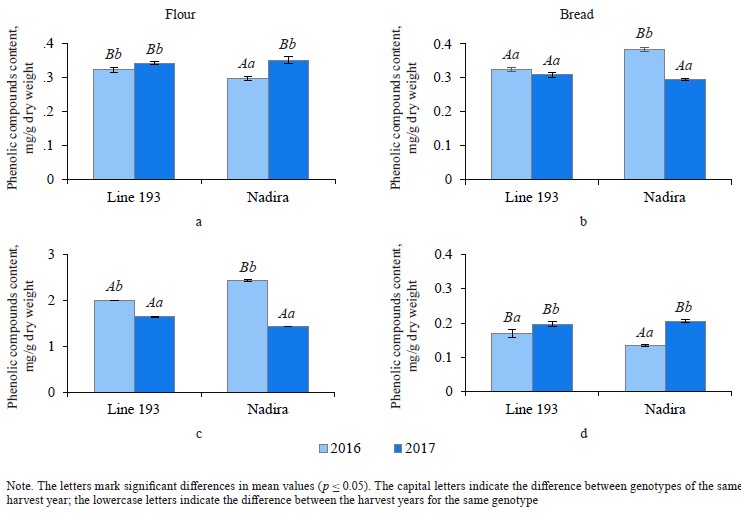
In bread from the wheat harvested in 2017, the content of soluble phenolic compounds decreased by 1.1– 1.2 times, compared to the corresponding flour samples. As for the harvest of 2016, the situation was different:
in the line 193 samples, the content of soluble phenolic compounds remained the same; in the Nadira variety, it increased by 1.3 times (Fig. 6a and b). The content of bound phenolic acids in the bread dropped down to 5–15% of their initial content in the flour, i.e., from 1.4–2.4 mg to 0.13–0.21 mg (Fig. 6, Table 1). The data obtained for bound phenolic acids in the flour and in the bread demonstrated a high degree of negative correlation (r = –0.924, p ≤ 0.001) (Table 2). A similarly high degree of negative correlation occurred between bound and free phenolic acids in the bread samples (r = –0.962, p ≤ 0.001) (Table 2). However, a high positive correlation was detected between bound phenolic acids in the flour and free phenolic acids in the bread (r = +0.944, p ≤ 0.001) (Table 2).
The complex biochemical processes that take place at the dough fermentation stage release bound phenolic acids [24]. For instance, most muffins and cookies require no fermentation stage. As a result, they maintain the initial content of bound phenolic acids while bread, which cannot be baked without fermentation, contains less phenolic acid [26]. High-temperature baking destroys phenolic acids [35, 36]. In this research, the bread had less phenolic acid compared its initial content in the flour because its production time was quite long and presupposed conditions for a more active release of bound phenolic acids during proofing and fermentation, and then free phenolic acids were destroyed by baking. State Standard 27669-88 establishes 55 min of baking time at 200–210°C, which destroys most phenolic compounds. Studies that involved other formulations reported an increase in the content of free phenolic acids in bread [13, 26]. In our study, only one bread sample demonstrated this trend: it was the bread baked from the Nadira grain harvested in 2016 (Fig. 6b). Apparently, this increase corresponded with the higher content of bound phenolic acids in this flour, which was 2.44 mg while other flour samples had it as low as 1.4–2.0 mg (Fig. 6c). This sample seemed to release more bound phenolic acids, part of which do not completely degrade during the baking stage.
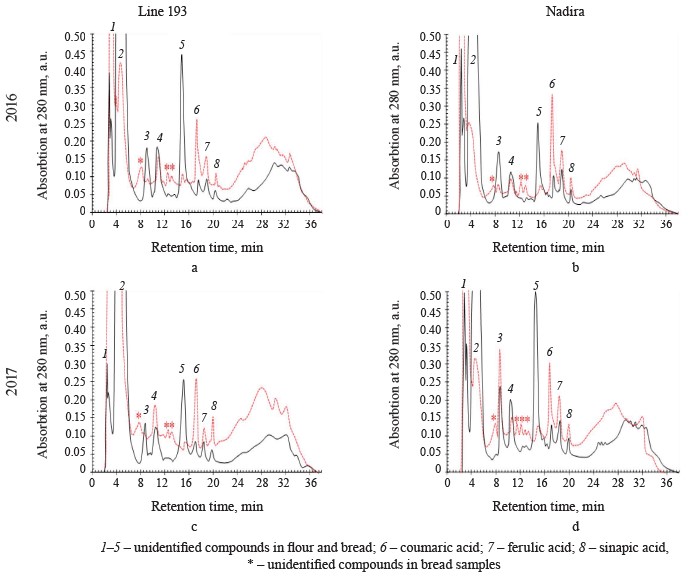
HPLC analysis of soluble phenolics. Ferulic, vanillic, sinapic, and hydroxybenzoic acids are the most abundant free phenolic acids in wheat. Their proportion depends on the genotype and weather conditions [2, 28, 29]. Ferulic and vanillic acids were usually reported as domineering, with some exceptions [28, 31, 37, 38]. The HPLC analysis of soluble phenolics (Fig. 7) revealed peaks of varying intensity, which corresponded with hydroxycinnamic acids, i.e., ferulic, sinapic, and p-coumaric. Due to their high antioxidant activities, hydroxycinnamic acids exhibit various therapeutic and preventive effects on people and animals [10, 39]. Ferulic and p-coumaric acids are the most bioavailable compounds from whole-wheat flour. In addition, they are believed to prevent cancer and cardiovascular diseases [39, 40]. In the Nadira flour, the content of ferulic and sinapic acids exceeded that in the line 193 flour samples (Table 3). In line 193, the content of coumaric acid depended on the year: it amounted to 30.1 and 40.2 μg/g dry weight in 2016 and 2017, respectively. Unlike line 193, the Nadira flour maintained almost the same content of coumaric acid, which stayed 39–40 μg/g dry weight under different weather conditions.
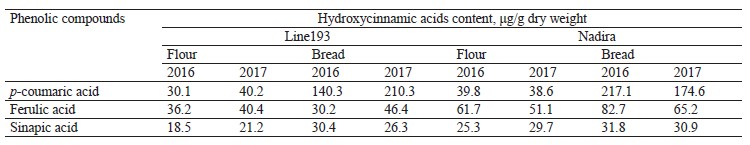
The Nadira bread samples contained more ferulic acid than the line 193 bread samples. The bread samples made from the grain harvested in 2016 demonstrated the most significant difference (2.7 times) (Table 3) because ferulic acid accumulated in the bound phenolic acids of flour to be released. Ferulic acid dominates the fraction of bound phenolic acids of wheat grain, regardless of its variety [28, 31, 37]. Some phenolic acids are thermostable and some are thermolabile. Ferulic acid was reported to be a thermolabile compound while gallic, caffeic, protocatechuic, and coumaric acids proved more resistant to high temperatures [35, 36, 41].
In our study, however, the content of coumaric acid appeared to be much higher in bread than in the corresponding flour samples (Table 3). Other hydroxycinnamic acids also had more intensive peaks in the bread samples than in the flour although the difference was quite unremarkable (Fig. 7). The long baking time apparently contributed to the destruction of ferulic acid and the accumulation of more thermostable coumaric acid. The fermentation stage releases phenolic acids associated with oligo- and polysaccharides, as well as flavonoids, including anthocyanins. Acylated anthocyanins were reported to contain p-coumaric acid [16]. For instance, Beta et al. showed that the content of coumaric acid in bread made from purple whole-wheat flour was seven times as high as in bread baked from white-wheat whole-grain flour [13].
Peaks 1, 2, and 5 had the largest areas among the unidentified peaks of flour phenolic compounds (Fig. 7). In the flour samples of both genotypes, the area of peak 1 was smaller than in the bread while peak 2, on the contrary, was significantly larger. The total area of peaks 2–5 was much smaller in the bread samples. The only exception was peak 3 in the bread made from the Nadira wheat harvested in 2017 (Fig. 7). The response to weather conditions depended on the wheat variety. In the Nadira flour, peaks 4 and 5 were lower in 2016 than in 2017; in line 193, the picture was quite opposite (Fig. 7).The unidentified peaks may relate to flavonoids or some phenolics that are typical of whole-wheat flour, e.g., hydroxybenzoic, vanillic, gallic, and syringic acids [28, 31, 38]. Other studies reported thermostable protocatechuic acid in grain and bread obtained from purple wheats [13, 38, 42]. Protocatechuic acid can be released from the fraction of bound phenolic acids; it may also appear during the destruction of cyanidin and/or ferulic acid [43]. Some minor phenolic peaks that we registered in the bread but not in the flour could also be attributed to the destruction of thermolabile phenolics, primarily anthocyanins. In Fig. 7, they are marked with an asterisk.
To sum up, the content of soluble phenolics in the bread was halved compared to their initial content in the flour while the content of hydroxycinnamic acids increased. Most likely, it happened after the release of bound phenolics or after the destruction of complex phenolics, e.g., anthocyanins, which, as a result, were underrepresented in the bread.
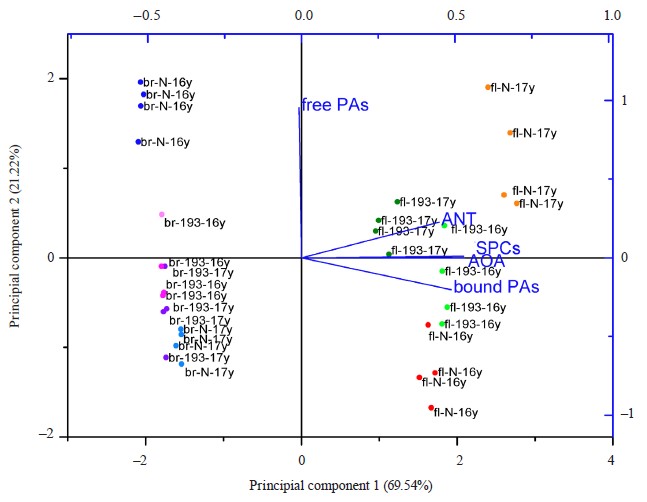
The principal component analysis made it possible to identify the most variable factors and the differences between the samples for all factors. According to the biplot (Fig. 8), principal component 1 depended on most parameters, i.e., antioxidant activity, anthocyanin content, phenolic substances, and bound phenolic acids. It covered 69.54% of the differences between the samples. Principal component 2 was associated primarily with the content of free phenolic acids and was responsible for 21.2% cases. The samples made up several clusters (Fig. 8). The flour samples grouped on the positive side of principal component 1, which means that they had higher values for these parameters compared to the bread samples, which occupied the negative side of the graph along axis x. The Nadira flour samples from 2016 and 2017 demonstrated more differences than the flour obtained from line 193. The Nadira bread from the harvest of 2016 formed a separate cluster while the other bread samples seemed to be rather similar in most characteristics. In most cases, the weather-induced phenolic changes in the flour were leveled out after the baking. However, the abundance of bound phenolic acids in the flour may have been that single beneficial weather-related change which resulted in the abundance of free phenolic acids in the bread after baking.
ВЫВОДЫ
New functional food technologies require an integrated approach. The phenolic content of wheat depends on the combination of weather conditions and genotype while it is the bread-making technology that preserves biologically active substances in whole-wheat flour. The high anthocyanin content in the purple wheat of the Nadira variety harvested in 2017 seemed a valuable property to be used in functional foods. However, the long bread-making process in line with State Standard 2766988 destroyed most anthocyanins and other soluble phenolics. As a result, the bread had much poorer antioxidant properties than the flour it was made from.
The bread baked from the Nadira wheat harvested in 2016 was the only sample to increase the content of free phenolic acids because the grain accumulated a lot of bound phenolic acids in response to the dry and hot weather conditions in 2016.
As a result of the bread-making procedures stipulated by State Standard 27669-88, the content of bound phenolic acids in the bread dropped by 85–95%, compared to the flour. However, the content of free hydroxycinnamic phenolic acids increased, especially that of p-cou- maric acid. The amount of ferulic and sinapic acids also increased but to a lesser extent because the long baking destroyed them.
Therefore, bread-makers need to develop new technology to produce functional bread from purple wheat if they want to preserve the original amount of anthocyanin, phenolic acids, and other phenolics. Apparently, this new technology should have a shorter fermentation and baking time.Вклад авторов
A.I. Valieva developed the research concept, provided the data validation and curation, performed the formal analysis, wrote the draft, designed the figures and tables, and proofread the manuscript. A.N. Akulov designed the methodology, validated and curated the data, performed the empirical research, and proofread the manuscript. N.I. Rumyantseva supervised the research, obtained funding, validated the data, obtained the resources, and proofread the manuscript. All the authors have read and agreed to the final version of the manuscript.
КОНФЛИКТ ИНТЕРЕСОВ
The authors declared no conflict of interests regarding the publication of this article.
БЛАГОДАРНОСТИ
The authors are grateful to the staff of the Laboratory of Spring Wheat Breeding, Tatar Research Institute of Agriculture, FRC Kazan Scientific Center of RAS, for the samples of grain and bread.
ФИНАНСИРОВАНИЕ
The study was funded by the Ministry of Science and Higher Education of the Russian Federation (Minobrnauki) as part of the state assignments completed by Kazan Institute of Biochemistry and Biophysics, FRC Kazan Scientific Center of RAS (Topic 122011800137-0).СПИСОК ЛИТЕРАТУРЫ
- Rosell CM. Trends in science of doughs and bread quality. In: Preedy VR, Watson RR, editors. Flour and breads and their fortification in health and disease prevention. Academic Press; 2019. p. 333–343. https://doi.org/10.1016/B978-0-12-814639-2.00026-5
- Ma D, Wang C, Feng J, Xu B. Wheat grain phenolics: a review on composition, bioactivity, and influencing factors. Journal of the Science of Food and Agriculture. 2021;101(15):6167–6185. https://doi.org/10.1002/jsfa.11428
- Shabunina MV, Andreeva A, Pavlova AS. Use of animal origin protein concentrates in bread baking. Foods and Raw Materials. 2023;11(2):338–346. https://doi.org/10.21603/2308-4057-2023-2-570
- Ciudad-Mulero M, Barros L, Fernandes Â, Ferreira ICFR, Callejo MJ, Matallana-González MC, et al. Potential health claims of durum and bread wheat flours as functional ingredients. Nutrients. 2020;12(2). https://doi.org/10.3390/nu12020504
- Di Cairano M, Tolve R, Cela N, Sportiello L, Scarpa T, Galgano F. Functional cereal-based bakery products, breakfast cereals, and pasta products. In: Punia Bangar S, Kumar Siroha A, editors. Functional cereals and cereal foods. Properties, functionality and applications. Cham: Springer; 2022. pp. 215–249. https://doi.org/10.1007/978-3-031-05611-6_9
- Reynolds A, Mann J, Cummings J, Winter N, Mete E, Te Morenga L. Carbohydrate quality and human health: A series of systematic reviews and meta-analyses. The Lancet. 2019;393(10170):434–445. https://doi.org/10.1016/S0140-6736(18)31809-9
- Tian W, Zheng Y, Wang W, Wang D, Tilley M, Zhang G, et al. A comprehensive review of wheat phytochemicals: From farm to fork and beyond. Comprehensive Reviews in Food Science and Food Safety. 2022;21(3):2274–2308. https://doi.org/10.1111/1541-4337.12960
- Iametti S, Abbasi Parizad PA, Bonomi F, Marengo M. Pigmented grains as a source of bioactives. In: Ferranti P, Berry EM, Anderson JR, editors. Encyclopedia of food security and sustainability. Vol. 1. Elsevier; 2019. pp. 261–270. https://doi.org/10.1016/B978-0-08-100596-5.22385-8
- Mattioli R, Francioso A, Mosca L, Silva P. Anthocyanins: A comprehensive review of their chemical properties and health effects on cardiovascular and neurodegenerative diseases. Molecules. 2020;25(17). https://doi.org/10.3390/molecules25173809
- Francavilla A, Joye IJ. Anthocyanins in whole grain cereals and their potential effect on health. Nutrients. 2020;12(10). https://doi.org/10.3390/nu12102922
- Garg M, Kaur S, Sharma A, Kumari A, Tiwari V, Sharma S, et al. Rising demand for healthy foods-anthocyanin biofortified colored wheat is a new research trend. Frontiers in Nutrition. 2022;9. https://doi.org/10.3389/fnut.2022.878221
- Tian S, Sun Y, Chen Z, Yang Y, Wang Y. Functional properties of polyphenols in grains and effects of physicochemical processing on polyphenols. Journal of Food Quality. 2019;2019. https://doi.org/10.1155/2019/2793973
- Beta T, Li W, Apea-Bah FB. Flour and bread from black, purple, and blue-colored wheats. In: Preedy VR, Watson RR, editors. Flour and breads and their fortification in health and disease prevention. Academic Press; 2019. pp. 75–88. https://doi.org/10.1016/B978-0-12-814639-2.00006-X
- Calderaro A, Barreca D, Bellocco E, Smeriglio A, Trombetta D, Laganà G. Colored phytonutrients: Role and applications in the functional foods of anthocyanins. In: Nabavi SM, Suntar I, Barreca D, Khan H, editors. Phytonutrients in food. From traditional to rational usage. Woodhead Publishing; 2020. pp. 177–195. https://doi.org/10.1016/B978-0-12-815354-3.00011-3
- Gamel TH, Wright AJ, Pickard M, Abdel‐Aal E-SM. Characterization of anthocyanin‐containing purple wheat prototype products as functional foods with potential health benefits. Cereal Chemistry. 2019;97(1):34–38. https://doi.org/10.1002/cche.10190
- Bartl P, Albreht A, Skrt M, Tremlová B, Ošťádalová M, Šmejkal K, et al. Anthocyanins in purple and blue wheat grains and in resulting bread: Quantity, composition, and thermal stability. International Journal of Food Sciences and Nutrition. 2015;66(5):514–519. https://doi.org/10.3109/09637486.2015.1056108
- Eliášová M, Kotíková Z, Lachman J, Orsák M, Martinek P. Influence of baking on anthocyanin content in coloured-grain wheat bread. Plant, Soil and Environment. 2020;66(8):381–386. https://doi.org/10.17221/210/2020-PSE
- Gordeeva E, Shamanin V, Shoeva O, Kukoeva T, Morgounov A, Khlestkina E. The strategy for marker-assisted breeding of anthocyanin-rich spring bread wheat (Triticum aestivum L.) cultivars in Western Siberia. Agronomy. 2020;10(10). https://doi.org/10.3390/agronomy10101603
- Vasilova NZ, Askhadullin DF, Askhadullin DF, Bagavieva EZ, Tazutdinova MR, Khusainova II. Violet-green variety of spring soft wheat Nadira. Legumes and Groat Crops. 2021;40(4):66–75. (In Russ.) https://doi.org/10.24412/2309-348X-2021-4-66-75
- Belyavskaya IG. Improvement of the assortment of diet bakery products. Modern Applications of Bioequivalence and Bioavailability. 2017;2(4). https://doi.org/10.19080/MABB.2017.02.555591
- Khlebova LP, Melnikova YuV, Barysheva NV, Suharkova NV, Vistovskaya VP. The quality and content of anthocyanins in purple- and blue-grained wheat in the south of Western Siberia. IOP Conference Series: Earth and Environmental Science. 2021;723. https://doi.org/10.1088/1755-1315/723/2/022099
- Usenko NI, Khlestkina EК, Asavasanti S, Gordeeva EI, Yudina RS, Otmakhova YuS. Possibilities of enriching food products with anthocyanins by using new forms of cereals. Foods and Raw Materials. 2018;6(1):128–135. https://doi.org/10.21603/2308-4057-2018-1-128-135
- Askhadullin DF, Askhadullin DF, Bagavieva EZ, Vasilova NZ, Kirillova ES, Tazutdinova MR. Patent for breeding achievement No. 11624. Soft spring wheat: NADIRA. 2021. (In Russ.)
- Angelino D, Cossu M, Marti A, Zanoletti M, Chiavaroli L, Brighenti F, et al. Bioaccessibility and bioavailability of phenolic compounds in bread: A review. Food and Function. 2017;8(7):2368–2393. https://doi.org/10.1039/C7FO00574A
- Francavilla A, Joye IJ. Anthocyanin content of crackers and bread made with purple and blue wheat varieties. Molecules. 2022;27(21). https://doi.org/10.3390/molecules27217180
- Abdel-Aal E-SM, Rabalski I. Effect of baking on free and bound phenolic acids in wholegrain bakery products. Journal of Cereal Science. 2013;57(3):312–318. https://doi.org/10.1016/j.jcs.2012.12.001
- Rumyantseva NI, Valieva AI, Akulov AN, Askhadullin DF, Askhadullin DF, Vasilova NZ. Drought and high temperatures effect on yield and grain quality of purple-grain lines of spring soft wheat. Biomics. 2021;13(3):254–273. (In Russ.) https://doi.org/10.31301/2221-6197.bmcs.2021-17
- Martini D, Taddei F, Ciccoritti R, Pasquini M, Nicoletti I, Corradini D, et al. Variation of total antioxidant activity and of phenolic acid, total phenolics and yellow coloured pigments in durum wheat (Triticum turgidum L. var. durum) as a function of genotype, crop year and growing area. Journal of Cereal Science. 2015;65:175–185. https://doi.org/10.1016/j.jcs.2015.06.012
- Laddomada B, Blanco A, Mita G, D’Amico L, Singh RP, Ammar K, et al. Drought and heat stress impacts on phenolic acids accumulation in durum wheat cultivars. Foods. 2021;10(9). https://doi.org/10.3390/foods10092142
- Folin O, Ciocalteu V. On tyrosine and tryptophane determinations in proteins. Journal of Biological Chemistry. 1927;73(2):627–650. https://doi.org/10.1016/S0021-9258(18)84277-6
- Kim K-H, Tsao R, Yang R, Cui SW. Phenolic acid profiles and antioxidant activities of wheat bran extracts and the effect of hydrolysis conditions. Food Chemistry. 2006;95(3):466–473. https://doi.org/10.1016/j.foodchem.2005.01.032
- Beta T, Qiu Y, Liu Q, Borgen A, Apea-Bah FB. Purple wheat (Triticum sp.) seeds: Phenolic composition and antioxidant properties. In: Preedy VR, Watson RR, editors. Nuts and seeds in health and disease prevention. Academic Press; 2020. pp. 103–125. https://doi.org/10.1016/B978-0-12-818553-7.00010-3
- Sadilova E, Stintzing FC, Carle R. Thermal degradation of acylated and nonacylated anthocyanins. Journal of Food Science. 2006;71(8):C504–C512. https://doi.org/10.1111/j.1750-3841.2006.00148.x
- Buanafina MMO, Morris P. The impact of cell wall feruloylation on plant growth, responses to environmental stress, plant pathogens and cell wall degradability. Agronomy. 2022;12(8). https://doi.org/10.3390/agronomy12081847
- Santos NA, Cordeiro AMTM, Damasceno SS, Aguiar RT, Rosenhaim R, Carvalho Filho JR, et al. Commercial antioxidants and thermal stability evaluations. Fuel. 2012;97:638–643. https://doi.org/10.1016/j.fuel.2012.01.074
- Cheng Y, Xu Q, Liu J, Zhao C, Xue F, Zhao Y. Decomposition of five phenolic compounds in high temperature water. Journal of the Brazilian Chemical Society. 2014;25:2102–2107. https://doi.org/10.5935/0103-5053.20140201
- Paznocht L, Kotíková Z, Burešová B, Lachman J, Martinek P. Phenolic acids in kernels of different coloured-grain wheat genotypes. Plant, Soil and Environment. 2020;66(2):57–64. https://doi.org/10.17221/380/2019-PSE
- Shamanin VP, Tekin-Cakmak ZH, Gordeeva EI, Karasu S, Pototskaya I, Chursin AS, et al. Antioxidant capacity and profiles of phenolic acids in various genotypes of purple wheat. Foods. 2022;11(16). https://doi.org/10.3390/foods11162515
- Leváková L, Lacko-Bartošová M. Phenolic acids and antioxidant activity of wheat species: A review. Agriculture (Pol’nohospodárstvo). 2017;63(3):92–101. https://doi.org/10.1515/agri-2017-0009
- Boz H. p -Coumaric acid in cereals: Presence, antioxidant and antimicrobial effects. International Journal of Food Science and Technology. 2015;50(11):2323–2328. https://doi.org/10.1111/ijfs.12898
- Mehaya FM, Mohammad AA. Thermostability of bioactive compounds during roasting process of coffee beans. Heliyon. 2020;6(11). https://doi.org/10.1016/j.heliyon.2020.e05508
- Ma D, Xu B, Feng J, Hu H, Tang J, Yin G, et al. Dynamic metabolomics and transcriptomics analyses for characterization of phenolic compounds and their biosynthetic characteristics in wheat grain. Frontiers in Nutrition. 2022;9. https://doi.org/10.3389/fnut.2022.844337
- Leonard W, Zhang P, Ying D, Adhikari B, Fang Z. Fermentation transforms the phenolic profiles and bioactivities of plant-based foods. Biotechnology Advances. 2021;49. https://doi.org/10.1016/j.biotechadv.2021.107763
