

Аннотация
The present article introduces the problem of determining the general structure of beer as a complex system of related biomolecules. The objective was to establish the correlation of various quantities of organic compounds in beer formulation.The research featured samples of filtered pasteurized beer obtained from a retail chain shop in Moscow (Russia). The experiment relied on standard research methods, including instrumental methods of analysis, e.g., high-performance liquid chromatography (HPLC). The obtained experimental data underwent a statistical analysis using the Statistica software (StatSoft, 2016).
The research established the correlation between the type of grain (barley or wheat malt) and the content of organic compounds, e.g., β-glucan, polyphenols, soluble nitrogen, etc. The research also revealed some patterns in the distribution of proteins, which served as a framework for the system of organic compounds. The distribution of thiol proteins proved to depend on the dissolution degree of the grain and was different in barley light, barley dark, and wheat malt samples. The fraction distribution of β-glucan depended on the color of the malt. In light beer samples, it concentrated in high- and medium-molecular fractions of nitrogenous substances, in dark beer – in low-molecular fractions (≤ 63%). Initial wort density and alcohol content affected the amount of catechins and total polyphenols. Nitrogenous compounds depended on the color, initial extract, and alcohol content.
The nitrogenous structure and other organic compounds of beer proved to depend on protein substances. The research also revealed a number of factors that affected the fraction distribution of biomolecules in different beer sorts.
Ключевые слова
Beer, nitrogenous compounds, polyphenols, β-glucan, fractioning, structureВВЕДЕНИЕ
Alcoholic beverages have a colloidal structure that depends on primary plant raw materials or secondary organic compounds. Secondary organic compounds are a product of the microbial activity. They appear as a result of various biochemical or chemical processes presupposed by the particular production technology. The combination of primary and secondary organic compounds affects the sensory profile of the beverage and, consequently, its demand on the food market.
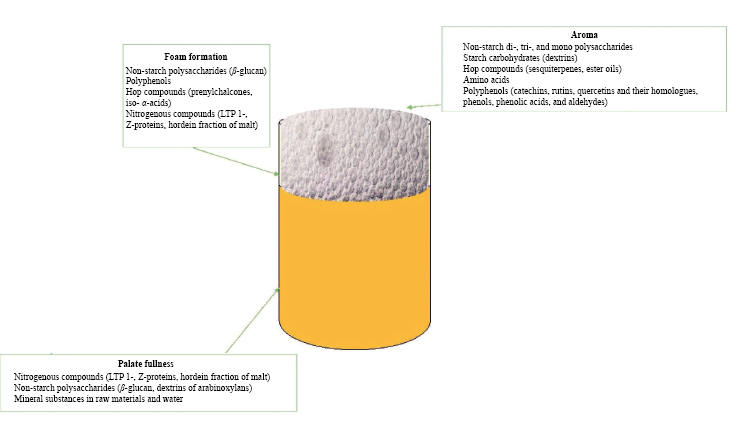
Similarly, beer is an alcoholic drink with a complex colloidal structure formed by organic biomolecules of various molecular weights, which are interconnected by hydrogen, covalent, disulfide, and other bonds [1, 2]. Nitrogenous compounds, phenols, and carbohydrate biomolecules shape both the sensory profile of beer and its stability as a fermented drink (Fig. 1) [2]. However, flavor profile development is a versatile process. It depends both on the primary biomolecules that get hydrolyzed during wort production and on the secondary biomolecules that appear as a result of biomodification in the Krebs cycle during fermentation [3].
Depending on the size and fraction, some organic compounds develop both the sensory profile and consumer characteristics of beer, while others are responsible for haze.
Foam stability and settling time are important consumer characteristics that are associated with the quality of beer [4]. Foam quality depends on protein fractions, bitter hop resins, pentosans, gum substances, and other fractions of plant materials that produce carbon dioxide bubbles on beer surface [5]. Protein biomolecules play the key role in foam development during brewing. Some proteins possess foaming properties, while others are responsible for stabilizing [6]. The composition of beer foam is strongly associated with lipid carrier proteins (LTP1). Their molecular weight is 9.7 kDa, and they include 91 amino acids. Other foam-related proteins are protein Z (40 kDa) and various derivatives of hordein (10–30 kDa) [7].
Beer foam has a complex composition, which consists not only of protein fractions but also of ligand compounds. Ligands are formed by bitter isoforms of α-bitter acids found in hop. The carboxyl group of the asparagine residue in the LTP1 protein molecule is linked by covalent bonds with the hydroxy group of resin, flavonoids, phytosterols, etc. [8]. Foam stability always correlates with the degree of malt dissolution and sometimes with another protein Z fraction [9].
Protein Z is part of the fraction of hordein proteins. Good solubility of malt stimulates the release of this protein into the liquid fraction and causes haze [10, 11]. Similarly, the intensity of haze depends on the content of fractions with a molecular weight of 8–14 kDa in barley malt and < 7 kDa in wheat malt [12].
The last 40 years of beer studies have established a partial similarity in the composition of the protein fractions of the foam and the body of beer. It includes three groups of protein molecules of 40, 10, and 8 kDa (proteins and peptides), which are similar to barley nitrogenous compounds [13].
Non-starch polysaccharides also affect the taste of beer [14]. For instance, maltodextrins and β-glucan can enhance flavor profile. The molecular weight of β-glucan in barley is 150–1937 kDa, in malt – 800–1220 kDa, and in beer – 10–10 000 kDa [15]. The content of β-glucan in the initial barley affects that of malt, and the content of β-glucan in malt affects that in wort. The correlation is different for different types of barley. For instance, the correlation coefficient was 0.9717 for barley malt and 0.9998 for barley wort colloids [15].
Phenolics are other important compounds of beer. Catechins, non-condensed phenolic compounds, and monophenolic acids have a positive effect on the flavor profile of beer, while proanthocyanidins spoil both its taste and stability [16]. In fact, proanthocyanidins possess an extraordinary reactivity and condense into large globules, dragging along proteins and other biomolecules [2].
Thus, the effect of grain organic compounds on the finished product is diverse and quantitatively unclear. For instance, the issue of the interrelation between grain biomolecules and other plant materials still remains understudied in the brewing industry. The research objective was to establish the correlation between the biomolecules of beer plant raw materials to cast light upon the general structure of beer as a colloidal system. The research will make it possible to update the methodology for quality control in the brewing industry.
ОБЪЕКТЫ И МЕТОДЫ ИССЛЕДОВАНИЯ
Beer samples. Samples of filtered pasteurized beer were purchased from a retail network in Moscow and stored in the dark at temperature 15 ± 20°C and air humidity W ≤ 75 ± 2%. The list included light beers (45 samples), dark beers (10 samples), wheat beers (10 samples), and non-alcoholic beers (5 samples), five bottles or cans per each sort.
Fractioning the organic compounds of beer. To preserve the spatial structure of the protein fractions of biomolecules, the protein fractioning was carried out by two methods. High-molecular proteins and related organic compounds were precipitated with a 2% tannin aqueous solution. High-molecular and mediummolecular nitrogenous compounds were precipitated using a 50% sodium molybdate (Na2MoO4) solution in an acid medium. The fractions of nitrogenous compounds, polyphenols, and β-glucans in the filtrate were determined as described below.
An aliquot (62 cm3) of decarbonated beer was taken into two volumetric flasks of 100 cm3. Into the first flask, we added 35 cm3 of distilled water, followed by 2 cm3 of concentrated sulfuric acid, which made it possible to establish the acidic pH of the medium. The solution was stirred, mixed with a 2% tannin aqueous solution, and filtered. Into the other flask, we added 30 cm3 of distilled water, followed by 5 cm3 o f 5 0% Na2MoO4 solution. The mix was brought to the mark with distilled water, followed by another 5 cm3 of concentrated sulfuric acid. The resulting phosphomolybdic acid in the medium made it possible to precipitate protein nitrogen from beer. The initial samples of beer, post-tannin fraction, and post-molybdate fraction were tested for the mass concentrations of soluble nitrogen, nitrogenous compounds with unoxidized disulfide bonds, β-glucan, catechins, and polyphenolic compounds.
The content of organic compounds in the high molecular weight fraction was calculated as the difference between the total amount of a particular compound and its content in the post-tannin extract. The low molecular weight fraction was determined in the postmolybdate filtrate. The average molecular fraction was calculated as the difference between the total amount of the substance and the sum of the high and low molecular weight fractions.
Determining the nitrogenous compounds. The Kjeldahl method for determining total soluble nitrogen was used according to the European Brewery Convention method No. 4.9.3 [17].
Determining the total content of polyphenols. The mass concentration of polyphenols was measured according to the European Brewery Convention method No. 9.9 [18].
Determining the mass concentration of catechins. The content of catechins was determined by highperformance liquid chromatography (HPLC). The procedure involved an Agilent Technologies 1200 device (Agilent, USA) with a diode array detector and a Hypersil 5u C18 250×4.6 mm 5 μm column (Thermo, USA) with a wavelength of 280 nm. According to the procedure, 0.001 cm3 of samples and all standard solutions were injected into a reverse phase column at 30°C. The mobile phase for HPLC was prepared as follows. Solution A included 0.1 mL of phosphoric acid dissolved in 900 cm3 of HPLC water. The volume was brought up to 1000 cm3 with water. The solution was filtered through a 0.45-μm membrane filter and degassed in an ultrasonicator for 3 min. Solution B was acetonitrile. The mobile phase used gradient elution: at 0.01 min – 11% B; 30 min – 25% B; 35–39 min – 100% B; 40–50 min – 11% B. The flow rate of the mobile phase was 1.0 cm3/min, and the injection volume was 0.001 cm3 [19].
Determining the mass concentration of nitrogenous compounds with disulfide groups. The Ellman method detected nitrogenous compounds that contained unoxidized sulfhydryl (thiol) groups [20]. The procedure was based on the reaction of thiol with dithiobisnitrobenzoic acid, which formed a mixed disulfide and 2-nitro-5-thiobenzoic acid. They were quantified by anion absorption at 412 nm in a spectrophotometer. A number of reagents made it possible to determine the concentration of thiol groups. The list included 0.1 and 0.2 M phosphate buffer and Ellman’s reagent that consisted of 37 mg of dithiobisnitrobenzoic acid dissolved in 10 cm3 of 0.1 M phosphorus buffer with pH = 7.0 and 15 mg of NaHCO3. The experiment was prepared as follows. First, 3 cm3 of the protein solution was poured into a test tube, followed by 2 cm3 of a 0.2 M phosphate buffer solution and 5 cm3 of distilled water. The aliquot (3 cm3) was poured into another tube, followed by 0.02 cm3 of Elman’s reagent. After 3 min, the optical density was measured at 412 nm against the control solution. The control solution was prepared similarly, but 0.02 cm3 of distilled water was added to 3 cm3 in another test tube at the last stage.
The mass concentration of thiol-containing nitrogenous compounds (mol/dm3) was calculated by the following formula:
Сs-s = D·P/11,400 (1)
where D is the optical density at 412 nm; Р is the dillution.
Determining the mass concentration of β-glucan. The mass concentration of β-glucan was determined by the enzymatic European Brewery Convention method No. 8.13.1 [21].
Statistical analysis. All experiments were performed in five repetitions. The obtained values were presented as mean ± standard deviation (SD). The Student’s t-test was applied to test the homogeneity of the samples. The multivariate models in the correlationregression analysis were checked using the Fisher test (P ≤ 0.95). The data were processed using Statistica software (StatSoft, Redmond, WA, USA, 2006).
РЕЗУЛЬТАТЫ И ИХ ОБСУЖДЕНИЕ
Relationship between the beer quality and the quantity of organic compounds in grain. The first stage of the research was aimed at finding the quantitative characteristics of the main organic compounds that shape the colloidal structure of beer. The list included nitrogenous compounds, polyphenols, and a non-starch carbohydrate β-glucan. Together with divalent metal ions, hop resins, and melanoidins, these compounds are responsible for both haze and beer quality [22]. The dual behavior of biomolecules can be explained by their grain origin: they originate in malted or unmalted grain and pass into the liquid phase during processing. Table 1 illustrates the quantitative characteristics of the main organic compounds.
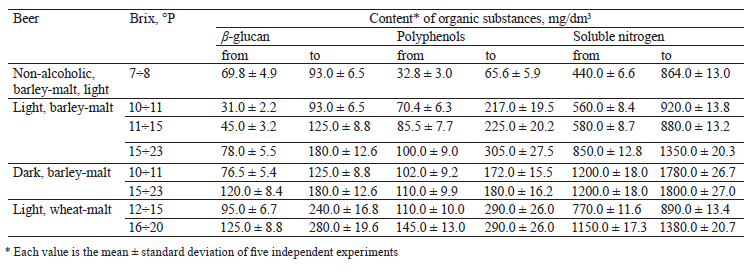
Non-alcoholic and light beer had a similar content of solids in the initial wort (Table 1). As a result, they both were poor in β-glucan, polyphenols, and soluble nitrogen. Apparently, this fact can be explained by the technology of removing alcohol from beer by thermal or membrane methods.
Thermal de-alcoholization processes include vacuum evaporation, vacuum distillation, and centrifugation. They have a negative effect on the sensory profile of beer, which loses in aroma and palate fullness while acquiring new unwanted aromas [23]. Adsorption extraction is another de-alcoholization method. It involves adsorbents, e.g., zeolites. Their surface has charged sites that have an affinity for polar organic substances, which means they can adsorb them. Zeolites often have an affinity for Ca2+ and Mg2+ ions [24]. Molecules of nitrogenous substances, polyphenols, and β-glucan can be connected to other biomolecules via Ca2+ and Mg2+ bridges [25]. Nanofiltration can decrease both the level of alcohol and some polyphenolic compounds [23].
Thus, differences between the de-alcoholization methods can reduce the mass concentration of these compounds. This fact can explain the decrease in the level of non-starch polysaccharides, polyphenols, and soluble nitrogen in non-alcoholic beer, compared to light varieties.
In light beer, β-glucan, polyphenols, and soluble nitrogen are proportional to the increase in the solids of the initial wort (Table 1).
In dark beer, the content of β-glucan was 30%, and the content of soluble nitrogen was two times higher. This effect might have been caused by colored malt, which has higher dissolving properties during germination [26]. Colored malt is also responsible for the lower total amount of polyphenols because they contain lower amounts of such polyphenols as catechin, prodelphinidin B3, procyanidin B3, and ferulic acid [27].
Wheat beer with 12–15% of Brix, °P in the initial malt had twice as much β-glucan as light barley beer. The amount of polyphenols in these samples was higher by 30% and that of soluble nitrogen (lower limit) – by 33% (Table 1). In [28], wheat beer also contained a greater amount of non-starch polysaccharides with a structure-dependent difference and a higher degree of polymerization, compared to light barley beer. Barley malt has a β-glucan polymerization of 38–48, while wheat malt has a polymerization of 38–83 [28]. In wheat beers with 16÷20% solids, the content of nonstarch polysaccharide was 1.5 times higher (upper limit), polyphenols – 1.3–1.6 times higher, protein – by 5.0÷32% higher than in the samples of barley-malt beer, which was probably caused by wheat malt [29].
Distribution of biomolecules of grain raw materials by nitrogenous fractions. The content of soluble nitrogen in beer samples was more significant. Thus, the structure of beer was studied depending on the ratio of different groups of biomolecules with protein substances. The beer samples were tested for nitrogen with thiol groups and catechins. Table 2 shows the averaged data, while Fig. 2 demonstrates the quantitative distribution of biomolecules by fractions of nitrogenous compounds.
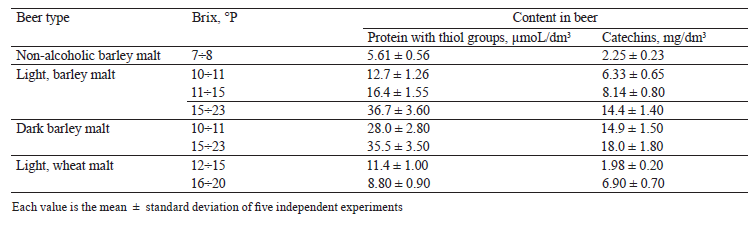
The catechin content confirmed the data obtained by Maia et al. [30]. No correlations between thiol groups were detected. However, dark beer had more catechins because the malt had better dissolution and antioxidant activities. As a result, catechins did not oxidize until the final stage of beer production [30].
Table 2 shows a high level of nitrogen with thiol groups in dark and light barley-malt beers with a lot of initial wort solids. This fact was probably associated with the antioxidant capacity of these samples, which retained thiol groups in unoxidized form.
Light wheat beers contained a relatively low amount of nitrogen with thiol groups (8.80–11.4 μm) compared to barley-malt light beers (12.7–16.4 μm), as confirmed by other studies [31].
The fraction distribution of organic compounds (Fig. 2a–h) depended on the type of beer.
The high-molecular fraction of soluble nitrogen ranged from 7 to 15% of the total amount. Its minimal amount was in dense light barley-malt beers, where the solids content in the initial wort was 15÷23%. The maximal amount was in light barley-malt beer with the solids content of 11÷15%.
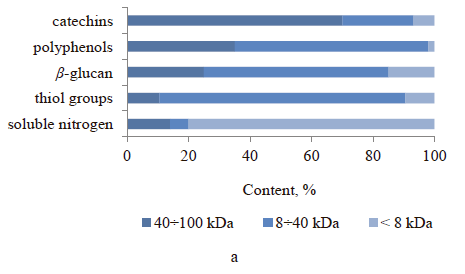
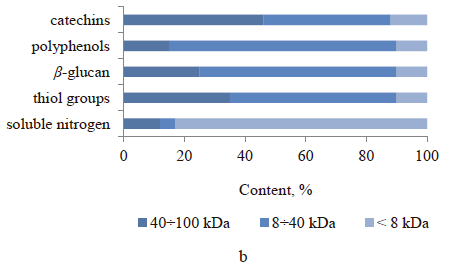
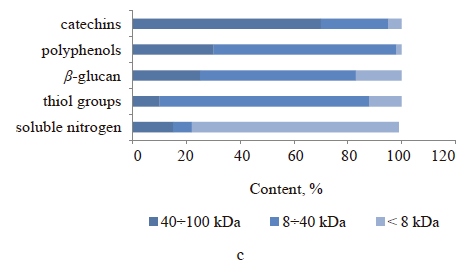
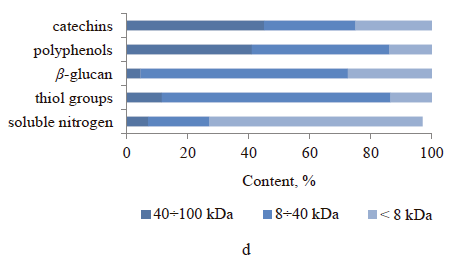
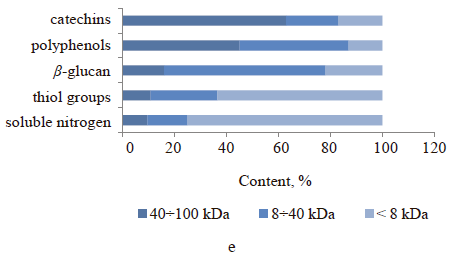
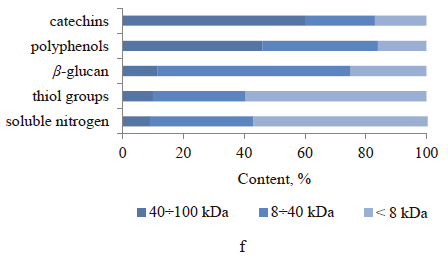
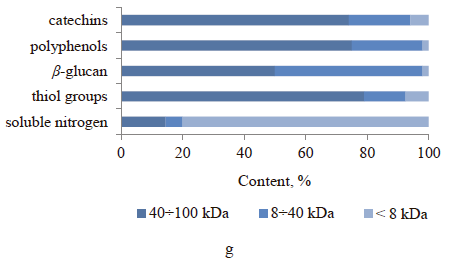
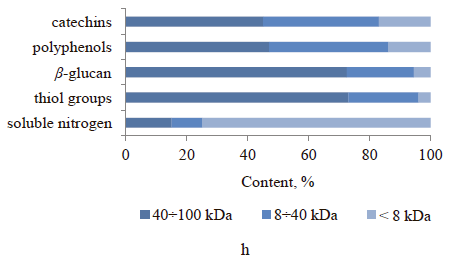
The average molecular fraction correlated with the density. The biggest amount of soluble nitrogen (8÷40 kDa) was registered in the beer samples with initial wort solids content ≥ 23%: it was 20–34% of the total amount of protein compounds. The low molecular fraction of soluble nitrogen was inversely related to the density of beer. For all samples, the higher the content of dry matter in the initial wort, the lower the content of protein compounds with a molecular weight of ≤ 8 kDa.
The distribution of thiol groups of nitrogenous substances was as follows. In light barley-malt beers, the maximal amount was in the medium molecular weight fraction (8÷40 kDa). In dark barley-malt beers, it was in the low molecular weight fraction (≤ 8 kDa). In light wheat-malt beer, it was in the high molecular weight fraction (40÷100 kDa).
The β-glucan dextrins differed in distribution. In light barley-malt beer, 58–68% of the total content of non-starch polysaccharide fractions accounted for the protein fraction with a molecular weight of 8÷40 kDa. In dark barley-malt beer, 59–63% of β-glucan molecules were concentrated in the fraction of nitrogenous substances of ≤ 8 kDa, and 73–79% of its total content was distributed in nitrogenous substances of 40÷100 kDa.
Catechins did not depend on the type and composition of beer: 45–74% of the total content accumulated in the high molecular weight fraction of soluble nitrogen. However, the total content of polyphenols showed strong correlation with the type of beer.
Table 3 shows the correlation between the total polyphenol content and the catechin content.
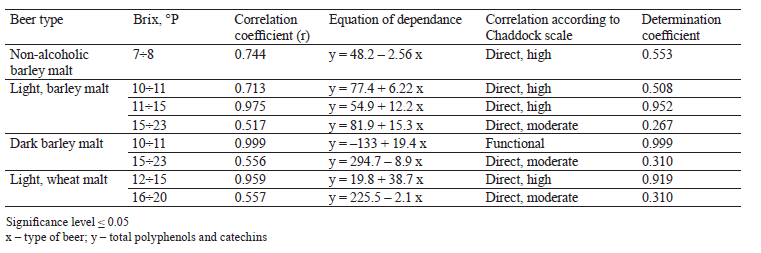
Table 3 revealed a strong correlation between the total polyphenols and catechins and the type of beer. According to the determination coefficient, the total polyphenols depended on the content of catechins when the latter was 50–99%. Therefore, some unknown factors affected the total polyphenols in different beer samples. The lowest determination coefficient was registered in light barley-malt beers 15÷23%, dark beers 15÷23%, and wheat-malt beers 16÷20%. When the solids in the initial wort was high, the composition of polyphenolic compounds experienced a stronger impact from anthocyanogens, phenolic acids, aldehydes, hop resins, and prenylflavanoids. Apparently, strong beer requires a greater proportion of hops, which, like grain, is a source of polyphenolic compounds [32]. On the other hand, the stability of phenolic compounds depends on many factors, e.g., temperature, pH, coactivating substances, polar solvents, etc., which makes the amount of alcohol a more significant factor for strong beer sorts [33].
Table 4 illustrates the dependence of the distribution of thiol groups and catechins.
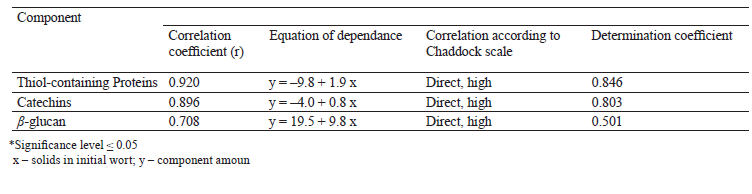
Table 4 shows that the change in β-glucan was 50%, while the content of thiol groups and catechins changed by 80%, which depended on the parameters of the plant material, i.e., barley or wheat malt. On the one hand, this fact can be traced back to grain varieties. On the other hand, non-starch polysaccharides can develop colloidal suspensions and links with other beer compounds, which leads to product losses and affects the content of β-glucan [15, 34].
Figures 3 and 4 illustrate the analysis of correlations and regressions, which registered the presence and degree of the relationship between the content of soluble nitrogen and other parameters. The analysis established a close and logical relationship between the amount of raw materials (solids in the initial wort) and the content of alcohol and polyphenols, which was confirmed by previous studies [32, 33]. Fermentation and the content of polyphenols in the finished product also proved closely interconnected. This fact has been described in different publications [32].
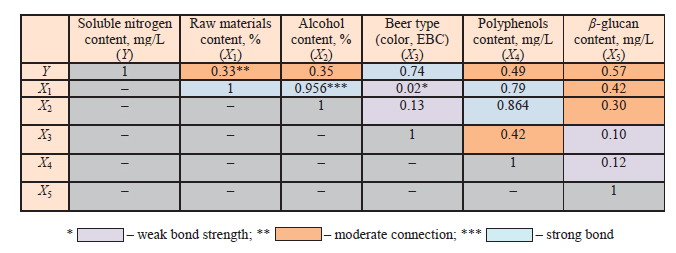
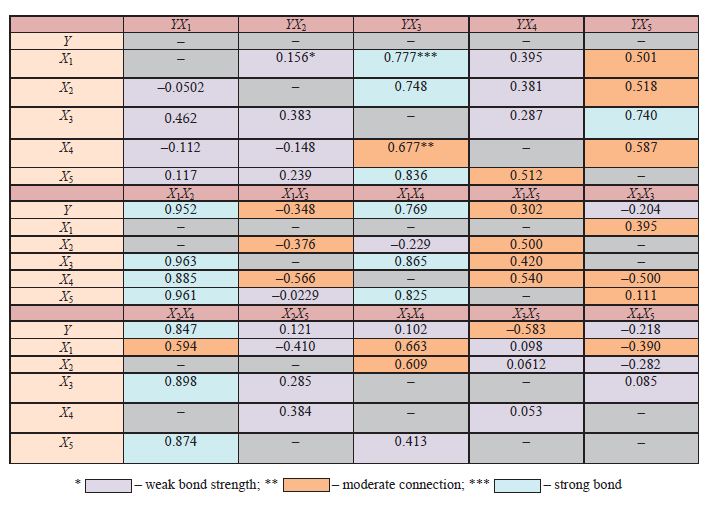
The content of soluble nitrogen proved to depend on the color (type) of beer. This result was quite predictable since a greater degree of dissolution of colored malt means a greater effect of low molecular weight nitrogenous compounds on colored compounds. Similar conclusions were obtained by Castro et al. and Filipowska et al. [26, 35]. Partial correlation coefficients (Fig. 4) were based on the changes in the pair correlation of the corresponding features (Y and Xi), provided they experienced no effect from other factors (Xj). This aspect demonstrated much deeper dependencies of the analyzed indicators. The change in the content of soluble nitrogen was confirmed by the conclusion about the correlation with the color (type) of beer, as well as correlation coefficients YX3, YX5, and X5. The experiment confirmed the hypothesis about the relationship of nitrogenous fractions of nitrogenous substances with polyphenolic and non-starch compounds. X2, X4, and Y also appeared to correlate, which means that polyphenolic compounds affected soluble nitrogen fraction. Polyphenols transformed when the parameters of young beer changed during fermentation while pH became more acidic, oxygen dissolved, carbon dioxide accumulated, etc.
The calculations represented in Figs. 3 and 4 resulted in the following multiple regression equation (2):
Y = 117.2991 – 33.1413 · X1 + 15.1575 · X2 + 34.8177 · X3 + 2.6063 · X4 + 7.7755 · X5 (2)
Color or type of beer (X3) was the most significant parameter in the regression equation. This result confirmed our previous conclusion that the fraction distribution of biomolecules depended on the type of beer (Fig. 2). The overall coefficient of multiple correlation R equaled 0.9073, while the multiple determination coefficient R2 equaled 0.82. The difference indicates that the change in the content of soluble nitrogen depended the abovementioned parameters by 82%.
The study of the protein fractionation could be used to determine the accompanying groups of organic molecules. The acidic extraction regime of biomolecules was quite sparing. Different conditions, e.g., alkaline pH, organic polar solvents, etc., disrupt the equilibrium of nitrogenous substances, polyphenols, and other compounds. As they oxidize, their amount in equilibrium systems cannot be determined [36, 37].
The behavior of organic compounds in the colloidal system of beer revealed a strong correlation between the technological conditions and the low amount of β-glucan, polyphenols, and soluble nitrogen. In particular, thermal or adsorption de-alcoholization had a great impact on the abovementioned substances, which is consistent with data obtained Muller et al. and Yassue-Cordeiro et al. [23, 24].
The distribution of biomolecules by types of beer also revealed an obvious connection between the type of beer and the biochemical composition of the raw materials (barley or wheat malt), production technology, and the amount of mashed grain (Table 1). These results are consistent with other publications [26–30].
The quantitative assessment of organic compounds and their biochemical properties resulted in the hypothesis about the structural character of nitrogenous substances in the colloidal system of beer. This experiment also made it possible to trace the changes in polyphenols, carbohydrates, and other compounds relative to the fraction distribution of nitrogenous compounds [38].
The results of nitrogenous fractionation (Fig. 2) showed its obvious correlation with the beer type. The high molecular weight fraction of soluble nitrogen (40÷100 kDa) varied in the range of 7÷15%, depending on the Brix, °P. The higher was the solids content, the lower was the amount of the high molecular weight fraction of nitrogenous compounds. High-molecular fractions of nitrogenous substances are associated with the palate fullness, which is most typical for light beers with low density [14, 39]. In the samples where the content of extractive substances of the initial wort was 15÷23%, the palate fullness depended not only on the raw materials but also on the secondary products of yeast metabolism, i.e., secondary alcohols, aldehydes, ketones, ethers, and other carbonyl compounds. Our results were quite similar. The medium molecular fraction (8÷40 kDa), which is responsible for foam structure, correlated with the density of beer or the proportion of grain products in it, which is consistent with some previously obtained data [40]. In all samples, the low molecular weight fraction of soluble nitrogen (≤ 8 kDa) developed inversely to the density of beer, which is consistent with other studies on sensory perception of beer body [14, 39]. In other words, the low molecular weight fraction of protein compounds depended on the yeast metabolism, i.e., the enzyme systems of the strain.
Thiol groups of nitrogenous substances are responsible for foam and palate fullness. Their distribution proved to depend on the grain raw material – barley or wheat malt. Thus, light barley-malt beer contained the maximum of thiol groups in the medium molecular weight fraction, dark barley-malt beer – in the low molecular weight fraction, and wheat-malt beer – in the high molecular weight fraction. This finding indicates a great effect of the type of grain on beer quality.
The fraction distribution of non-starch β-glucan depended on the type of malt. In light beers, this non-starch polyaccharide was mostly represented in high- and medium-molecular fractions of nitrogenous substances (Fig. 2). In dark beers, up to 63% of β-glucan molecules concentrated in low molecular weight fractions of nitrogenous compounds, which means they linked to peptides through hydrogen bonds [12]. Probably, this fact can be explained by the competitive distribution of catechins and their bonding with nitrogenous biomolecules in high and medium molecular weight fractions of dark beer (Fig. 2).
The correlation analysis revealed a close and logical relationship between catechins and total polyphenols (Table 3) in different types of beer. The amount of polyphenols depended on the density of the initial wort, as well as on the increase in the alcohol content, which stabilized polyphenolic compounds [33].
The analysis of correlation and regression (Figs. 3 and 4) showed the strong impact of the raw material factor (light, dark barley, and wheat malt) on the content of alcohol and polyphenols. This finding was consistent with the previously obtained research results (Tables 1 and 2) [32, 33].
The statistical analysis revealed a correlation between the color (type) of beer and the amount of nitrogenous compounds in terms of colloidal structure (Fig. 3). This correlation is associated with the technology of coloring malts and the degree of dissolution of malt endosperm during the hydrolysis that occurs during barley germination [33].
Therefore, the experimental part of the research confirmed the hypothesis that fractionation of nitrogenous compounds can be conducted by the method specified in Study Objects and Methods. Fractions of soluble nitrogen and polyphenolic compounds demonstrated a close correlation under various beer production technologies. This relation can be illustrated by a multiple correlation equation (2), in which the color (type) of beer is the most significant parameter.
ВЫВОДЫ
The present research featured the fractionation of organic compounds in various beers. It established the dependences and factors affecting the distribution of nitrogenous compounds in the colloidal system of beer, as well as the relationship between polyphenolic and non-starch biomolecules. The study also revealed the relationship between the fractional composition of beer and such parameters as contents of solids in the initial wort, raw materials, alcohol, color, etc.Вклад авторов
I.N. Gribkova designed the research, collected, analyzed, and interpreted the data. M.N. Eliseev designed the article, developed the concept, and interpreted the data. M.A. Zakharov and V.A. Zakharova collected and analyzed the data. O.A. Kosareva edited and proofread the manuscript.КОНФЛИКТ ИНТЕРЕСОВ
The authors declare that there is no conflict of interests regarding the publication of this article.СПИСОК ЛИТЕРАТУРЫ
- Humia BV, Santos KS, Barbosa AM, Sawata M, Mendonça MC, Padilha FF. Beer molecules and its sensory and biological properties: A review. Molecules. 2019;24(8). https://doi.org/10.3390/molecules24081568
- Wannenmacher J, Gastl M, Becker T. Phenolic substances in beer: Structural diversity, reactive potential and relevance for brewing process and beer quality. Comprehensive Reviews in Food Science and Food Safety. 2018;17(4):953–988. https://doi.org/10.1111/1541-4337.12352
- Pandin C, Darsonval M, Mayeur C, Le Coq D, Aymerich S, Briandet R. Biofilm formation and synthesis of antimicrobial compounds by the biocontrol agent Bacillus velezensis QST713 in an Agaricus bisporus compost micromodel. Applied and Environmental Microbiology. 2019;85(12). https://doi.org/10.1128/AEM.00327-19
- Lukinac J, Mastanjevic K, Mastanjevic K, Nakov G, Jukic M. Computer vision method in beer quality evaluation – a review. Beverages. 2019;5(2). https://doi.org/10.3390/beverages5020038
- Kemp B, Condé B, Jégou S, Howell K, Vasserot Y, Marchal R. Chemical compounds and mechanisms involved in the formation and stabilization of foam in sparkling wines. Critical Reviews in Food Science and Nutrition. 2018;59(13):2072–2094. https://doi.org/10.1080/10408398.2018.1437535
- Gonzalez Viejo C, Fuentes S, Torrico D, Howell K, Dunshea FR. Assessment of beer quality based on foamability and chemical composition using computer vision algorithms, near infrared spectroscopy and machine learning algorithms. Journal of the Science of Food and Agriculture. 2018;98(2):618–627. https://doi.org/10.1002/jsfa.8506
- Nyarko EK, Glavaš H, Habschied K, Mastanjević K. Determination of foam stability in lager beers using digital image analysis of images obtained using RGB and 3D cameras. Fermentation. 2021;7(2). https://doi.org/10.3390/fermentation7020046
- Moraes AH, Asam C, Almeida FCL, Wallner M, Ferreira F, Valente AP. Structural basis for cross-reactivity and conformation fluctuation of the major beech pollen allergen Fag s 1. Scientific Reports. 2018;8(1). https://doi.org/10.1038/s41598-018-28358-1
- Kerr ED, Caboche CH, Schulz BL. Posttranslational modifications drive protein stability to control the dynamic beer brewing proteome. Molecular and Cellular Proteomics. 2019;18(9):1721–1731. https://doi.org/10.1074/mcp.RA119.001526
- Liger-Belair G, Cilindre C. How many CO2 bubbles in a glass of beer. ACS Omega. 2021;6(14):9672–9679. https://doi.org/10.1021/acsomega.1c00256
- Wang Y, Ye L. Haze in beer: Its formation and alleviating strategies, from a protein-polyphenol complex angle. Foods. 2021;10(12). https://doi.org/10.3390/foods10123114
- Zheng Y, Du J, Li M. Haze-active protein and turbidity in commercial barley and wheat beers at different storage temperatures. International Food Research Journal. 2020;27(2):295–307.
- Goldman AR, Beer LA, Tang H-Y, Hembach P, Zayas-Bazan D, Speicher DW. Proteome analysis using gel-LC-MS/MS. Current Protocols in Protein Science. 2019;96(1). https://doi.org/10.1002/cpps.93
- Krebs G, Müller M, Becker T, Gastl M. Characterization of the macromolecular and sensory profile of non-alcoholic beers produced with various methods. Food Research International. 2019;116:508–517. https://doi.org/10.1016/j.foodres.2018.08.067
- Loskutov IG, Polonsky VI. Content of β-glucans in oat grain as a perspective direction of breeding for health products and fodder. Agricultural Biology. 2017;52(4):646–657. (In Russ.). https://doi.org/10.15389/agrobiology.2017.4.646eng
- Habschied K, Lalic A, Horvat D, Mastanjevic K, Lukinac J, Jukic M, et al. β-glucan degradation during malting of different purpose barley varieties. Fermentation. 2020;6(1). https://doi.org/10.3390/fermentation6010021
- Goiris K, Jaskula-Goiris B, Syryn E, Van Opstaele F, De Rouck G, Aerts G, et al. The flavoring potential of hop polyphenols in beer. Journal of the American Society of Brewing Chemists. 2014;72(2):135–142. https://doi.org/10.1094/ASBCJ-2014-0327-01
- Ofoedu CE, Akosim CQ, Iwouno JO, Obi CD, Shorstkii I, Okpala CO. Characteristic changes in malt, wort, and beer produced from different Nigerian rice varieties as influenced by varying malting conditions. PeerJ. 2021;9. https://doi.org/10.7717/peerj.10968
- Dvorakova M, Hulin P, Karabin M, Dostálek P. Determination of polyphenols in beer by an effective method based on solid-phase extraction and high performance liquid chromatography with diode-array detection. Czech Journal of Food Sciences. 2007;25(4):182–188. https://doi.org/10.17221/690-CJFS
- Gottumukkala RVSS, Nadimpalli N, Sukala K, Subbaraju GV. Determination of catechin and epicatechin content in chocolates by high-performance liquid chromatography. International Scholarly Research Notices. 2014;2014. https://doi.org/10.1155/2014/628196
- Wu M, Cao Y, Lei S, Liu Y, Wang J, Hu J, et al. Protein structure and sulfhydryl group changes affected by protein gel properties: process of thermal-induced gel formation of myofibrillar protein. International Journal of Food Properties. 2019;22(1):1834–1847. https://doi.org/10.1080/10942912.2019.1656231
- Huismann M, Gormley F, Dzait D, Speers RA, Maskell DL. Unfilterable beer haze Part I: The investigation of an India pale ale haze. Journal of the American Society of Brewing Chemists. 2021;80(1):17–25. https://doi.org/10.1080/03610470.2021.1937460
- Muller C, Neves LE, Gomez L, Guimaraes M, Ghesti G. Processes for alcohol-free beer production: A review. Food Science and Technology. 2020;40(2):273–281. https://doi.org/10.1590/fst.32318
- Yassue-Cordeiro PH, Zandonai CH, Genesi BP, Lopes PS, Sanchez-Lopez E, Garcia ML, et al. Development of chitosan/silver sulfadiazine/zeolite composite films for wound dressing. Pharmaceutics. 2019;11(10). https://doi.org/10.3390/pharmaceutics11100535
- Zambrzycka-Szelewa E, Nalewajko-Sieliwoniuk E, Zaremba M, Bajguz A, Godlewska-Żyłkiewicz B. The mineral profile of Polish beers by fast sequential multielement HR CS FAAS analysis and its correlation with total phenolic content and antioxidant activity by chemometric methods. Molecules. 2020;25(15). https://doi.org/10.3390/molecules25153402
- Castro LF, Affonso AD, Lehman RM. Impact of specialty malts on wort and beer characteristics. Fermentation. 2021;7(3). https://doi.org/10.3390/fermentation7030137
- Carvalho DO, Curto AF, Guido LF. Determination of phenolic content in different barley varieties and corresponding malts by liquid chromatography-diode array detection-electrospray ionization tandem mass spectrometry. Antioxidants. 2015;4(3):563–576. https://doi.org/10.3390/antiox4030563
- Li M, Du J, Zheng Y. Non-starch polysaccharides in wheat beers and barley malt beers: A comparative study. Foods. 2020;9(2). https://doi.org/10.3390/foods9020131
- Krstanović V, Habschied K, Mastanjević K. Research of malting procedures for winter hard wheat varieties – Part I. Foods. 2021;10(1). https://doi.org/10.3390/foods10010052
- Maia C, Cunha S, Debyser W, Cook D. Impacts of adjunct incorporation on flavor stability metrics at early stages of beer production. Journal of the American Society of Brewing Chemists. 2021. https://doi.org/10.1080/03610470.2021.1993054
- Jastrzębska A, Kowalska S, Szłyk E. Determination of free tryptophan in beer samples by capillary isotachophoretic method. Food Analytical Methods. 2020;13(4):850–862. https://doi.org/10.1007/s12161-020-01699-2
- Boronat А, Soldevila-Domenech N, Rodríguez-Morató J, Martínez-Huélamo M, Lamuela-Raventós RM, de la Torre R. Beer phenolic composition of simple phenols, prenylated flavonoids and alkylresorcinols. Molecules. 2020;25(11). https://doi.org/10.3390/molecules25112582
- Arczewska M, Kamiński DM, Gieroba B, Gagoś M. Acid-base properties of xanthohumol: A computational and experimental investigation. Journal of Natural Products. 2017;80(12):3194–3202. https://doi.org/10.1021/acs.jnatprod.7b00530
- Pater A, Zdaniewicz M, Cioch-Skoneczny M, Duliński R. Different methods of mash pH adjustment and its influence on the quality of wort and brewing process performance. Post Techn Przetw Spoż. 2019;1:47–51.
- Filipowska W, Jaskula-Goiris B, Ditrych M, Bustillo Trueba P, De Rouck G, Aerts G, et al. On the contribution of malt quality and the malting process to the formation of beer staling aldehydes: a review. Journal of the Institute of Brewing. 2021;127(2):107–126. https://doi.org/10.1002/jib.644
- Honda S, Ishida R, Hidaka K, Masuda T. Stability of polyphenols under alkaline conditions and the formation of a xanthine oxidase inhibitor from gallic acid in a solution at pH 7.4. Food Science and Technology Research. 2019;25(1):123–129. https://doi.org/10.3136/fstr.25.123
- Munir S, Javed M, Hu Y, Liu Y, Xiong Sh. The effect of acidic and alkaline pH on the physico-mechanical properties of surimi-based edible films incorporated with green tea extract. Polymers. 2020;12(10):1–15. https://doi.org/10.3390/polym12102281
- Feige MJ, Braakman I, Hendershot LM. Disulfide bonds in protein folding and stability. In: Feige MJ, editor. Oxidative folding of proteins: Basic principles, cellular regulation and engineering. Royal Society of Chemistry; 2018. pp. 1–33. https://doi.org/10.1039/9781788013253-00001
- Gastl M, Kupetz M, Becker T. Determination of cytolytic malt modification – Part II: Impact on wort separation. Journal of the American Society of Brewing Chemists. 2020;79(1):66–74. https://doi.org/10.1080/03610470.2020.1796155
- Krebs G, Gastl M, Becker T. Chemometric modeling of palate fullness in lager beers. Food Chemistry. 2021;342. https://doi.org/10.1016/j.foodchem.2020.128253
