

Аннотация
Jelly is a popular confectionery product but it has a high content of easily digestible sugars, namely 70–85%. Therefore, modern confectioners are trying to develop new formulations of jelly with reduced sweetness and sugar content. One of the ways to achieve that is to use starch syrup instead of white sugar. Another benefit of starch syrup is that it can slow down the drying and staling of jelly.We studied three types of starch syrup (low-conversion, confectionery, high-conversion), glucose-fructose syrup, and sugar-free jelly samples based on them. Jelly based on sugar and confectionery syrup was used as the control sample. The main quality indicators were analyzed against standard values; the sensory parameters were determined by the descriptor-profile analysis; and water activity was measured by using a HygroPalm Rotronic hygrometer. The microbiological safety of the experimental jelly samples was assessed after 12 weeks of their storage in plastic containers.
The sample based on confectionery syrup had the most optimal profile, with moderate sweetness and taste richness, good jelly-like texture, viscoelasticity, plasticity, a color similar to that of the control, and no effect of wetting or stickiness. The samples based on starch syrup had a 1.4–2.4-fold decrease in easily digestible sugars and a 1.9–3.4-fold increase in polysaccharides, compared to the control. During storage, the samples based on high-conversion starch syrup and glucose-fructose syrup were less likely to dry out than the others, with their water activity decreasing to a greater extent. The microbiological analysis after storage showed the absence of pathogenic microorganisms and coliform bacteria in three out of the four jelly samples.
Using various types of starch syrup and glucose-fructose syrup instead of white sugar allows for a greater range of jelly types with different carbohydrate profiles and a longer shelf life.
Ключевые слова
Jelly, starch syrup, carbohydrate composition, water activity, quality indicators, storageВВЕДЕНИЕ
Modern confectioners prioritize new formulations with a reduced sugar content, lower energy value, extended shelf life, and improved quality. The quality of confectionery products is determined by physicochemical and microbiological processes that take place throughout their shelf life. These processes depend on the product’s chemical composition, ingredient ratios, storage conditions, moisture content, pH, water activity, and moisture transfer. The main indicators of jelly quality are moisture content, water activity, and pH. They depend on the formulation, the content and properties of carbohydrate-containing components, as well as storage conditions [1, 2].
Confectionery products vary in moisture that binds nutrients and regulates the product’s texture and structure. Products with high moisture contain larger amounts of free and chemically unbound water that intensifies biological processes and causes damage to products [3]. Free water is responsible for molds, yeasts, and bacteria, as well as toxins. It is involved in chemical and biochemical reactions that can affect the product’s texture, aroma, color, taste, nutritional value, stability, and shelf life [4].
Regulatory requirements for confectionery products include an indicator of water content (W, %). However, this indicator cannot assess how well water is bound to food substances and how this may affect the quality of the product during storage [5].
What is vital for microorganisms is not the absolute content of water in the product but its availability, or water activity (Аw). This indicator is defined asАw = Р/Р0, i.e., the ratio of water vapor pressure over the surface of the product (Р) and vapor pressure over pure water (Р0) [6].
The relative equilibrium moisture is based on the partial pressure of water vapor over the product and depends on the product’s chemical composition, moisture content, storage conditions (temperature and relative air humidity), type of packaging, etc. [7].
The Аw limits for microorganisms in food products are 0.83–0.98 for bacteria, 0.81–0.88 for yeasts, and for 0.70–0.88 molds. However, some types of mold fungi and osmophilic yeasts can grow even at Аw = 0.62. That is why fungi and yeast contents are included in those microbiological indicators that determine the product’s stability during storage. All types of microorganisms are capable of reproduction at Аw > 0.95 and none can reproduce at Аw < 0.6.
The pH and redox potential values have a significant effect on the growth of microorganisms. Products with pH < 3.7 are safe from spoilage, with only lactic acid bacteria and certain yeasts and molds able to develop in them, while products with pH of 5.0 to 7.0 are exposed to risks associated with pathogenic microorganisms [8].
Based on water activity (Аw), products can be divided into high moisture (Аw) ˃ 0.9), intermediate moisture (0.6 ˂ Аw˂ 0.9), and low moisture (Аw ˂ 0.6) products. Low moisture prevents microbiological processes in the product, contributing to a long shelf life. Intermediate moisture creates favorable conditions for predominantly microbiological and enzymatic processes with a growth of yeasts, molds, and some types of bacteria, thus causing the products to dry out and become stale during storage. High moisture products are vulnerable to all types of microorganisms and therefore have a short shelf life [9].
Reducing the water activity index can effectively prevent microbiological spoilage and some chemical reactions in food products that reduce their quality during storage. For this, a number of methods are applied including concentration, dehydration, drying, freezing, increasing osmotic pressure over the product, and using microorganism growth inhibitors. There are also active ingredients that bind water and thereby prevent or significantly slow down its evaporation. These are specific enzymes, emulsifiers, carbohydratecontaining hygroscopic substances, salts, and waterretaining agents. The strength of water binding depends on the origin and chemical composition of the ingredients used, as well as pH and temperature of the medium [10, 11].
The carbohydrate composition of fruit jelly has a significant impact on its consumer properties during storage. Jelly is a sugary confectionery product. Despite its popularity, it has a number of disadvantages: high sugar content (70–85% of easily digestible sugars), high energy value (300–360 kcal/100 g), sweetness, high glycemic index, and an unbalanced composition. According to its chemical composition and structure, jelly belongs to complex colloidal systems. Its osmotically retained moisture has a limited energy of binding with the product’s components. Jelly is an intermediate moisture (15–30%) product [12, 13].
During storage, even with all requirements met, jelly gradually becomes exposed to moisture exchange (shrinkage) and sucrose crystallization, with its appearance and structure deteriorating as well [13]. However, when stored at elevated temperatures and relative humidity over 70%, jelly is vulnerable to mold due to the sorption of moisture on its surface. This results in its wetting, with an increase in the Аw) index to 0.9 and a growth in Aspergillus and Penicillium fungi, yeast, and, to a lesser extent, bacteria [15]. The lower limit of jelly moisture for mold fungi is 15%, but under improper storage conditions, spoilage can occur even with a higher dry matter content. With a sugar concentration up to 60–65% and increased moisture, some races of yeast can cause fermentation, especially alcoholic, which gives the product an unpleasant pungent odor [16].
Jelly drying can be prevented and water activity reduced by introducing sugar-containing substances with a high content of reducing agents and waterretaining components (polysaccharides, glycerol, polyhydric alcohols, some sweeteners, starch, proteins, amino acids, lactic acid, etc.) [17].
Fruit jelly is made with natural gel-forming agents such as agar-agar, pectin, gelatin, carrageenans, gum arabic, xanthan gums, etc. These are hydrocolloidal polysaccharides that bind water in jelly, like sugar, making it less available for microorganisms to develop [18–20].
Pectin is the best water-retaining gelling component for jelly. It is a natural polysaccharide with water-soluble fiber properties. Pectin is widely used in therapeutic and preventative nutrition due to its normalizing effect on many vital processes without disturbing the bacteriological balance of the body. In particular, it improves digestion, lowers blood cholesterol, normalizes blood sugar, and removes ions of toxic metals, pesticides, radionuclides, xenobiotics, anabolics, metabolic products, and excess urea from the body. It is recommended to people with disturbed carbohydrate and lipid metabolism, immune and bacterial diseases, obesity, and atherosclerosis [21].
Carbohydrates not only determine sensory, functional, and technological properties of a product, but they also regulate its acidity and have a preservative antimicrobial effect. Adding sugars increases the binding energy of water in the material and decreases the rate of chemical reactions, reducing water activity and microbial growth [22]. However, not only the quantity of sugars is important but also their qualitative composition. For example, apple jam with 32.6% moisture has a lower Аw index (0.825) than butter cream with 15.2% moisture (0.851) due to a significant content of sugar and reducing sugars [23].
Monosaccharides have the greatest ability to bind water and reduce water activity, followed by disaccharides and polysaccharides. Sugar-containing substances can be arranged in the following order based on their ability to reduce the Аw index in products [24]:
Amylopectin -----> Maltohexaose -----> Maltotriose -----> Sucrose -----> Maltose -----> Lactulose -----> Glucose ----> -----> Fructose -----> Xylose -----> Glycerin
Replacing white sugar with alternative starch products is one of the ways to reduce sweetness and easily digestible sugars, slow down drying and staling, and keep jelly fresh during storage. These alternative materials, e.g., starch syrup and glucosefructose syrup, vary in carbohydrate composition and are technologically advantageous, inexpensive, and domestically produced in large quantities.
We aimed to study the quality of starch syrup (low-conversion, confectionery, and high-conversion) and glucose-fructose syrup, as well as their effect on the sensory, physicochemical, and microbiological parameters of jelly with different carbohydrate profiles after manufacture and during storage.
ОБЪЕКТЫ И МЕТОДЫ ИССЛЕДОВАНИЯ
Samples of starch syrup and glucose-fructose syrup
(Kargill Company, Russia) were analyzed according to
State Standard 33917-2016 and Specifications 10.62.13-
001-00343579-2016 for the following parameters by
using the following methods:
– the dry matter content: by the refractometric method;
– the content of reducing substances: by the Lane-Eynon
method;
– the content of carbohydrates: by high performance
liquid chromatography on a Shimadzu LC-2010
chromatograph with a RID-10A refractometric detector;
– pH value: by measuring the activity of hydrogen ions
on a Testo 206 pH meter;
– acidity: by titration; and
– nutritional value: by calculation.
The jelly samples were based on apple pectin. The control sample was based on sugar and confectionery syrup in a ratio of 1:0.5. The experimental samples were free of white sugar and based on starch syrup (lowconversion, confectionery, and high-conversion) and glucose-fructose syrup.
The sensory quality of the jelly samples was
evaluated on a 5-point scale by the descriptor-profile
analysis according to State Standard ISO 13299-
2015 [25]. It involved the following parameters and
methods of their determination:
– the water content: by the refractometric method (State
Standard 5900);
– the content of reducing substances: by the ferricyanide
method (State Standard 5903);
– titratable acidity: by titration; and
– active acidity (pH): by the potentiometric method
(State Standard 5898).
Water activity was measured by using a HygroPalm hygrometer (Rotronic, Switzerland) on a scale from 0 to 1, with an absolute error of ± 0.008 (± 0.1°C for temperature). The microbiological indicators were evaluated against State Standard 6442-2014 and Technical Regulations of the Customs Union 021/2011. In particular, we applied microbiological research methods to determine the total aerobic mesophilic count (State Standard 10444.15-94), coliform bacteria (State Standard 50474-93), and spoilage microorganisms (State Standard 10444.12- 88).
The jelly samples were stored in food-grade polyethylene terephthalate containers for 12 weeks at 21.0 ± 1.5°C and relative humidity of 82 ± 2%.
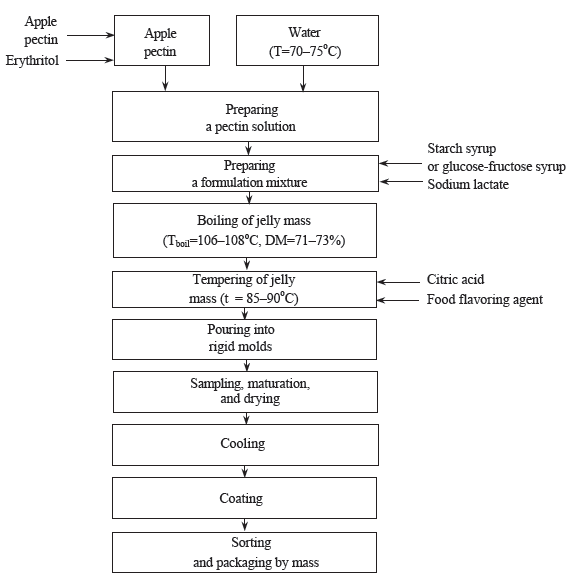
To prepare the control sample, apple pectin was mixed with white sugar in a ratio of 1:3. The resulting dry mixture was gradually added to hot water (70–75°С) and vigorously stirred until a homogeneous water-pectin mixture was obtained with a dry matter content of 25 ± 1%. Then, we added the remaining amount of white sugar, starch syrup heated to 50–55°C, and buffer salt (sodium lactate), stirred the mixture, and boiled it to obtain a jelly mass with a 27–29% water content. The mass was then cooled to 85–90°C, with citric acid and а food flavoring agent introduced into it. The jelly mass was poured into rigid molds to mature, dry, and cool.
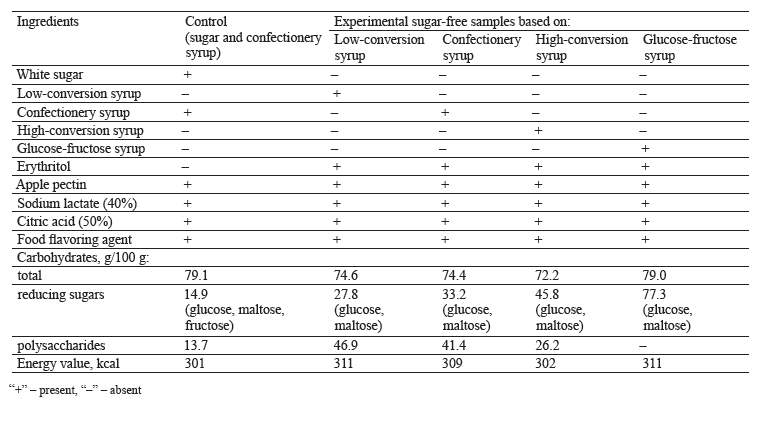
The experimental samples were prepared according to the same method as the control, with erythritol used instead of white sugar (Fig. 1). Their ingredients, carbohydrate composition, and energy value are presented in Table 1.
РЕЗУЛЬТАТЫ И ИХ ОБСУЖДЕНИЕ
First, we studied the quality indicators of three types of starch syrup (low-conversion, confectionery, and high-conversion) and glucose-fructose syrup in comparison with those of sugar syrup used to prepare the control sample. The starch syrups differed significantly in their carbohydrate composition. They contained easily digestible reducing sugars (glucose and maltose) and polysaccharides (dextries and trisaccharides), with the latter responsible for dietetic properties (Table 2). In addition, the syrups contained minerals (0.10–0.37%) such as potassium, phosphorus, sodium, calcium, magnesium, and iron [26]. Unlike sugar syrup, starch syrup is free of sucrose and fructose, a highly hygroscopic reducing carbohydrate that significantly increases jelly’s wettability during storage.
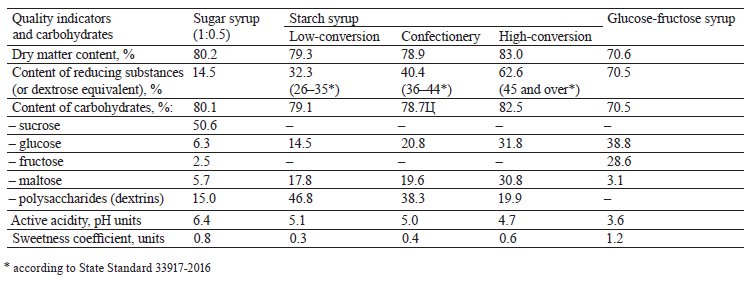
All the types of starch syrup had a lower sweetness coefficient (by 0.2–0.5 units), lower values of active acidity (by 1.3–1.7 pH units), and a higher ash content (2.0–7.4 times) than the sugar syrup. The highconversion syrup contained the largest amount of reducing sugars (62.6%, including 31.8% glucose and 30.8% maltose) and the smallest amount of polysaccharides (19.9%). The low-conversion syrup, on the contrary, had the highest content of polysaccharides (46.8%) and the lowest content of reducing sugars (32.3%, including 14.5% glucose and 17.8% maltose). The confectionery syrup contained 40.4% of reducing sugars (20.8% glucose, 19.6% maltose) and 38.3% of polysaccharides. The glucose-fructose syrup had a lower value of active acidity (by 3.6 pH units) and a higher sweetness coefficient (by 1.2) than the sugar syrup. This was due to its significant content of easily digestible reducing sugars (70.5%, including 28.6% fructose, 38.8% glucose, and 3.1% maltose) and the absence of sucrose and polysaccharides.
Replacing sugar with starch syrup or glucosefructose syrup significantly changed the carbohydrate composition of the jelly samples (Table 1). This not only depended on the chemical composition of the raw materials but also the chemical processes in the jelly mass during boiling. Unlike the control, the experimental samples contained no sucrose.
The control sample had 65.4% of easily digestible carbohydrates, including 50.5% of sucrose and 14.9% of reducing sugars (fructose, glucose, and maltose), as well as 13.7% of polysaccharides. The samples based on lowconversion syrup had a lower content of reducing sugars (glucose and maltose) and more polysaccharides (27.8 and 46.9%, respectively) than the other experimental samples. The samples based on confectionery syrup contained 33.2% of reducing sugars and 41.4% of polysaccharides. The samples based on high-conversio syrup contained more reducing sugars and fewer polysaccharides (45.8 and 26.2%, respectively) than the other experimental samples. The glucose-fructose syrup sample contained more reducing sugars (77.3%) than the other samples but no sucrose or polysaccharides.
Thus, all the samples based on starch syrup contained 1.9–3.4 times more polysaccharides and 1.4–2.4 times fewer reducing sugars than the control. However, the sample based on glucose-fructose syrup had a 1.2 times higher content of reducing sugars.
The sensory evaluation of the jelly samples was based on the quantitative descriptor-profile analysis. In this analysis, each of the main sensory indicators (taste, color, smell, texture) is presented as a set of components (or descriptors) that are scored by the panelists according to their presence and intensity. The results are graphically depicted in the form of a profile diagram.
In our study, 20 panelists aged 19–23 evaluated the following sensory indicators of the jelly samples (descriptors listed in brackets): taste (sweetness, richness, cooling effect); color (yellow tint, saturation, transparency); smell (material-specific smell, intensity, off-odor); and texture (jelly-like, viscoelasticity and plasticity, stickiness).
Figure 2 shows the profile diagram of the jelly quality evaluated on a 5-point scale of intensity with weight coefficients representing the significance of each indicator.
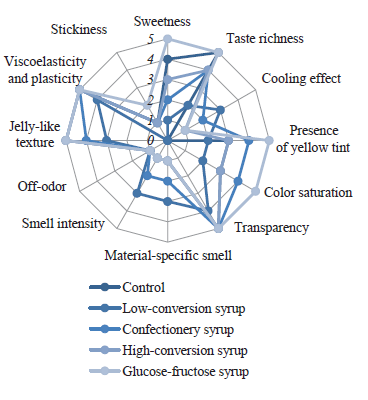
The descriptor-profile analysis showed that the samples based on high-conversion syrup and glucosefructose syrup had the greatest sweetness, taste richness, color saturation, and transparency. Also, the sample with glucose-fructose syrup had a slight effect of stickiness on its surface. This was because it had the highest content of reducing sugars (mostly fructose) which turn into coloring, humic substances and aldehydes during boiling and intensify the product’s color, aroma, and hygroscopicity.
The jelly based on low-conversion syrup had the lowest sweetness, taste richness, and color brightness, as well as low texture density and elasticity. These values can be explained by its highest content of polysaccharides which bind less water and therefore make the product less viscous and strong. The sample based on confectionery syrup had the most optimal profile, with moderate sweetness and taste richness, good jelly-like texture, viscoelasticity, and plasticity, no effect of wetting or stickiness, and a color similar to that of the control.
The jelly samples with various carbohydrate compositions were packed in plastic containers and stored for 12 weeks to study changes in their water content (W), water activity (Аw), and pH (Table 3). The initial (after preparation) water contents in the control sample, the starch syrupbased samples, and the jelly based on glucosefructose syrup were 20.8 ± 0.2, 19.1 ± 0.2–20.0 ± 0.1, and 20.6 ± 0.1, respectively. Тheir pH values were 3.4, 3.0–3.3, and 2.8, respectively.
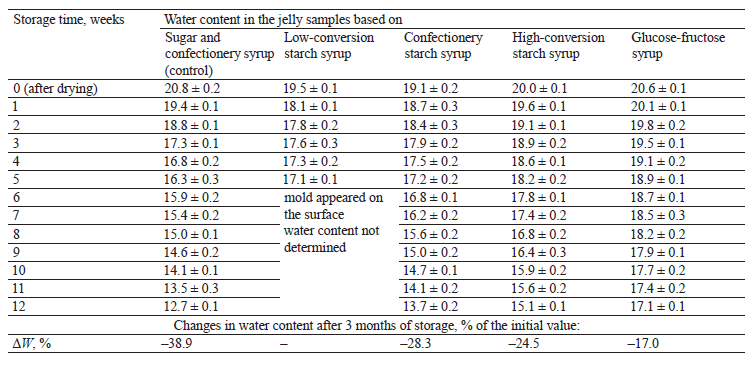
All the jelly samples showed a gradual decrease in the water content and changes in water activity during storage. After 12 weeks of storage, the control sample had the highest loss of water (38.9%), compared to the experimental samples (17.0–28.3%). This was because it contained a significant amount of sucrose (50.6%) and a small amount of reducing substances (14.9%). In the process of moisture transfer during storage, sucrose crystallization centers gradually began to develop on the sample’s surface. They subsequently grew in size forming a thin crystalline sugar crust and gradually sugaring the whole product. During this process, free moisture quickly left the intercrystalline space, causing the product to dry out and stale.
The jelly based on low-conversion syrup was losing water more slowly than the control but faster than the other experimental samples at the beginning of storage. This was due to its significant content of polysaccharides (46.9%), which bind and retain water to a lesser extent than reducing substances. Since mold appeared on its surface after 5 weeks of storage, the studied parameters were no longer determined. The jellies based on confectionery syrup and high-conversion syrup had lower water losses (28.3 and 24.5%, respectively), compared to the control. The lowest water loss (17.0%) was registered in the sample based on glucose-fructose syrup. It contained the largest amount of reducing substances (fructose and glucose), which contributed to slower drying and greater freshness preservation.
Thus, the jelly’s carbohydrate composition (the ratio of mono-, di-, and polysaccharides) significantly affected the process of moisture exchange during storage and therefore the product’s drying and staling. Using various types of starch syrup and glucose-fructose syrup with a high content of reducing sugars (especially glucose and fructose with higher solubility than maltose or dextrins) significantly slowed down the drying of jelly and increased its shelf life.
Figure 3 shows the changes in water activity in the packaged jelly samples during 12 weeks of storage. As we can see, the longer was the storage time, the lower was water activity in all the samples. We also found that the lower was the water loss, the more changes in water activity it caused (Fig. 4).
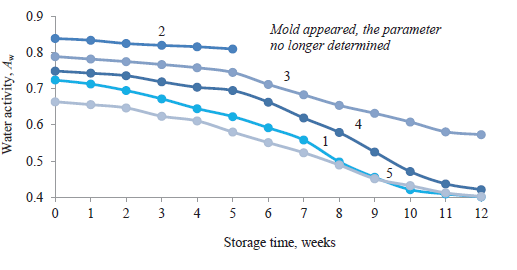
The decrease in water activity was associated with two processes – water loss during storage and the use of starch products with a different ratio of mono-, di-, and polysaccharides. Monosaccharides reduce water activity to a greater extent than disaccharides due to their solubility and hygroscopicity. The solubility of mono- and disaccharides varies greatly, amounting (at 100 °C) to 98.4, 87.7, 86.1, and 82.9% for fructose, glucose, maltose, and sucrose, respectively [27, 28]. Fructose contributes to the greatest decrease in water activity, followed by glucose, maltose, and sucrose. The tendency of sugar molecules to hydration is associated with the presence of hydroxyl and aldehyde groups capable of forming hydrogen bonds with water molecules. The more reducing sugars the product contains, the more they bind water molecules and slow down its staling [29].
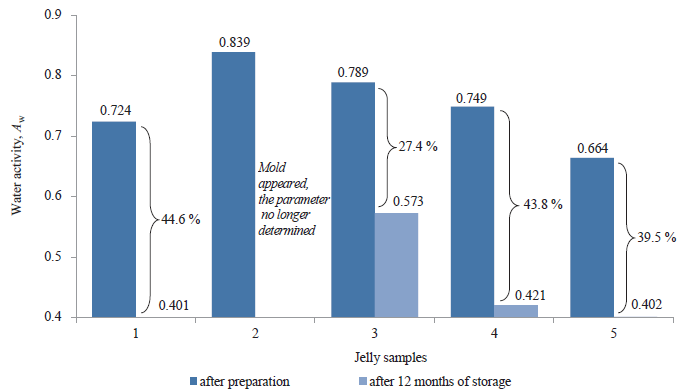
According to the sorption isotherm (Fig. 5), the initial water activity values in all the jelly samples ranged from 0.664 ± 0.012 to 0.839 ± 0.011. Therefore, we can classify them as intermediate moisture products.
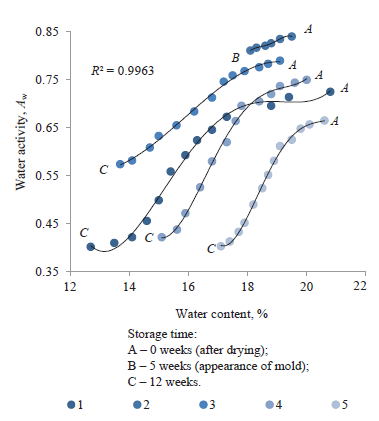
Figure 5 shows a certain correlation between the water content and the water activity index that is determined by both the content of carbohydrates and their ratio in the sample. The control sample had the greatest decrease in water activity, namely 44.6% (Fig. 4). The sample based on low-conversion syrup had the highest initial value of water activity (0.839). This was due to its low content of reducing sugars with a preservative effect and high water-binding capacity, which led to gradual molding after 5 weeks of storage. The water activity values of the samples based on highconversion syrup and glucose-fructose syrup were initially lower than in the other samples (0.749 and 0.664, respectively). After 12 weeks of storage, they decreased more than in the other samples (by 43.8 and 39.5%, respectively) due to significant amounts of reducing sugars in their composition (45.8 and 77.3%, respectively). The sample based on confectionery syrup had the lowest decrease in water activity, namely 27.4% (Fig. 4). During storage, this sample dried more slowly than the control. It did not get wet and retained its viscoelasticity and plasticity, with no crystalline crust forming on its surface.
The sensory indicators of the jelly samples after 12 weeks of storage are presented in Table 4.
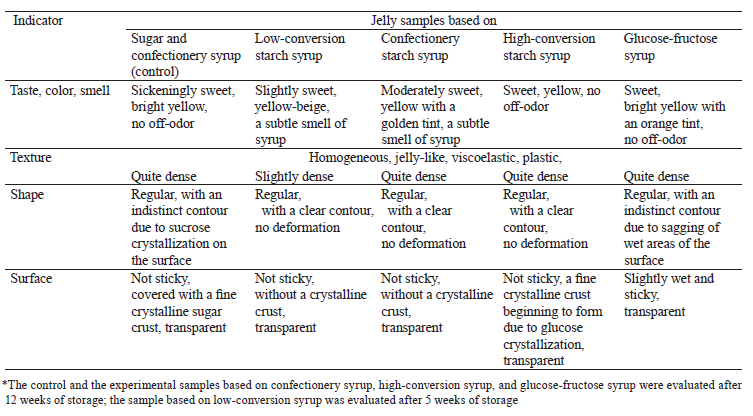
The antimicrobial effect of carbohydrates is primarily based on decreasing water activity, which slows down most chemical reactions responsible for the product’s deterioration, increases the binding energy of water, and reduces the ability of microorganisms to use it for metabolism. High water content (21–15%) and water activity (0.6–0.8) in jelly are among the causes of its microbiological spoilage, leading to the development of molds and yeasts [30, 31].
In our samples, the water content was 19.1–20.8% and water activity varied from 0.664 ± 0.012 to 0.839 ± 0.011, which might indicate possible development of microorganisms and mold. Therefore, we decided to study changes in the microbiological indicators throughout the entire shelf life of the jelly samples.
Based on the Technical Regulations of the Customs Union 021/2011, we determined the total number of pathogenic microorganisms, aerobic mesophilic bacteria, molds and yeasts, spore-forming bacteria, and coliform bacteria in the jelly samples. We analyzed their microbiological stability after storage and found that the indicators under study did not exceed the tolerance levels in the control and the experimental samples based on confectionery syrup, high-conversion syrup, and glucose-fructose syrup. Also, we detected no pathogenic microorganisms or coliform bacteria in the samples (Table 5).
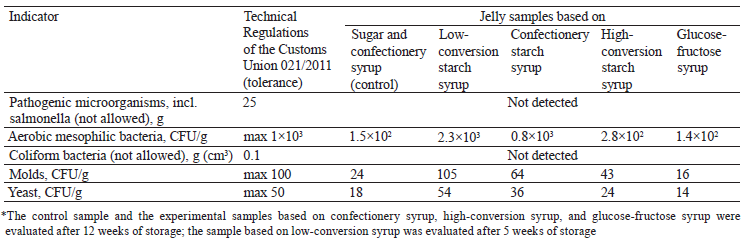
The jelly based on low-conversion syrup had its counts of aerobic mesophilic bacteria, molds, and yeasts exceeding the tolerance levels 2.3, 1.9, and 1.8 times, respectively. This can be explained by a low content of reducing sugars with a preservative effect and a high water activity index in this sample. To improve its microbiological indicators and reduce water activity, a larger amount of a preservative agent should be added to its formulation. For example, it could be a sweetener with low sugar and calorie contents and a high waterbinding capacity (erythritol, sorbitol, xylitol, etc.). Alternatively, some food acid or concentrated juice with high acidity could be used to increase the carbohydrate content and acidity in the product.
Thus, changing the concentration of carbohydrates with different water-retaining properties can have an additional preservative effect on jelly in combination with other technological factors. The risk of microbiological spoilage can be reduced not only by adjusting the formulation (lowering water activity and pH), but also by ensuring low levels of initial microbiological contamination of the product.
ВЫВОДЫ
Our study showed that jelly can be produced with various types of starch syrup (low-conversion, confectionery, and high-conversion) or glucose-fructose syrup used instead of white sugar. This can expand the range of jellies with different carbohydrate profiles and prolong their shelf life.
We found that using starch or glucose-fructose syrups significantly changed the carbohydrate composition of the jelly. Unlike the control, the experimental samples did not contain any sucrose. The starch syrup-based samples had more polysaccharides (1.9–3.4 times) and fewer easily digestible reducing sugars (1.4–2.4 times), while the sample with glucosefructose syrup had a higher content of reducing sugars (1.2 times) than the control. The sample based on confectionery syrup had the most optimal profile, with moderate sweetness and taste richness, good jellylike texture, viscoelasticity and plasticity, no effect of wetting or stickiness, and the color similar to that of the control sample.
Different amounts and ratios of mono-, di-, and polysaccharides significantly affected the moisture transfer and the preservation of jelly freshness after 12 weeks of storage. The control sample had the greatest water loss (38.9 %), compared to the experimental samples. The samples based on high-conversion syrup and glucose-fructose syrup were least subjected to drying due to high contents of reducing sugars, especially fructose and glucose, highly hygroscopic sugars that can bind water and slow down the process of staling. The water activity index of the jelly samples after preparation ranged from 0.664 ± 0.012 to 0.839 ± ± 0.011, so they were classified as intermediate moisture products. After storage, this index decreased most in the samples based on high-conversion and glucose-fructose syrups and least in the sample based on confectionery syrup.
The microbiological indicators of all the samples, except for the jelly based on low-conversion syrup, did not exceed the standard tolerance levels. Neither did we detect any pathogenic microorganisms or coliform bacteria in them. The jelly based on lowconversion syrup had its counts of aerobic mesophilic bacteria, molds, and yeasts exceeding the tolerance levels 2.3, 1.9, and 1.8 times, respectively. To improve its microbiological indicators and reduce water activity, a larger amount of a preservative should be added to its formulation, such as a sweetener (erythritol, sorbitol, xylitol, etc.), a food acid, or a concentrated juice with high acidity that can increase the carbohydrate content and acidity in the product.
Вклад авторов
I.V. Plotnikova reviewed the literature on the study problem, proposed a methodology for the experiment, conducted the experiment, processed experimental data, performed calculations, and edited the manuscript. G.O. Magomedov developed the study concept and supervised the experiment. I.M. Zharkova reviewed the literature on the study problem and edited the manuscript. E.N. Miroshnichenko edited the manuscript for submission. V.E. Plotnikov conducted the experiment, processed experimental data, and performed calculations.КОНФЛИКТ ИНТЕРЕСОВ
All the authors were equally involved in writing the manuscript and are responsible for plagiarism.БЛАГОДАРНОСТИ
We thank Raisa I. Ivanova, General Director of the Confectionery Factory (Vologda), for providing raw materials and an opportunity to test the samples in industrial conditions.ФИНАНСИРОВАНИЕ
The study was conducted at Voronezh State University of Engineering Technologies (VSUET).СПИСОК ЛИТЕРАТУРЫ
- Kondratev NB, Osipov MV, Rudenko OS, Kazantsev EV, Kalinkina ES. The main factors of marmalade molecular structure formation. Food Systems. 2021;4(3):172–179. (In Russ.). https://doi.org/10.21323/2618-9771-2021-4-3-172-179
- Pesterev MA, Rudenko OS, Kondrat’ev NB, Bazhenova AE, Usachev IS. Effect of biodegradable and polypropylene film packaging on the safety profile of jelly marmalade. Food Processing: Techniques and Technology. 2020;50(3):536–548. (In Russ.). https://doi.org/10.21603/2074-9414-2020-3-536-548
- Arslaner A, Salik A, Bakirci I. The effects of adding Hibiscus sabdariffa L. flowers marmalade on some quality properties, mineral content and antioxidant activities of yogurt. Journal of Food Science and Technology. 2021;58(1):223–233. https://doi.org/10.1007/s13197-020-04533-z
- Afi L, Roufegarinejad L, Mitra S. Investigating the effect of sugar replacement with sorbitol as low-caloric sweetener on the physicochemical and sensory characteristics of strawberry marmalade. Food Science and Technology. 2019;16(88):161–172.
- Kazantsev EV, Kondratyev NB, Osipov MV, Rudenko OS, Linovskaya NV. Management of moisture transfer processes during the storage of confectionery with a jelly-like consistency. Proceedings of the Voronezh State University of Engineering Technologies. 2020;82(4):47–53. (In Russ.). https://doi.org/10.20914/2310-1202-2020-4-47-53
- Figueroa LE, Genovese DB. Fruit jellies enriched with dietary fibre: Development and characterization of a novel functional food product. LWT. 2019;111:423–428. https://doi.org/10.1016/j.lwt.2019.05.031
- Gribova NA, Eliseevа LG. Study of structure-forming agents and development of jelly marmalade based on a spent osmotic agent. Proceedings of the Voronezh State University of Engineering Technologies. 2021;83(3):98–105. (In Russ.).
- Kodatsky YuA, Klyukina ON, Nepovinnykh NV, Ptichkina NM, Shmakov SL, Eganekhzad S, et al. Study of the viscoelastic properties and water activity in the marshmallow, based on polysaccharides of plant and microbial origin. Food Industry. 2016;(4):30–33. (In Russ.).
- Soldatova EA, Misteneva SYu, Savenkova TV. Conditions and criteria for ensuring the storage ability of confectionery. Food Industry. 2019;(5):82–85. (In Russ.). https://doi.org/10.24411/0235-2486-2019-10078
- Nistor O-V, Bolea CA, Andronoiu D-G, Cotârlet M, Stanciuc N. Attempts for developing novel sugar-based and sugar-free sea buckthorn marmalades. Molecules. 2021;26(11). https://doi.org/10.3390/molecules26113073
- Belokurova ES, Pankina IA, Sevastianova AD, Asfondiarova IV, Katkova NM. The effect of functional additives on the indicator “water activity” of biscuit semi-finished products. IOP Conference Series: Earth and Environmental Science. 2021;640(2). https://doi.org/10.1088/1755-1315/640/2/022022
- Iorgachova KG, Avetisian KV. Quality adjustment for jelly marmalade of a modified carbohydrate structure. Eastern-European Journal of Enterprise Technologies. 2016;2(11):48–56. (In Russ.). https://doi.org/10.15587/1729-4061.2016.65768
- Tabatorovich AN, Reznichenko IYu. Formulation and quality assessment of diabetic jelly marmalade “Karkade” fortified with succinic acid. Food Processing: Techniques and Technology. 2019;49(2):320–329. (In Russ.). https://doi.org/10.21603/2074-9414-2019-2-320-329
- Kondratyev NB, Kazantsev EV, Osipov MV, Bazhenova AE, Linovskaya NV. The influence of the amount of caramel syrup on the processes of moisture transfer during the storage of marmalade. Proceedings of the Voronezh State University of Engineering Technologies. 2020;82(4):24–29. (In Russ.). https://doi.org/10.20914/2310-1202-2020-4-24-29
- Bolotov VM, Savvin PN, Komarova EV, Koshevarova IB. Effect of natural carotenoids and anthocyanins on properties of healthy food products. IOP Conference Series: Earth and Environmental Science. 2021;640(5). https://doi.org/10.1088/1755-1315/640/5/052001
- Teixeira-Lemos E, Almeida AR, Vouga B, Morais C, Correia I, Pereira P, et al. Development and characterization of healthy gummy jellies containing natural fruits. Open Agriculture. 2021;6(1):466–478. https://doi.org/10.1515/opag-2021-0029
- Di Monaco R, Miele NA, Cabisidan EK, Cavella S. Strategies to reduce sugars in food. Current Opinion in Food Science. 2018;19:92–97. https://doi.org/10.1016/j.cofs.2018.03.008
- Belkacem A, Ellouze I, Debbabi H. Partial substitution of sucrose by non-nutritive sweeteners in sour orange marmalades: effects on quality characteristics and acute postprandial glycemic response in healthy volunteers. The North African Journal of Food and Nutrition Research. 2021;5(11):1–9. https://doi.org/10.51745/najfnr.5.11.1-9
- Nepovinnykh NV, Klyukina ON, Kodatskiy YuA, Ptichkina NM, Yeganehzad S. Study of the stability of foam and viscoelastic properties of marshmallow without gelatin. Foods and Raw Materials. 2018;6(1):90–98. https://doi.org/10.21603/2308-4057-2018-1-90-98
- Milani J, Maleki G. Hydrocolloids in food industry. In: Valdez B, editor. Food Industrial processes – methods and equipment. Croatia: InTech; 2012. pp. 17–38. https://doi.org/10.5772/32358
- Piskunenko KR, Popov VG. Trends in production of functional marmalade. Proceedings of the Voronezh State University of Engineering Technologies. 2020;82(2):72–76. (In Russ.). https://doi.org/10.20914/2310-1202-2020-2-72-76
- Barbosa-Cánovas GV, Fontana AJ, Schmidt SJ, Labuza TP. Water activity in foods: Fundamentals and applications. Oxford: Blackwell Publishing; 2007. 440 p.
- Nikitin IA, Nikitina МА, Allilueva NМ, Krivosheev АYu. Comprehensive assessment of fruit jelly with an improved carbohydrate profile based on unconventional plant raw materials. Foods and Raw Materials. 2019;7(1):26–34. https://doi.org/10.21603/2308-4057-2019-1-26-34
- Caballero-Ceron C, Guerrero-Beltran JA, Mujica-Paz H, Torres JA, Welti-Chanes J. Moisture sorption isotherms of foods: Experimental methodology, mathematical analysis, and practical applications. In: Gutiérrez-López GF, Alamilla-Beltrán L, Buera MP, Welti-Chanes J, Parada-Arias E, Barbosa-Cánovas GV, editors. Water stress in biological, chemical, pharmaceutical and food systems. New York: Springer; 2015. pp. 187–214. https://doi.org/10.1007/978-1-4939-2578-0_15
- Ben Rejeb I, Dhen N, Kassebi S, Gargouri M. Quality evaluation and functional properties of reduced sugar jellies formulated from citrus fruits. Journal of Chemistry. 2020;2020. https://doi.org/10.1155/2020/5476872
- Kavaya RI, Omwamba MN, Chikamai BN, Mahungu SM. Sensory evaluation of syneresis reduced jam and marmalade containing gum Arabic from Acacia senegal var. kerensis. Food and Nutrition Sciences. 2019;10(11). https://doi.org/10.4236/fns.2019.1011096
- Rubio-Arraez S, Capella JV, Castelló ML, Ortolá MD. Physicochemical characteristics of citrus jelly with non cariogenic and functional sweeteners. Journal of Food Science and Technology. 2016;53(10):3642–3650. https://doi.org/10.1007/s13197-016-2319-4
- Goshchansakaya MN, Fetisov EA, Petrov AN, Radaeva IA, Turovskaya SN, Galstyan AG. Water activity in fructose solutions. Food Processing: Techniques and Technology. 2010;18(3):100–106. (In Russ.).
- Yazdani F, Raftani Amiri Z, Shahiri Tabarestani H. Preparation of low calorie sour tea jelly using stevia and gelatin of chicken skin-evaluation of the product. Journal of Food Technology and Nutrition. 2021;18(3):55–68.
- Rubio-Arraez S, Benavent C, Ortolá MD, Castelló ML. Influence of low glycaemic index sweeteners on antioxidant, sensory, mechanical, and physicochemical properties of a watermelon jelly. Journal of Food Quality. 2018;2018. https://doi.org/10.1155/2018/8412017
- Einhorn-Stoll U, Kunzek H. The influence of the storage conditions heat and humidity on conformation, state transitions and degradation behaviour of dried pectins. Food Hydrocolloids. 2009;23(3):856–866. https://doi.org/10.1016/j.foodhyd.2008.05.001.
