

Аннотация
Introduction. The bacterium strain Paracoccus carotinifaciens VTP20181 isolated in Vietnam produces canthaxanthin, a carotenoid widely used in the food and pharmaceutical industries. The aim of this work was to determine optimal parameters for canthaxanthin extraction from fermented biomass of P. carotinifaciens VTP20181.Study objects and methods. First, a series of single factor investigations were carried out in regard to maximal carotenoid content in the biomass extract obtained by using ultrasonic waves. Four parameters of the extraction process, such as extraction temperature, solvent/material ratio, extraction time, and ultrasonic output power, were studied. The obtained results were then optimized by using Response Surface Methodology (RSM) and Box-Behnken experimental design.
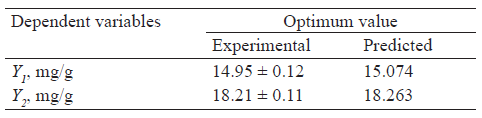
Results and discussion. The optimal technological parameters of the extraction process included extraction temperature of 35°C, solvent/material ratio of 9.5:1 (v/w), extraction time of 90 min, and ultrasonic output power of 145 W. Under optimal conditions, canthaxanthin and total carotenoid contents were determined as 14.95 ± 0.12 and 18.21 ± 0.11 mg/g respectively, which were compatible with theoretical calculations ‒ 15.074 and 18.263 mg/g, respectively.
Conclusion. Current results confirmed that the strain of halophilic P. carotinifaciens VTP20181 is a potential source for canthaxanthin biosynthesis.
Ключевые слова
Paracoccus carotinifaciens VTP20181, canthaxanthin, total carotenoid, optimization, response surface methodologyВВЕДЕНИЕ
Natural pigments derived from β-carotene exhibit many outstanding features, such as strong antioxidative properties and enhanced color persistence, and have been studied for feasibility in industrial and food applications [1, 2]. Experimental data and clinical trials proved beta carotene and its derivatives, such as canthaxanthin, astaxanthin, zeaxanthin and lutein, to be able to confer beneficial effects on human health. They are able to remove free radicals, strengthen cell walls, as well as have anti-tumoral, immunity-enhancing and cell protecting capabilities that greatly contribute to prevention and treatment of cardiovascular diseases and obesity [3–6].
Currently, carotenoids are one of the natural pigment groups widely used in the food, pharmaceutical, cosmetic, and livestock industries [7–9]. The total value of products derived from carotene worldwide in 2015 reached $1.21 billion and is increasing gradually, 3–5% each year. By 2025, the commercial value is estimated to reach USD $2 billion [10, 11].
Canthaxanthin (4,4’-diketo-β-carotene) is a carote- noid with stable polyene backbone frame structure, which provides a better antioxidant effect [12–14]. This compound was discovered for the first time in an edible fungus called Paracoccus carotinifaciens and is now obtained from some plant species, crayfish, salmon, mushrooms, seaweed, and bacteria [15–18].
Although chemical synthesis of carotenoids has been long established, recent restrictions imposed on the use of synthetic chemicals in the food and pharmaceutical industries have called for more efficient production of pigments from natural sources. Engineered biosynthesis of canthaxanthin from microbial sources is an alternative to chemical sinthesis due to its advantages including health safety and independence from natural conditions [19]. Particularly, D. natronolimnaea HS-1 bacterial strain was identified as a suitable microorganism for industrial production of canthaxanthin, with canthaxanthin yield of 5.31 mg/L under optimal culture conditions in batch fermenter system [20, 21]. In Vietnam, some strains with high canthaxanthin production capacity, such as Staphyloccocus CNTP 4191, Staphyloccocus CNTP 4192, Haloferax alexandrinus NBRC 16590, and P. carotinifaciens VTP20181, were also isolated.
Extraction of carotenoids and beta carotene derivatives from bacterial biomass can be carried out by using various techniques. They are microwave assisted-extraction, ultrasound-assisted extraction, pulsed electric field assisted extraction, and supercritical fluid extraction [22–25]. However, efficiency of such processes vary greatly depending on technological parameters, surfactants, and used solvents [26–30]. Therefore, further optimization of technological parameters with respect to output is necessary in process intensification at larger scale [31, 32].
This study was aimed to optimize canthaxanthin extraction process from the biomass of the bacterium P. carotinifaciens VTP20181 isolated in Vietnam.
ОБЪЕКТЫ И МЕТОДЫ ИССЛЕДОВАНИЯ
The object of the study was dry biomass of Paracoccus carotinifaciens VTP20181 bacteria obtained after fermentation and spray drying. The biomass was packed in vacuum bags and refrigerated at (–4)°C to be prepared for the extraction process.
Extraction. Exactly 100 g of dry biomass was weighed by using a PA214 analytical scale (Ohaus-US, China) and transferred to a 2000 mL three-neck flask. Different volumes of solvents (7:1, 9:1, and 11:1, v/w) were added into the flask and shook to allow solvent penetration into the biomass. The solvent was 96% food-grade ethanol supplemented with 0.5% glyceryl monostearate for more effective extration. The temperature was maintained at pre-determined levels by using the reflux condenser apparatus and a water bath.
A UP200Ht ultrasonic homogenizer with sonotrode S26d14 ultrasound head (Germany, 26 kHz, 0–200 W) was usedfor extraction. The ultrasonic power and time were also adjusted for investigation at certain research levels. The extract was separated from the solid phase through a Buchner funnel and concentrated to obtain the total extract that contained canthaxanthin and totsl caratenoids.
Determination of total carotenoid content. To determine total caratenoids, we used the method of de Carvalho et al. with slight modifications [33]. First, 5 g of the biomass extraxt was extracted with 25 mL of acetone and filtered under vacuum. The permeate was re-extracted three times until the color of the obtained extract was transparent. Purified water was added to the obtained extract to prevent emulsion formation, then transferred to a 500 mL separatory funnel containing 40 mL of petroleum ether. Carotenoids will move to the petroleum ether phase (light phase), and the soluble acetone phase (dense phase) was removed. The separation was performed four times till no solvent was observed. Afterwards, water was removed from the petroleum ether phase by using anhydrous sodium sulfate in a 50 mL flask. To determine tottal caratenoid content (mg/g), the absorbance of the sample was read at 450 nm.
![]()
where A is the absorbance; V is the total extract volume, mL; P is the sample weight, g; A1%1 cm is the β-carotene extinction coefficient of petroleum ether ( A1%1 cm = 2592).
Determination of canthaxanthin content [34]. The reference standard, canthaxanthin (99% HPLC), was purchased from Sigma-Aldrich (Merck). Sigma-Aldrich also supplied all solvents (CHROMASOLV® grade methanol and chloroform, ethanol p.a., n-hexane p.a., and i-propanol p.a). Deionized water (σ ≤ 0.4 µS/cm) was used in the experiment.
Analytical HPLC was performed with a C-18 column Hypersil Gold (5µm; 150×4.6 mm) on a Thermo system and detector PDA. The methanol-water mobile phase (97:3, v/v) was filtered through a 0.45 μm membrane and degassed. The analysis was carried out at a flow rate of 1.0 mL/min at room temperature. Chromatograms were recorded at 475 nm and used to determine the content of canthaxanthin in the sample, which was expressed as mg/g extract.
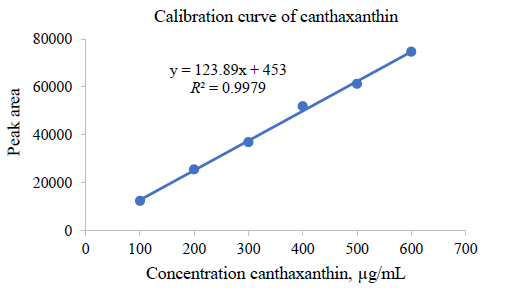
To prepare calibration standards, 2.5 mg of canthaxanthin standard was dissolved in 25 mL of chloroform to form the stock solution, which was stored at 12°C. The stock solution was then diluted with methanol to obtain standard solutions with known concentrations ranging from 100 to 700 µg/mL. The standard solutions were then measured for peak area to build the calibration curve.
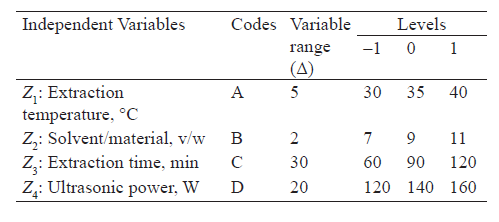
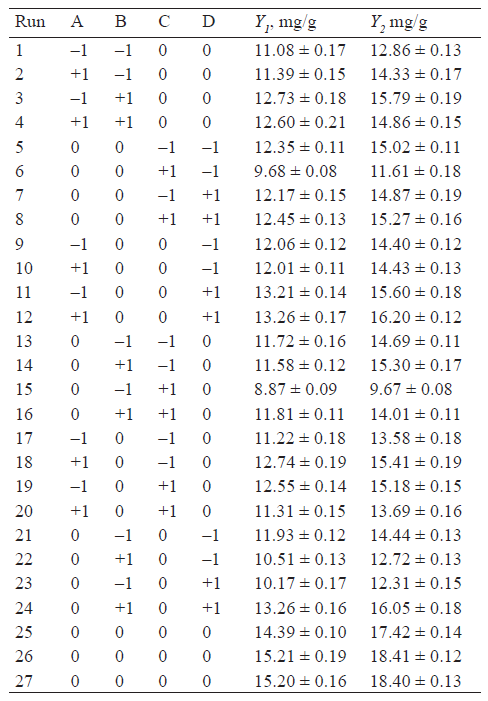
Experiment design and optimization. The canthaxanthin extraction process was optimized using the Response Surface Methodology (RSM), with canthaxanthin and total carotenoid contents as dependent variables. Experimental factors of the process included extraction temperature, solvent/material ratio, extraction time, and ultrasonic power. First, the factors were individually investigated to define a set of empirical values and the central range. Further, the obtained values were used in Box-Behnken model using Design-Expert 7.0 software to produce 27 sets of process parameters (Tables 1 and 2). Those sets were then actually attempted to collect data on canthaxanthin content and total carotenoid content, which were fitted in two second-order polynomial equations [35].
The analysis of variance (ANOVA) was carried out to determine the compatibility of the model. The second-order equation representing the general function form of one desired outcome with respect to independent variables looks as follows:
![]()
where, Ŷ is the respone variable, X is independent variables, and k is number of tested variables. b0 is the intercept coefficient; bj is the linear coefficient; bjj is the square coefficient and buj is the interaction coefficient.
РЕЗУЛЬТАТЫ И ИХ ОБСУЖДЕНИЕ
Single factor investigation. Based on some preliminary investigations of canthaxanthin extraction from microbial biomass, we selected the initial parameters for this process: extraction temperature of 35°C, solvent/material ratio of 9:1 (v/w), extraction time of 90 min, and ultrasonic power of 160 W. In our investigations, we varied only one of the selected conditions, other three conditions were kept at their initial levels.
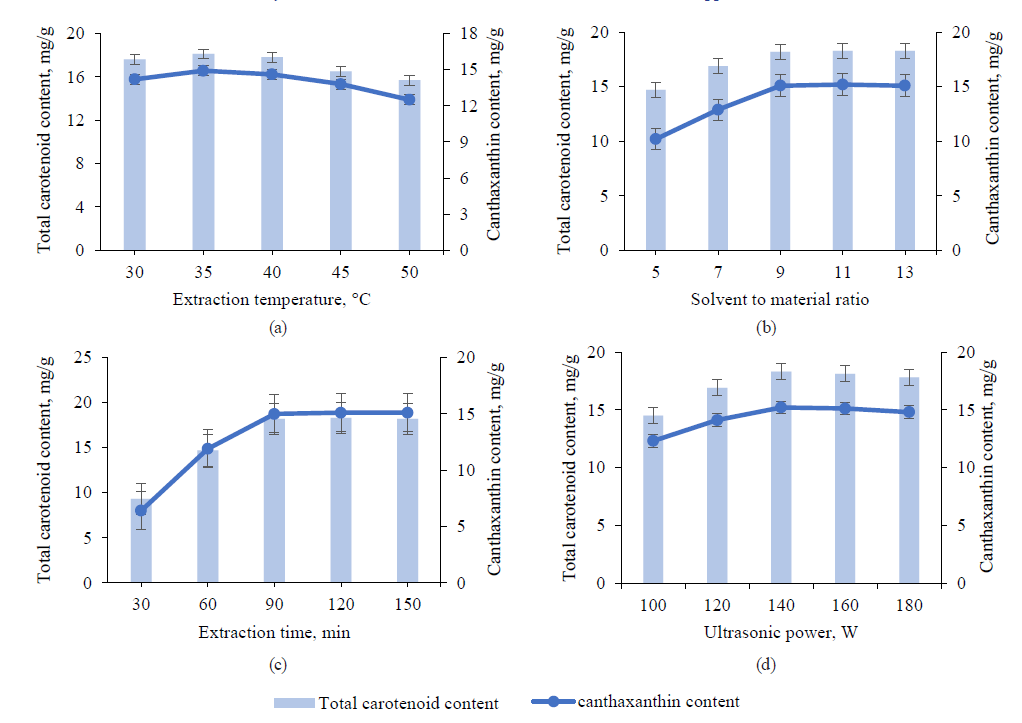
Firstly, we investigated the effects of temperature on the extraction process (Fig. 2a). Temperature ranged from 30 to 50°C with a 5°C interval. At 30°C, the obtained total carotenoid content and canthaxanthin content reached 17.6 and 14.2 mg/g, respectively. As the temperature was increased from 30 to 35°C, the extraction efficiency increased rapidly and reached its maximum at 35°C, with a total carotenoid content of 18.1 mg/g and canthaxanthin content of 14.9 mg/g. When the temperature continued being increased to 40 and to 50°C, the total carotenoid and canthaxanthin contents tended to decrease gradually and reached the lowest values of 15.7 and 12.5 mg/g, respectively, at 50°C. The results were completely consistent with Aflaki as well as Das and Bera who studied effects of temperature on carotenoid extraction [36, 37].
The increasing of the temperature from 30 to 35°C improved efficiency extraction due to the increased carotenoid diffusion capacity and decreased solvent viscosity, which allows for better penetration of the solvent into the material. However, elevating the temperature past 40°C can degrade or oxidize carotenoid compounds. Therefore, to ensure the highest efficiency of canthaxanthin and total carotenoid extraction, we selected 35°C as the optimum temperature for successive experiments. The low level (–1) and the high level (+1) were 30 and 40°C, respectively (Table 1).
In the next experiment, a solvent/material ratio was varied from 5:1 to 13:1 (v/w). Figure 2b shows that the increase of the solvent/material ratio from 5:1 to 9:1 increased significantly canthaxanthin and total carotenoid contents from 10.2 to 15.1 mg/g and from 14.7 to 18.2 mg/g, respectively. When the ratio was increased to 11:1 and 13:1, canthaxanthin and total carotenoid contents were almost unchanged. Our results were entirely consistent with those of other researchers [37, 38].
Solute concentrations of the material and solvent significantly differed, according to the equilibrium principle, the outward movement of solutes from intracellular spaces into the solvent occurred at high speed. When equilibrium was attained, the diffusion process would gradually slow down despite the increase in solvent volume. Therefore, the solvent/material ratio of 9:1 was selected as the optimum ratio. The low level (–1) and the high level (+1) were 7:1 and 11:1, respectively (Table 1).
Figure 2c demontrates the effect of time (30 to 150 min) on the extraction process. With increasing extraction time from 30 to 90 min, canthaxanthin content increased from 6.4 to 15.0 mg/g, and total carotenoid content increased from 9.3 to 18.2 mg/g. When the extraction time was increased from 90 to 150 min, canthaxanthin and total carotenoid contents did not change significantly. Similar results were found by Roohinejad et al. and Strati and Oreopoulou [39, 40].
Initially, an increase in extraction time allowed more solutes to diffuse into the solvent. However, at a certain threshold, equilibrium will be established, and even a significant increase in extraction time does not produce any noticeable change in extraction yield. Therefore, to ensure the extraction efficiency and the energy and time optimization of the process, we selected an extraction time of 90 min as the baseline for the next experiment. The low level (–1) and the high level (+1) were 60 and 120 min, respectively (Table 1).
Lastly, we investigated the effect of ultrasonic output power, which was in a range of 100 to 180 W, on canthaxanthin and total carotenoid contents (Fig. 2d). The results show that increasing the ultrasonic power from 100 to 140 W increased sharply canthaxanthin and total carotenoids from 12.3 to 15.2 mg/g and 14.5 to 18.3 mg/g, respectively. Further increasing the ultrasonic power to 160 W caused a slight reduction in the canthaxanthin and total carotenoid contents to 15.1 and 18.1 mg/g, respectively. When output power reached 180 W, both canthaxanthin and total carotenoids decreased rapidly to 14.8 and 17.7 mg/g.
This is because ultrasonic waves act as agents breaking down the cell membrane of materials, which makes the diffusion process easier. However, when the ultrasonic power exceeds the threshold, the excessive number of air bubbles slows down the extraction process. The contact surface between the raw material and the solvent diminishes, resulting in reduced performance. Similar results were revealed by Yan et al. [41]. Therefore, ultrasonic power of 140 W was selected for the futher experiments. The low level (–1) and the high level (+1) were 120 and 160 W, respectively (Table 1).
Estimation of RSM model and statistical analysis. Two models corresponding to the two target functions, namely canthaxanthin content (Y1) and total carotenoid content (Y2), were estimated using data from the experiments guided by the Box-Behnken design. Four independent variables were extraction temperature, extraction time, solvent/material ratio, and ultrasonic output power. After the estimated function had been obtained and optimal conditions had been calculated, real experiments were performed to verify those optimal conditions and to determine model validity.
Based on separate single factor investigations, 27 experiments were conducted according to the experimental design matrix. To justify Y1 and Y2 response functions, F-, P-, and R2-values were used to evaluate the linear regression analysis results (Table 3). Based on the regression results, canthaxanthin content (Y1) and total carotenoid content (Y2) could be described as independent variables of second-degree functions, as shown in Table 4.
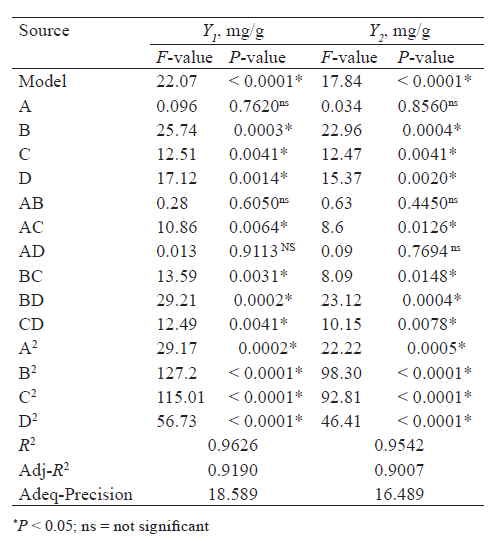
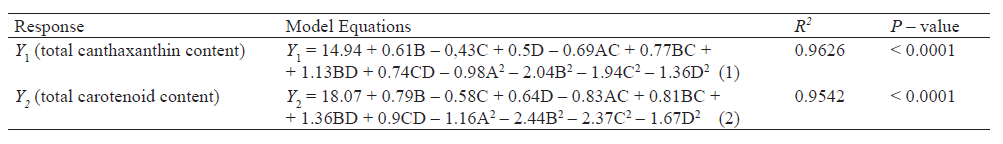
The significance of the regression was also confirmed by F-values for Y1 and Y2, which achieved the value of 22.07 and 17.84, respectively and the very low P-value (P < 0.0001) (Table 3). The coefficients of determination (R2) of the two equations were 0.9626 and 0.9542, suggesting that 96.26 and 95.42% of variability in canthaxanthin and total carotenoid content were explainable by experimental results, respectively. Besides, the value of Adj-R2 (0.9190 and 0.9007, respectively), also showed the high accuracy of the experimental data in the limited range.
Regression equations (1) and (2) showed that all four technological factors (A, B, C, and D) affected the target function’s value. Of which, extraction temperature (A) exerted the minimal direct impact on the value of the target function and influenced the responses mostly through its indirect interaction with extraction time (AC) and square interaction (A2). The remaining three variables had a significant influence on the target functions through linear effects (B, C, D). Among them, single variables B and D had a positive effect on the target functions, while variable C had an inverse effect on the target functions corresponding to their coefficients in the regression equation (1) and (2). The influence of the technological variables on the target function could be ranked descendingly by the impact magnitude as follows: B > D > C > A.
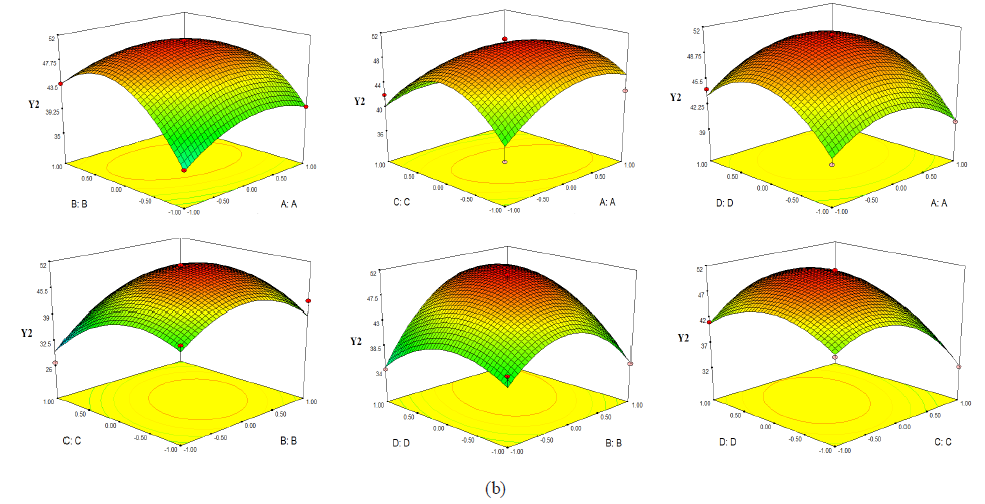
Response surface analysis. Three-dimensional response surface spaces were plotted by using Design Expert software. The X and Y axes of the response surfaces in three dimensions represented the two varying factors, while other factors where held at their central values. The Z-axes represented one of the two target functions: canthaxanthin content, and total carotenoid content.
The red areas on the response surfaces represented pairwise combinations that gave desirable outcomes of Y1 or Y2 and depended on the magnitude and the sign of the component variable that formed the response. For example, C exhibited negative signs in both (1) and (2). Therefore, the area that corresponded to optimal outcomes of Y1 and Y2 in the surfaces constituted by C was smaller than those of remaining pairs without C (AD, AB and BD).
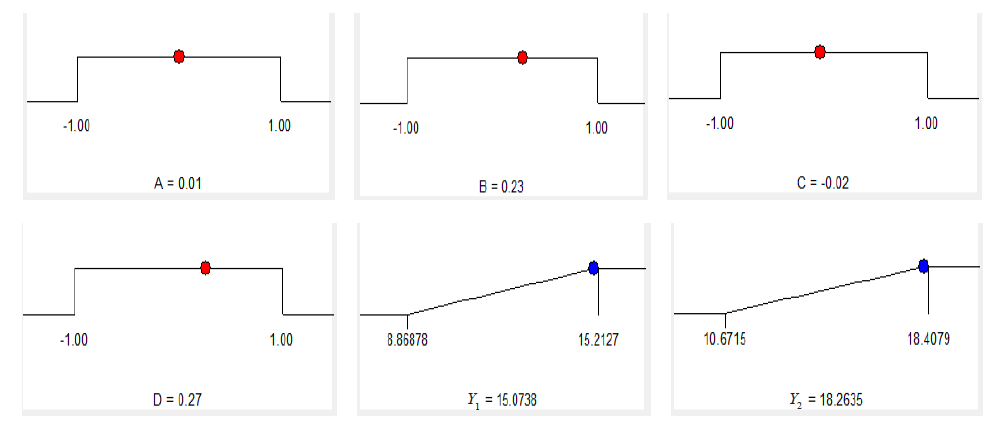
Optimization and model verification. The optimal values of independent variables were determined by solving the quadratic regression equation with respect to maximal canthaxanthin and total carotenoid content. The importance of canthaxanthin content (Y1) and total carotenoid content (Y2) was selected as at level 4 and level 3, respectively. Predicted values showed that canthaxanthin content and total carotenoid content attained their maxima with the following conditions: extraction temperature of 35°C, extraction time of 90 min, ultrasonic output power of 145 W, and solvent/material ratio of 9.5:1 (v/w). (Table 5, Fig. 4). Under optimized conditions, predicted and actual values of canthaxanthin content and total carotenoid content (Table 6) were approximately equal to each other, we could once again assert that our established model had a high compatibility.


ВЫВОДЫ
In this study, the surface response methodology combined with the experimental design of Box-Behnken model was applied to optimize the extraction process of canthaxanthin from fermented biomass of Paracoccus carotinifaciens VTP20181 bacteria isolated in Vietnam. We used four independent variables: extraction time, extraction temperature, ultrasonic output power, and solvent/material ratio (v/w). Dependent variables were canthaxanthin content and total carotenoid content.
The obtained optimized conditions for the extraction process were: extraction time of 90 min, extraction temperature of 35°C, ultrasonic output power of 145 W, and solvent/material ratio of 9.5:1. Under these conditions, canthaxanthin and total carotenoid contents were 14.95 ± 0.12 and 18.21 ± 0.11 mg/g, respectively. Theoretical calculation models were completely compatible with the experiment.
КОНФЛИКТ ИНТЕРЕСОВ
The authors declare no conflict of interest.БЛАГОДАРНОСТИ
This research was funded by project code No. 10.17/CNSHCB under the project of Biotechnology Development and Application in the Manufacturing Industry to 2020 of the Ministry of Industry and Trade.СПИСОК ЛИТЕРАТУРЫ
- Namitha KK, Negi PS. Chemistry and biotechnology of carotenoids. Critical Reviews in Food Science and Nutrition. 2010;50(8):728–760. https://doi.org/10.1080/10408398.2010.499811.
- Torrissen OJ, Christiansen R. Requirements for carotenoids in fish diets. Journal of Applied Ichthyology. 1995;11(3–4):225–230. https://doi.org/10.1111/j.1439-0426.1995.tb00022.x.
- Stahl W, Sies H. Bioactivity and protective effects of natural carotenoids. Biochimica et Biophysica Acta (BBA) – Molecular Basis of Disease. 2005;1740(2):101–107. https://doi.org/10.1016/j.bbadis.2004.12.006.
- Liñán-Cabello MA, Paniagua-Michel J, Hopkins PM. Bioactive roles of carotenoids and retinoids in crustaceans. Aquaculture Nutrition. 2002;8(4):299–309. https://doi.org/10.1046/j.1365-2095.2002.00221.x.
- Liau B-C, Shen C-T, Liang F-P, Hong S-E, Hsu S-L, Jong T-T, et al. Supercritical fluids extraction and antisolvent purification of carotenoids from microalgae and associated bioactivity. The Journal of Supercritical Fluids. 2010;55(1):169–175. https://doi.org/10.1016/j.supflu.2010.07.002.
- Peng J, Yuan J-P, Wu C-F, Wang J-H. Fucoxanthin, a marine carotenoid present in brown seaweeds and diatoms: metabolism and bioactivities relevant to human health. Marine Drugs. 2011;9(10):1806–1828. https://doi.org/10.3390/md9101806.
- Kläui H. Industrial and commercial uses of carotenoids. In: Britton G, Goodwin TW, editors. Carotenoid chemistry and biochemistry; Pergamon Press; 1981. pp. 309–328.
- Marusich WL, Bauernfeind JC. Oxycarotenoids in poultry feeds. In: Stewart GF, Schweigert BS. Hawthorn J, editors. Carotenoids as colorants and vitamin A precursors. Academic Press; 1981. pp. 319–462.
- Simpson KL, Katayama T, Chichester CO. Carotenoids in fish feeds. In: Stewart GF, Schweigert BS. Hawthorn J, editors. Carotenoids as colorants and vitamin A precursors. Academic Press; 1981. pp. 463–538.
- Joel J. Carotenoids market by type (astaxanthin, beta-carotene, lutein, lycopene, canthaxanthin, zeaxanthin, and others) for feed, food, supplements, cosmetics, and pharmaceuticals – global industry perspective, comprehensive analysis, size, share, growth, segmen. Trends and Forecast, 2015–2021 [Internet]. [cited 2020 Sep 20]. Available from: http://www.marketresearchstore.com/report/carotenoids-market-z76031.
- Cardoso LAC, Karp SG, Vendruscolo F, Kanno KYF, Zoz LIC, Carvalho JC. Biotechnological production of carotenoids and their applications in food and pharmaceutical products. In: Cvetkovic DJ, Nikolic GS, editors. Carotenoids. IntechOpen; 2017. https://doi.org/10.5772/67725.
- Palozza P, Maggiano N, Calviello G, Lanza P, Piccioni E, Ranelletti FO, et al. Canthaxanthin induces apoptosis in human cancer cell lines. Carcinogenesis. 1998;19(2):373–376. https://doi.org/10.1093/carcin/19.2.373.
- Veiga-Crespo P, Blasco L, Do Santos FR, Poza M, Villa TG. Influence of culture conditions of Gordonia jacobaea MV-26 on canthaxanthin production. International Microbiology. 2005;8(1):55–58.
- Choubert G, Storebakken T. Dose response to astaxanthin and canthaxanthin pigmentation of rainbow trout fed various dietary carotenoid concentrations. Aquaculture. 1989;81(1):69–77. https://doi.org/10.1016/0044-8486(89)90231-7.
- Strati I, Sinanoglou VJ, Kora L, Miniadis-Meimaroglou S, Oreopoulou V. Carotenoids from foods of plant, animal and marine origin: An efficient HPLC-DAD separation method. Foods. 2012;1(1):52–65. https://doi.org/10.3390/foods1010052.
- Dufossé L. Pigments, microbial. In: Schaechter M, editor. Encyclopedia of microbiology. Academic Press; 2009. pp. 457–471. https://doi.org/10.1016/B978-012373944-5.00155-3.
- Suhonen R, Plosila M. The effect of beta-carotene in combination with canthaxanthin, ro 8–8427 (Phenoro®), in treatment of polymorphous light eruptions. Dermatology. 1981;163(2):172–176. https://doi.org/10.1159/000250156.
- Arden GB, Oluwole JOA, Polkinghorne P, Bird AC, Barker FM, Norris PG, et al. Monitoring of patients taking canthaxanthin and carotene: An electroretinographic and ophthalmological survey. Human & Experimental Toxicology. 1989;8(6):439–450. https://doi.org/10.1177/096032718900800603.
- Dufossé L, Galaup P, Yaron A, Arad SM, Blanc P, Murthy KN, et al. Microorganisms and microalgae as sources of pigments for food use: a scientific oddity or an industrial reality? Trends in Food Science and Technology. 2005;16(9):389–406. https://doi.org/10.1016/j.tifs.2005.02.006.
- Bhosale P, Bernstein PS. Microbial xanthophylls. Applied Microbiology and Biotechnology. 2005;68(4):445–455. https://doi.org/10.1007/s00253-005-0032-8.
- Khodaiyan K, Razavi SH, Emam-Djomeh Z, Mousavi SMA, Hejazi MA. Effect of culture conditions on canthaxanthin production by Dietzia natronolimnaea HS-1. Journal of Microbiology and Biotechnology. 2007;17(2):195–201.
- Ho KKHY, Ferruzzi MG, Liceaga AM, San Martín-González MF. Microwave-assisted extraction of lycopene in tomato peels: Effect of extraction conditions on all-trans and cis-isomer yields. LWT – Food Science and Technology. 2015;62(1):160–168. https://doi.org/10.1016/j.lwt.2014.12.061.
- Singh D, Barrow CJ, Mathur AS, Tuli DK, Puri M. Optimization of zeaxanthin and β-carotene extraction from Chlorella saccharophila isolated from New Zealand marine waters. Biocatalysis and Agricultural Biotechnology. 2015;4(2):166–173. https://doi.org/10.1016/j.bcab.2015.02.001.
- Jaeschke DP, Menegol T, Rech R, Mercali GD, Marczak LDF. Carotenoid and lipid extraction from Heterochlorella luteoviridis using moderate electric field and ethanol. Process Biochemistry. 2016;51(10):1636–1643. https://doi.org/10.1016/j.procbio.2016.07.016.
- Zaghdoudi K, Framboisier X, Frochot C, Vanderesse R, Barth D, Kalthoum-Cherif J, et al. Response surface methodology applied to Supercritical Fluid Extraction (SFE) of carotenoids from Persimmon (Diospyros kaki L.). Food Chemistry. 2016;208:209–219. https://doi.org/10.1016/j.foodchem.2016.03.104.
- Alfonsi K, Colberg J, Dunn PJ, Fevig T, Jennings S, Johnson TA, et al. Green chemistry tools to influence a medicinal chemistry and research chemistry based organisation. Green Chemistry. 2008;10(1):31–36. https://doi.org/10.1039/b711717e.
- Capello C, Fischer U, Hungerbühler K. What is a green solvent? A comprehensive framework for the environmental assessment of solvents. Green Chemistry. 2007;9(9):927–934. https://doi.org/10.1039/b617536h.
- Goula AM, Ververi M, Adamopoulou A, Kaderides K. Green ultrasound-assisted extraction of carotenoids from pomegranate wastes using vegetable oils. Ultrasonics Sonochemistry. 2017;34:821–830. https://doi.org/10.1016/j.ultsonch.2016.07.022.
- Desai RK, Streefland M, Wijffels RH, Eppink MHM. Novel astaxanthin extraction from Haematococcus pluvialis using cell permeabilising ionic liquids. Green Chemistry. 2016;18(5):1261–1267. https://doi.org/10.1039/c5gc01301a.
- Amiri-Rigi A, Abbasi S. Microemulsion-based lycopene extraction: Effect of surfactants, co-surfactants and pretreatments. Food Chemistry. 2016;197:1002–1007. https://doi.org/10.1016/j.foodchem.2015.11.077.
- Le XD, Nguyen MC, Vu DH, Pham MQ, Pham QL, Nguyen QT, et al. Optimization of microwave-assisted extraction of total phenolic and total flavonoid contents from fruits of Docynia indica (Wall.) decne. Using response surface methodology. Processes. 2019;7(8). https://doi.org/10.3390/pr7080485.
- Le XT, Vi VLL, Toan TQ, Bach LG, Truc TT, Ha PTH. Extraction process of polyphenols from soybean (Glycine max L.) sprouts: Optimization and evaluation of antioxidant activity. Processes. 2019;7(8):1–18. https://doi.org/10.3390/PR7080489.
- de Carvalho LMJ, Gomes PB, Godoy RLDO, Pacheco S, do Monte PHF, de Carvalho JLV, et al. Total carotenoid content, α-carotene and β-carotene, of landrace pumpkins (Cucurbita moschata Duch): A preliminary study. Food Research International. 2012;47(2):337–340. https://doi.org/10.1016/j.foodres.2011.07.040.
- Tzanova M. Quantification of astaxanthin and canthaxanthin in muscle tissues of rainbow trout Oncorhynchus mykiss and brook trout Salvelinus fontinalis. Turkish Journal of Fisheries and Aquatic Sciences. 2018;18(9):1053–1061. https://doi.org/10.4194/1303-2712-v18_9_05.
- Pham HH. The data analysis and planning of experiments in chemical research. Ha Noi; 2007. pp. 89–99. (In Viet.).
- Aflaki N. Optimization of carotenoid extraction in peel and flesh of cantaloupe (Cucumis melo L.) with ethanol solvent. Master’s thesis. Université Laval; 2012.
- Das S, Bera D. Mathematical model study on solvent extraction of carotene from carrot. International Journal of Research in Engineering and Technology. 2013;02(09):343–349. https://doi.org/10.15623/ijret.2013.0209052.
- Tan PW, Tan CP, Ho CW. Antioxidant properties: Effects of solid-to-solvent ratio on antioxidant compounds and capacities of Pegaga (Centella asiatica). International Food Research Journal. 2011;18(2):557–562.
- Roohinejad S, Oey I, Everett DW, Niven BE. Evaluating the effectiveness of β-carotene extraction from pulsed electric field-treated carrot pomace using oil-in-water microemulsion. Food and Bioprocess Technology. 2014;7(11):3336–3348. https://doi.org/10.1007/s11947-014-1334-6.
- Strati IF, Oreopoulou V. Effect of extraction parameters on the carotenoid recovery from tomato waste. International Journal of Food Science and Technology. 2011;46(1):23–29. https://doi.org/10.1111/j.1365-2621.2010.02496.x.
- Yan F, Fan K, He J, Gao M. Ultrasonic-assisted solvent extraction of carotenoids from rapeseed meal: Optimization using response surface methodology. Journal of Food Quality. 2015;38(6):377–386. https://doi.org/10.1111/jfq.12154.
