

Аннотация
Introduction. This article presents the development of mathematical models related to the effect of the initial content of dry matter, yeast, and yeast energizer on the fermentation rate, the alcohol content, and the dry matter content in the finished product – mead.Study objects and methods. The mathematical models were developed by using the response surface methodology (RSM). The effect of yeast, dry matter, and yeast energizer contents were tested in concentration ranges of 150–600 mg/L, 16.3–24.4%, and 140–500 mg/L, respectively. The starting substrates used were honeydew honey and 10% apple juice. Yeast was rehydrated and added in different amounts to obtain required concentrations. Initial dry matter concentrations were measured by a refractometer. At the end of fermentation, oenological parameters of mead, namely dry matter content, pH, and ethanol yield, were determined according to standard methods.
Results and discussion. The statistical estimation of the developed models and the individual model parameters showed that the initial dry matter content had a significant effect on the content of alcohol and dry matter in the final product. While, the initial content of yeast and yeast energizer did not have a significant effect in the tested concentration ranges. In addition, it was proved that the initial content of dry matter and yeast energizer had a significant effect on the fermentation rate, i.e. on the course of fermentation, which was described by a second-degree polynomial.
Conclusion. We determined the optimum content of dry matter (24.4%), amount of yeast (150 mg/L), and concentration of yeast energizer (140 mg/L) in the initial raw material which provided the maximum alcohol yield at a consistent fermentation rate.
Ключевые слова
Response surface methodology, mathematical models, fermentation, mead, yeastВВЕДЕНИЕ
Response surface methodology (RSM) is a collection of statistical and mathematical techniques used in order to design experiments for adequate response predictions, fit a hypothesized (empirical) model to experimentally obtained data under the chosen design, as well as to optimize the conditions for the given process, i.e. to ensure the appropriate selection of input variables that lead to the desired response of a dependent variable [1]. There are several different options of the design of experiments within RSM, and the options which are used the most are Central Composite Design (CCD) and Box-Behnken Design (BBD). When the analyzed process requires adjustments to the experiment which cannot be carried out using a standard design, some of custom designs are used. In that regard, a particularly interesting option is the Historical Data design option, which uses data available from the experiments which have already been conducted. Specifically, Historical Data creates a blank design layout to accept component and factor settings and responses from an existing data set [2].
RSM was presented for the first time by Box and Wilson in the 1950s, and this methodology is therefore often called the Box-Wilson methodology. Detailed information on response surface methodology is described in [3]. In general, RSM enables testing effects and interaction between different process parameters. It is successfully used to optimize or control processes in various areas of production, research, and engineering [4–8]. Some of the examples refer to optimization of the medium composition and process parameters for the control of different bioprocesses, including the mead fermentation process [9–13].
Mead is an alcoholic beverage obtained by fermentation of honey solution. Honey is a natural food produced by honey bees from flower nectar (blossom honey) or plant secretions (honeydew honey). Honey is rich in carbohydrates (mainly glucose and fructose), organic acids, and other components, however concentrations of some components (assimilable nitrogen) can be much lower than those considered optimal for fermentation. High sugar contents and low nitrogen concentration in honey slow down fermentation. It means that the fermentation process requires optimal pH, temperature, and growth conditions. Therefore, various additives, such as pollen, fruit pulps or juices, citric acid, etc., can be used to improve alcohol yields, fermentation rates, sensory characteristics of mead, etc. [14–18].
Fruits and their pulps are rich in carbohydrates, fibers, minerals, vitamin C, carotenoids, as well as phenolic and sulfuric substances. Also, their antioxidant properties can help maintain balance between production and elimination of reactive oxygen forms and other related compounds, thereby attenuating free radical-induced damage to cells [16–19]. Among fruits, apples are a widely consumed, rich source of phytochemicals (quercetin, catechin, phloridzin, chlorogenic acid, etc.), all of which are strong antioxidants [19]. Apples also contain water, sugars, acids, pectin, tannins, dyed and aromatic substances, mineral substances, starch, cellulose, vitamins, as well as phenolic compounds and enzymes. All the components give characteristic features to the fruit.
Available literature has not mentioned optimization of honeydew honey as a substrate for obtaining mead. Therefore, this research aimed to assess effects of the concentration of added yeast, yeast energizer and the dry matter content (independent variables) on the ethanol yield and dry matter content in the final product (dependent variables), with the development of a corresponding mathematical model. The developed mathematical model can enable better control of the process in terms of optimum selection and setting of the process parameters.
ОБЪЕКТЫ И МЕТОДЫ ИССЛЕДОВАНИЯ
Chemicals and equipment. All chemicals used in this study were of analytical grade. In our experiments we used scales (H54AR, Mettler-Toledo, Columbus, USA and PFB 1200-2, KERN & SOHN, Balingen, Germany), a magnetic stirrer (ARE, Velp Scientifica, Usmate, Italy), a vortex (ZX3, Velp Scientifica, Usmate, Italy), a spectrophotometer (Spectronic 1201, Milton Roy, Ivyland, USA), a pH meter (HI-2211, Hanna Instruments, Smithfield, USA), a waterbath (Wisecircu, J.P. Selecta, Abrera, Barcelona, Spain), a refractometer (Leica Abbe Mark II, Reichert Technologies, Depew, USA), and a conductivity meter (HA-2315, Hanna Instruments, Smithfield, USA).
Physicochemical analyses of honey. The study object was honeydew honey from the territory of the Republic of Srpska, Bosnia and Herzegovina. The quality characteristics of honeydew honey was assured by testing it for water content (18.5%), diastase activity (47.67), HMF content (5.47 mg/kg), acidity (50.67 mmol/kg), reducing sugars (68.16%), saccharose (2.01%), and electrical conductivity (1.17 ms/cm) as described by Ordinance on methods for control of honey and other bee products (Official Gazette of BiH no 37/2009). The pH was measured with a pH meter (4.33).
Honey must preparation. Honeydew honey was stirred with water in different ratios to obtain required dry matter content (Tables 1 and 2). The resultant must was pasteurized at 65°C for 10 min (with regular stirring and skimming off the scum) and then cooled and poured into fermentation flasks. Apple fruit was pressed through a laboratory press to obtain juice that was further used in the study to correct the acidity (pH values of the must were adjusted to 3.7–4) and as a source of additional nutrition for yeast.

The resultant juice was also pasteurized at 65°C for 10 min, cooled, and poured into fermentation flasks in amount required for this study (10%). A total of 27 samples were prepared (Table 2) for the experiments. Initial dry matter concentrations were measured refractometrically. Different amounts of yeast energizer VitaFerm® Ultra F3 (Erbslöh, Geisenheim, Germany) were added into all the samples (Tables 1 and 2). Next, commercial yeast Fermol® Associées (AEB, Italy) was rehydrated in distilled water at 35–40°C during 30 min and added into the samples in different amounts (Tables 1 and 2).
The process of alcoholic fermentation was conducted at 25°C for 20 days. All fermentations were carried out in duplicate using a system that consisted of 250 mL flasks containing 180 mL of must and fitted with an airlock to release CO2 produced during fermentation. Dynamics of the fermentation process were controlled by weighing the flasks every 24 h throughout alcoholic fermentation and expressed as the cumulative mass of produced ethanol per hour. The rate of fermentation depends on concentration of such inhibitors as ethanol, acetic acid, fatty acids (hexanoic, octanoic, decanoic acid), proteins (enzymes), furfural, hydroxymethylfurfural, etc. The inhibitors interact synergistically with high osmotic pressure and the increasing concentration of ethanol during fermentation [18].
General oenological parameters. At the end of fermentations, oenological parameters of mead ‒ dry matter content, pH, and ethanol content ‒ were determined according to standard methods [20].
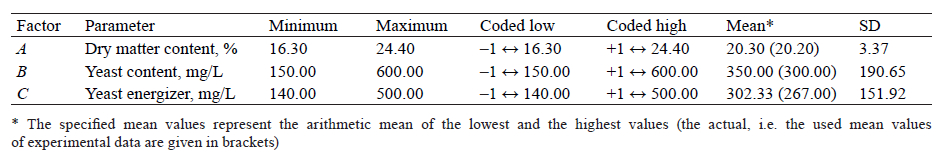
Design of experiments and mathematical modelling. The analysis and processing of previously obtained experimental data were carried out using the Design-Expert 11 program (Stat-Ease, Inc. USA) and the Historical Data Design option. The following variables were used as independent variables: the initial content of dry matter (Factor A), yeast (Factor B), and yeast energizer (Factor C). As dependent (modelled) variables we used maximum fermentation rate (R3), alcohol content (R2), and dry matter content in the product (R1). Table 1 shows the actual and coded values of the above-mentioned variables, while Table 2 shows the corresponding design of experiments.
The relation between the independent variables (A, B, C) and the modelled variables (R1, R2, R3) is described by a second-degree polynomial model, by fitting the experimentally obtained data with the sum of squares. The general form of a second-degree polynomial is given using the following equation:
![]()
The statistical analysis of the developed mathematical models, i.e. the determination of their statistical significance, was conducted using the analysis of variance (ANOVA), i.e. the Fisher’s exact test (F-test). The analysis of variance determined the significance of the effect of each model parameter on the variance of the outcome, in comparison with the total variance of all the observed model parameters.
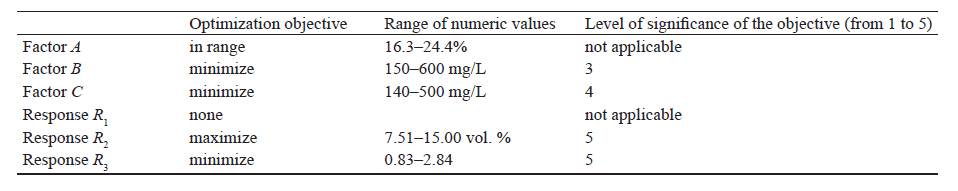
Optimization. In order to determine the initial content of dry matter, yeast, and yeast energizer resulting in the maximum alcohol content, with the fermentation rate as consistent as possible, we carried out the numerical optimization of the developed mathematical models using the Design-Expert 11 program (Stat-Ease, Inc.). Prior to the optimization, we selected the objective – the range of numeric values within which we looked for solutions and the level of significance of reaching the set optimization objective, i.e. we selected the corresponding optimization criteria (Table 3).
РЕЗУЛЬТАТЫ И ИХ ОБСУЖДЕНИЕ
We studied effects of the analyzed independent variables on the values of dry matter content (R1) and alcohol yield (R2) in the finished product – mead, as well as on the maximum fermentation rate (R3). Apart from the determined design of experiments, Table 2 shows the corresponding numeric values of the response of interest (R1, R2, and R1) and the measured pH values.
The results from Table 2 show that the lowest residual dry matter content was measured in the samples which had the lowest dry matter content before fermentation (samples 1–9), while the samples with the highest dry matter content before fermentation (samples 19–27) had the highest content of residual dry matter after fermentation. That is related to the duration of the fermentation process (20 days for all the samples), which means that the dry matter content could decrease, and the ethanol content could increase if the fermentation process was extended.
According to Pereira et al., residual dry matter consists of a high number of different compounds: sucrose, maltose, isomaltose, trisaccharides, tetrasaccharides, glycerol, etc [12]. In the research conducted by Savić et al., the dry matter content ranged between 5.2 and 11.85% [21]. In our work, the highest ethanol content was obtained in samples 19–27, which had the highest dry matter content before fermentation, while the lowest ethanol content was in samples 1–9. In the research conducted by Martínez et al., the ethanol content was 10.11 vol. % after day 18 day of fermentation, and it was 12.52 vol. % after 26 days [22].
The obtained pH values (Table 2) were lower than those of the honey solution, most probably due to acids produced by yeast during fermentation [23, 24]. The pH value is a very important parameter for alcoholic fermentation, because yeast cannot ferment under acidic conditions. In this research, the lowest pH value of mead was 3.07 (sample 19). A low pH value can slow down or even stop the fermentation process, as well as cause incomplete sugar breakdown due to acetic and succinic acid formation, which cause an increase in the content of undissociated fatty acids [23]. Ammonium ion uptake, which is part of yeast energizer, is associated with the excretion of proton ions into the medium, thereby decreasing extracellular pH [25].
By fitting the data from Table 2 within the regression analysis, the corresponding coefficients were determined in Eq. (1), and the following empirical models were developed:


The equations given above are written in the form of the actual values of the factors (A, B, C), and they may be used to predict the corresponding response, simply by inserting the values of A, B, C in the given units. The given equations are normalized and may not be used to determine the significance of the factors A, B, and C. When analyzing equations where +1 and –1 correspond to the largest and least factor values, respectively, the relative effect of individual factors of the process under study may be identified by comparing the coefficients in front of the corresponding factor. Apart from that, equations written in a coded form may be used to predict the response for the given factor level. The above-mentioned equations, written in a coded form, are given below:


The conducted analysis of variance (ANOVA) of the data (Table 2) proved their statistical significance as a whole, as well as the statistical significance of individual members of Eqs. (5)–(7). Table 4 demonstrates the ANOVA values for the developed models related to the effect of the process parameters on the dry matter content after fermentation (Eq. (5)), the alcohol content (Eq. (6)) and the maximum fermentation rate (Eq. (7)). The ANOVA was carried out for the equations written in a coded form. All the conclusions drawn for the equations written in a coded form apply to the equations in an actual form as well.
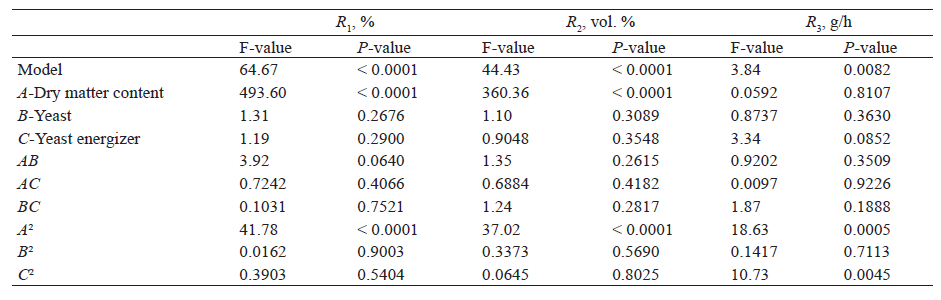
By analyzing the F-values and the P-values for the quadratic equation (5), i.e. the response R1, it can be concluded that the developed model is statistically significant as a whole taking into consideration that the F-value of the model is 64.47 and that there is only 0.01% of probability for such a high F-value to occur due to noise. The P-values below 0.05 indicate that a particular member of the analyzed equation, to which the given value refers, has a statistically significant effect. In the analyzed equation, those are the members A and A2. The P-values above 0.1000 indicate that the given member of the equation does not have a statistically significant effect, and in this case, those are B, C, AB, AC, BC, B2, and C2.
The quadratic models related to the effect of the process parameters on the response R2, i.e. the alcohol content (Eq. (6)), have the F-values of 44.43, and there is only 0.01% of probability for such a high F-value to occur due to noise. Therefore, it can be concluded that the developed model is statistically significant. Like in the previously analyzed equation, the P-values of the members A and A2 are below 0.0001, which means that they are statistically significant members of the given model.
The quadratic models related to the effect of the process parameters on R3, i.e. the maximum fermentation rate (Eq. (7)), have the F-value of 3.84 and the P-value of 0.0082, i.e. there is 0.82% of probability for such a high F-value to occur due to noise. Therefore, it can be concluded that the given model is statistically significant. By analyzing the P-values of the individual members of Eq. (7), it can be concluded that only the members A2 and C2 are statistically significant members of the model, because their P-values are below 0.05 (the P-value of the member A2 is 0.0005, and the P-value of the member C2 is 0.0045).
The validation of the developed models was conducted by comparing the experimentally obtained data with the corresponding values obtained by using the model (Fig. 1), and by analyzing the fit statistics from Table 5. First of all, it is necessary to notice that in all the experiments there is a satisfactory relation between the measurement signal (response) and noise, which is expressed by the values of the Adeq Precision parameter above 4 (Table 5).
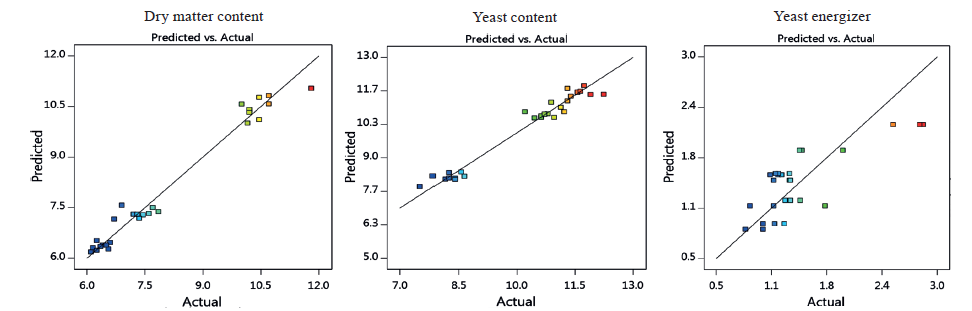
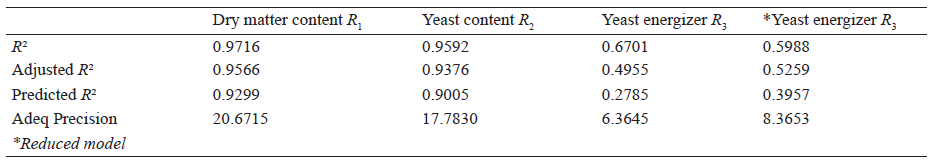
Figure 1 shows that the actual values in all three cases approximate to the values foreseen by the model, i.e. that the individual values are in the vicinity of the ideal line (y = x), and that they are randomly distributed on both sides of the line y = x. This indicates that there is a correlation between the actual values and the values foreseen by the model. This is verified by the high values of the determination coefficient (R2), given in Table 5. The table shows that the R2 values for fitted Eqs. (5) and (6) are higher in comparison with the R2 values of fitted Eq. (7).
However, since all three R2 values are above 0.5, only by observing this indicator, it could be concluded that all three models realistically explain the dependence of the observed responses (R1, R2, and R3) on the independent variables (A, B, C). However, that only applies to Eqs. (6) and (7). The further analysis of the fit statistics from Table 5 shows that a reasonable agreement between the adjusted R2 and the predicted R2 only exists for the case of fitted Eqs. (5) and (6), while it is not the case for Eq. (7), where there is a significant difference between the two parameters.
Specifically, the predicted R2 value (0.2785) is not close enough to the adjusted R2 value (0.4955), i.e. it is higher than 0.2. This indicates the possibility of occurrence of a blocking effect as a result of the conduct of experiments in several blocks (a group of experimental conditions) or a possible problem with the model itself and/or individual data. Given the fact that ANOVA showed for this empirical model that only the members A2 and A2 are statistically significant, it is assumed that the presence of the other members in the model contributes to the above-mentioned problem, and the equation is therefore reduced by excluding the member B, and the members of the interaction AB, AC and BC. The repeated fitting of data from Table 2 resulted in the following equation written in the actual and in the coded form respectively:
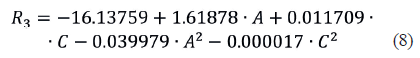
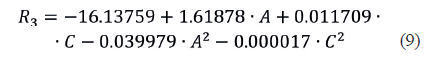
Figure 2 shows the response surface plots which enable an insight into the behavior of the observed dependent variables (responses R1, R2, and R3) to change the independent variables and their possible interaction. The plot A (Fig. 2) shows the effect of different combinations of the initial content of dry matter and yeast on the dry matter content after fermentation at the fixed value of yeast energizer of 320 mg/L. The dry matter content after fermentation increased from 6.4 to 10.1% with an increase in the initial dry matter content from 16.3 to 24.4% at the value of the yeast content of 600 mg/L.

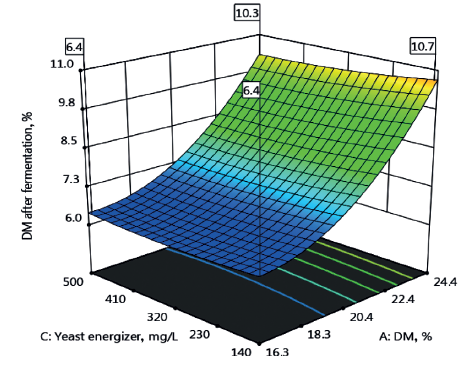
An almost identical increase in the dry matter content after fermentation from 6.2 to 10.7% with the same amount of increase in the dry matter content in the initial raw material was noticed at the value of the yeast content of 150 mg/L. Therefore, it can be concluded that the effect of the yeast content in the initial raw material on the dry matter content after fermentation was negligible in comparison with the dominant effect of the dry matter content in the initial raw material, in the tested range of values of the independent variables.
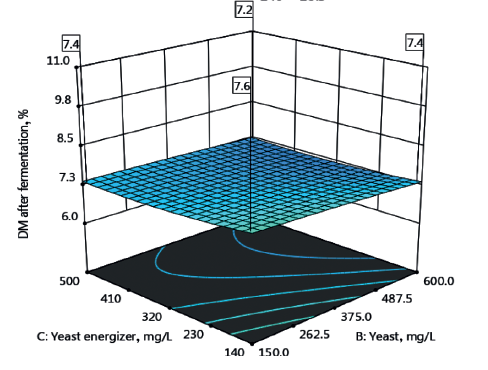
The plot B (Fig. 2) shows the effect of different combinations of the dry matter content and yeast energizer on the dry matter content after fermentation at the fixed value of the yeast content of 375 mg/L. The dry matter content after fermentation increased from 6.4 to 10.3% with an increase in the initial dry matter content from 16.3 to 24.4% at the value of yeast energizer of 500 mg/L. A similar increase in the dry matter content after fermentation from 6.4 to 10.7% with the same amount of increase in the dry matter content in the initial raw material was noticed at the value of yeast energizer of 140 mg/L. Therefore, it is clear that the effect of yeast energizer in the initial raw material on the dry matter content after fermentation was negligible in comparison with the dominant effect of the dry matter content in the initial raw material, in the tested range of values of the independent variables.
Taking into consideration the previous conclusions on the negligible effect of the content of yeast and yeast energizer in the initial raw material on the dry matter content after fermentation, it is expected that different combinations of the two given independent variables do not have an effect on the value of the observed response. This is confirmed by the plot F (Fig. 2), which shows that there is almost no change in the dry matter content after fermentation at different combinations of the given independent variables and at the fixed dry matter content in the initial raw material of 20.35%.
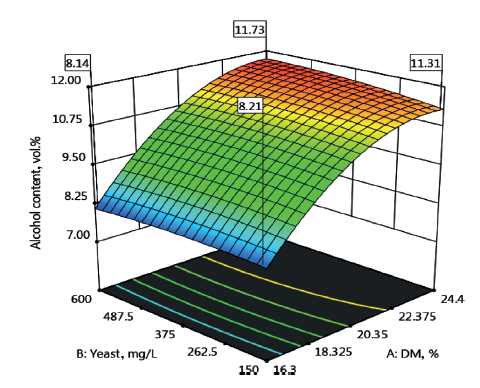
The plot C (Fig. 2) demonstrates the effect of different combinations of the content of dry matter and yeast on the alcohol content after fermentation at the fixed value of yeast energizer of 320 mg/L. The alcohol content after fermentation increased from 8.14 to 11.73% with an increase in the dry matter content from 16.3 to 24.4% at the value of the yeast content of 600 mg/L in the initial raw material. An almost identical increase in the dry matter content after fermentation from 8.21 to 11.31% with the same amount of increase in the dry matter content in the initial raw material was noticed at the value of the yeast content of 150 mg/L. Therefore, it can be concluded that the effect of the yeast content in the initial raw material on the alcohol content after fermentation was negligible in comparison with the dominant effect of the dry matter content in the initial raw material, in the tested range of values of the independent variables.
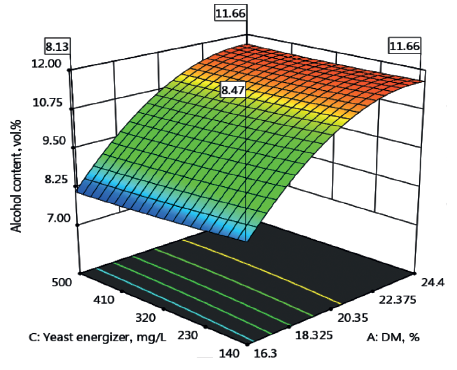
The plot D (Fig. 2) shows the effect of different combinations of the content of dry matter and yeast energizer on the alcohol content after fermentation at the fixed value of the yeast content of 375 mg/L. The alcohol content after fermentation increased from 8.13 to 11.66% with an increase in the dry matter content from 16.3 to 24.4% at the value of yeast energizer of 500 mg/L in the initial raw material. A similar increase in the alcohol content after fermentation from 8.47 to 11.66% with the same amount of increase in the dry matter content in the initial raw material was noticed at the value of yeast energizer of 140 mg/L. Therefore, it can be concluded that the effect of yeast energizer in the initial raw material on the alcohol content after fermentation was negligible in comparison with the dominant effect of the dry matter content in the initial raw material. Taking into consideration this conclusion, as well as the conclusion drawn from the analysis of the plot C, it can be concluded that different combinations of the content of yeast and yeast energizer do not have a significant effect on the alcohol content after fermentation either, similar to the effect on the dry matter content after fermentation as shown in the plot F. To ensure visibility of the work, the corresponding plot is not given in Fig. 2.
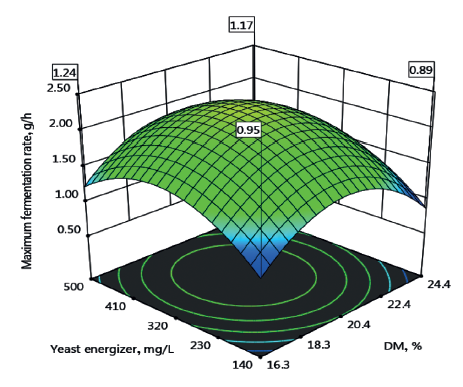
The plot E (Fig. 2) shows the effect of different combinations of the yeast content and the dry matter content in the initial raw material on the maximum fermentation rate at the fixed value of yeast energizer of 375 mg/L. Unlike the previous plots, the effect of both observed independent variables can be clearly noticed here, which was in accordance with the developed model (Eq. (8)), which had two quadratic members. The maximum fermentation rate increased, went through the maximum, and then decreased, at a particular value of yeast energizer in the initial raw material.
A similar trend of a change in the maximum fermentation rate was noticed with a change in the value of yeast energizer in the initial raw material, at a particular value of the dry matter content in the initial raw material. It is obvious that it is possible to select particular combinations of the content of dry matter and yeast energizer in the initial raw material, which would give the maximum alcohol content at the corresponding, i.e. desired values of the fermentation rate and the dry matter content, which was the subject of the optimization study.
Figure 3 shows the results of numerical optimization of the developed mathematical models. According to the defined optimization criteria (Table 3), the optimum conditions were the dry matter content of 24.4%, the content of yeast of 150 mg/L, and yeast energizer of 140 mg/L in the initial raw material. Under such conditions, the alcohol content obtained after fermentation was 11.22% with a moderate fermentation rate of 0.86 g/h.
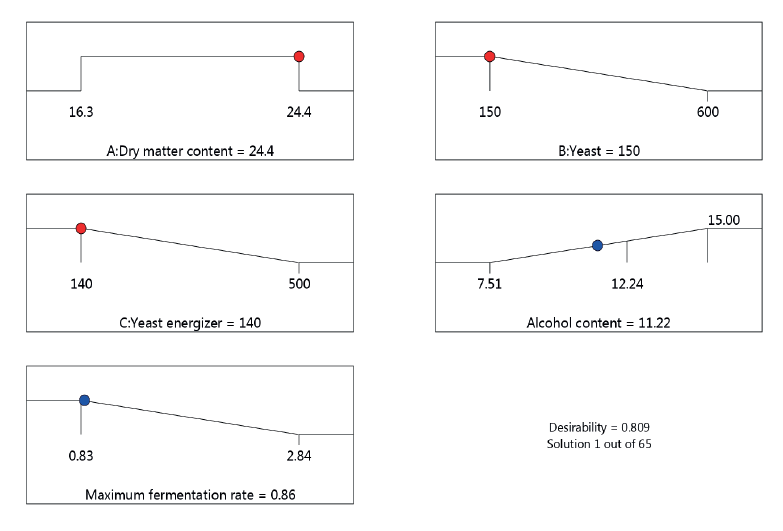
The above-mentioned solution had the highest level of desirability (0.809) among a total of 65 offered solutions. That means that it is possible to select a series of combinations of the minimum content of yeast and yeast energizer in the initial raw material which would enable the maximum yield of alcohol at a moderate fermentation rate, with the dry matter content within the range of the analyzed numeric values.
ВЫВОДЫ
Response surface methodology allowed us to develop empirical mathematical models in the form of second-degree polynomials. The models describe the effect of the initial content of dry matter, yeast, and yeast energizer on the maximum fermentation rate, the alcohol yield, and the dry matter content in the finished product – mead.
The statistical analysis has proved that the initial dry matter content had the statistically significant effect on the content of alcohol and dry mater in the final product. The initial content of yeast and yeast energizer in the tested range of values of the given variable was negligible. The developed mathematical models were used to select optimum fermentation conditions: the dry matter content of 24.4%, the yeast content of 150 mg/L, and the content of yeast energizer of 140 mg/L, in the initial raw material. Under such conditions, the alcohol yield obtained after 20 days of fermentation was 11.22% at a moderate fermentation rate of 0.86 g/h.
Вклад авторов
Saša Papuga, Igor Pećanac, Maja Stojković, Aleksandar Savić, and Ana Velemir conceived and designed the experiments; performed the experiments; contributed reagents, materials, and analytical tools; and wrote the paper. Saša Papuga analyzed the data, developed mathematical models, and performed parameter optimisation.КОНФЛИКТ ИНТЕРЕСОВ
The authors declare no conflict of interest.ФИНАНСИРОВАНИЕ
This study is a result of the research conducted within the Project (19/6-020/961-68/18) financially supported by the Ministry for Scientific and Technological Development, Higher Education and Information Society of the Republic of Srpska.СПИСОК ЛИТЕРАТУРЫ
- Khuri AI. A general overview of response surface methodology. Biometrics and Biostatistics International Journal. 2017;5(3):87–93. https://doi.org/10.15406/bbij.2017.05.00133.
- Response surface designs [Internet]. [cited 2021 Aug 10]. Available from: https://www.statease.com/docs/v12/designs/rsm/#rsm.
- Myers RH, Montgomery DC. Response surface methodology: process and product optimization using designed experiments. New York: Wiley, 1995. 700 p.
- Mumtaz MW, Adnan A, Mukhtar H, Rashid U, Danish M. Biodiesel production through chemical and biochemical transesterification: Trends, technicalities, and future perspectives. In: Rasul MG, Azad Akalam, Sharma SC, ediitors. Clean energy for sustainable development: Comparisons and contrasts of new approaches. Academic Press; 2017, pp. 465–485. https://doi.org/10.1016/B978-0-12-805423-9.00015-6.
- Jang S, Lee AY, Lee AR, Choi G, Kim HK. Optimization of ultrasound-assisted extraction of glycyrrhizic acid from licorice using response surface methodology. Integrative Medicine Research. 2017;6(4):388–394. https://doi.org/10.1016/j.imr.2017.08.003.
- Ghelicha R, Jahannama MR, Abdizadeh H, Torknik FS, Vaezic MR. Central composite design (CCD)-Response surface methodology (RSM) of effective electrospinning parameters on PVP-B-Hf hybrid nanofibrous composites for synthesis of HfB2-based composite nanofibers. Composites Part B: Engineering. 2019;166:527–541. https://doi.org/10.1016/j.compositesb.2019.01.094.
- Şenaras AE. Parameter optimization using the surface response technique in automated guided vehicles. In: Kumar K, Zindani D, Davim P, editors. Sustainable engineering products and manufacturing technologies. Academic Press; 2019. pp. 187–197. https://doi.org/10.1016/B978-0-12-816564-5.00008-6.
- Miladinović MR, Stamenković OS, Banković PT, Milutinović-Nikolić AD, Jovanović DM, Veljković VB. Modeling and optimization of sunflower oil methanolysis over quicklime bits in a packed bed tubular reactor using the response surface methodology. Energy Conversion and Management. 2016;130:25–33. https://doi.org/10.1016/j.enconman.2016.10.020.
- Humbrid D, Fei Q. Scale-up considerations for biofuels. In: Eckert CA, Trinh CT. Biotechnology for biofuel production and optimization. Elseiver; 2016. pp. 513–537. https://doi.org/10.1016/B978-0-444-63475-7.00020-0.
- Schwarz LV, Marcon AR, Delamare APL, Echeverrigaray S. Influence of nitrogen, minerals and vitamins supplementation on honey wine production using response surface methodology. Journal of Apicultural Research. 2020;60(3):57–66. https://doi.org/10.1080/00218839.2020.1793277.
- Srimeena N, Gunasekaran S, Murugesan R. Optimizing process conditions for stingless bee (Melipona irridipennis) mead fermentation using plackett-burman design and response surface methodology. Asian Journal of Chemistry. 2016;28(1):143–150. https://doi.org/10.14233/ajchem.2016.19280.
- Pereira AP, Mendes-Ferreira A, Oliveira JM, Estevinho LM, Mendes-Faia A. High-cell-density fermentation of Saccharomyces cerevisiae for the optimization of mead production. Food Microbiology. 2013;33(1):114–123. https://doi.org/10.1016/j.fm.2012.09.006.
- Gomes T, Barradas C, Dias T, Verdial J, Morais JS, Ramalhos E, et al. Optimization of mead production using Response Surface Methodology. Food and Chemical Toxicology. 2013;59:680–686. https://doi.org/10.1016/j.fct.2013.06.034.
- Chitarrini G, Debiasi L, Stuffer M, Ueberegger E, Zehetner E, Jaeger H, et al. Volatile profile of mead fermenting blossom honey and honeydew honey with or without Ribes nigrum. Molecules. 2020;25(8). https://doi.org/10.3390/molecules25081818.
- Balogu TV, Towobola O. Production and quality analysis of wine from honey and coconut milk blend using Saccharomyces cerevisiae. Fermentation. 2017;3(2). https://doi.org/10.3390/fermentation3020016.
- Adamenko K, Kawa-Rygielska J, Kucharska AZ, Piórecki N. Characteristics of biologically active compounds in Cornelian cherry meads. Molecules. 2018;23(8). https://doi.org/10.3390/molecules23082024.
- Amorim TS, Lopes SDB, Bispo JAC, Bonafe CFS, de Carvalho GBM, Martínez EA. Influence of acerola pulp concentration on mead production by Saccharomyces cerevisiae AWRI 796. LWT. 2018;97:561–569. https://doi.org/10.1016/j.lwt.2018.07.009.
- Savić A, Velemir A, Papuga S, Stojković M. Influence of blackberry juice addition on mead fermentation and quality. Foods and Raw Materials. 2021;9(1):146–152. https://doi.org/10.21603/2308-4057-2021-1-146-152.
- Boyer J, Liu RH. Apple phytochemicals and their health benefits. Nutrition Journal. 2004;3. https://doi.org/10.1186/1475-2891-3-5.
- Compendium of international methods of wine and must analysis. Paris: Organisation Internationale de la Vigne et du Vin Paris; 2021.
- Savić A, Velemir A, Stojković M, Ilić P. Effect of correction of certain parameters of diluted honey on mead production. Proceedings: Conference of Chemists, Technologists and Environmentalists of Republic of Srpska. 2016;11:322–330.
- Martínez AM, Vivas GJ, Quicazán MC. Evaluation of alcoholic fermentation during the production of mead using immobilized cells in kappa-carrageenan. Chemical Engineering Transactions. 2016;49:19–24. https://doi.org/10.3303/CET1649004.
- Sroka P, Tuszyński T. Changes in organic acid contents during mead wort fermentation. Food Chemistry. 2007;104(3):1250–1257. https://doi.org/10.1016/j.foodchem.2007.01.046.
- Martínez-García R, García-Martínez T, Puig-Pujol A, Mauricio JC, Moreno J. Changes in sparkling wine aroma during the second fermentation under CO2 pressure in sealed bottle. Food Chemistry. 2017;237:1030–1040. https://doi.org/10.1016/j.foodchem.2017.06.066.
- Torrea D, Varela C, Ugliano M, Ancin-Azpilicueta C, Francis IL, Henschke PA. Comparison of inorganic and organic nitrogen supplementation of grape juice – Effect on volatile composition and aroma profile of a Chardonnay wine fermented with Saccharomyces cerevisiae yeast. Food Chemistry. 2011;127(3):1072–1083. https://doi.org/10.1016/j.foodchem.2011.01.092.
