

Аннотация
A carbohydrate based fat replacer is the most important constituent used in a large range of bakery products. It exactly minimizes the role of butter, margarine and fat. It also plays a major role in the reduction of obesity. Carbohydrate based fat replacers also effect in terms of physical and chemical properties. The present study was designed to reveal the combined potential of pectin and banana powder as carbohydrate based fat replacers in cookies. The flour was characterized for a proximate analysis (moisture, fat, fiber, protein, ash and NFE). Moreover, carbohydrate based fat replacers (pectin and banana powder) were mixed with flour at different levels (0%, 5%, 10%, 15% and 20%). Fat replacers of different flour containing levels were studied for rheological properties (farinographic) and were used in baked products such as cookies for enhancing their quality characteristics. Moreover, physical and chemical analyses were carried out. Furthermore, the sensory evaluation of cookies was also carried out. The obtained data from each parameter were subjected to an appropriate statistical analysis for determining the level of significance. The results showed that the content of crude fat was 29.82% in the controlled cookies. The fat content was reduced from 29.82% to 17.07% for T3 by using carbohydrate based fat replacers. The current study revealed that the treatment with T3 better attributes to physical, chemical and rheological properties. The results further affirmed that the cookies prepared from wheat flour from 15% supplementation of carbohydrate based fat replacers showed better attributes regarding color and texture and were declared the best by the panelistsКлючевые слова
Cookies, dough rheology, calorific value, sensory evaluationВВЕДЕНИЕ
Fat replacers are used in a variety of products ranged from frozen desserts to a number of bakery products. The most appreciable functions of fat replacers are to control calories and provide important nutrients. Fat replacers provide mostly the same functions of fat. Different types of carbohydrate based replacers are pectin, fibers, gums, maltodextrin, cellulose, modified starches and fruits. These can provide 4 kcal/g of energy. When mixed in water, they provide 1–2 kcal/g of energy. Sometimes they provide zero calories. Moreover, the rheological and pasting properties of bakery products can be changed by mixing different starches with hydrocolloids [1].
Fat replacers of a carbohydrate origin may be obtained from modified starches, different types of gels, thickening agents, emulsifying substances and fruits. The amphiteric properties of emulsion are valuable in some cases and they can deposit fifty percent of fat in food products. These give a sense of good mouth feel, creaminess of fat and flavor. These can also reduce calories while maintaining the original amount of fat [2].
A fat replacer ingredient can be used to provide part or all of the function in the form of fat. Fat alternatives are proficient to produce all or a number of the purposeful characteristics of fat in foods [3].
It is worth mentioning that the alternative term fat replacer means that it is a particular substance having better physical or sensory qualities of fat without any of the undesirable properties of fat. There are some categories of fat substitutes and there is often misunderstanding about how can they act as alternatives of fat or fat mimetic. Fat alternatives act as material intended to replace fat in a product [4].
Carbohydrate based fat replacers are derived from plants, cereals and grains. These ingredients consist both of indigestible and digestible complex carbohydrates. Food industries often utilized microcrystalline cellulose as part of a fat mimetic system. It commonly consists of hydrocolloid starch that can be easily solubilized. Carbohydrate based fat replacers have a wide function and can be used in cakes and cookies. Protein based fat replacers are utilized in baked goods, mayonnaise, butter and cheese. Fat based fat replacers are used mainly in baked goods, salted snacks, confections and cheese [5].
Pectin is one of the most essential polysaccharide which has a lot of applications in pharmaceutical industries, food manufacturing industries and many other industries. The most important function in food industries is that it forms gels in the incidence of lower pH and calcium ions. During gel formation, a lot of interactions are involved, especially that of hydrophobic bonding and hydrogen bonding interactions with calcium ions. There are a lot of other applications of pectin which may include the formation of edible films, act as plasticizers and paper substitutes, etc. It is present in the plant’s cell wall, pomace of apple and orange peels [6].
Banana is a fruit and mostly cultivated in the tropical regions. These are transported to cities, where these would be used as fruit or vegetables. If they are not properly transported and marketed, there are a large number of post-harvest losses. In a diet, they would be used as fruit, which can provide protection against chronic degenerative problems such as obesity and acts as fat replacers in bakery products. There are more than 100 different varieties of banana in the world. Banana belong to the genus Musa and the family Musaceae [7]. The most common edible variety is Musa acuminate. Gros Michel and Red Skins are some other varieties. Musa banana has an origin in Southeastern Asia [8].
Traditional techniques such as the use of skim milk are used as an alternative of whole milk in frozen desserts. Using traditional techniques such as the use of lean meats in frozen entrées, fat may be replaced in food products [9]. Starch is the main source of energy stored in grains, tubers and other plant parts. Starch provides 70–80% of the calories consumed by people all over the world. Besides, being an important element in a human diet and of nutritional value. Starch and modified starches are the raw materials to modify the physical properties of a lot of foods, such as crystallization thickness, retention, adhesion, humidity and stabilizing. Starch and the products derived from starch are also important in numerous nonfood applications such as pharmaceuticals, paper, textile industries, alcohol based fuels and adhesives. Another distinctiveness of starch is that most starch granules are composed of a mixture of two polymers - amylose and amylopectin [10].
The objectives of this study were to discover the combined potential of pectin and banana powder as carbohydrate based fat replacers and their effect on the rheological properties of flour containing different levels of fat replacers and to develop cookies with reduced fat.
ОБЪЕКТЫ И МЕТОДЫ ИССЛЕДОВАНИЯ
Procurement of raw material. The commercial wheat flour (white), pectin, bananas and chemicals were purchased from a local market. The study was carried out at the National Institute of Food Science and Technology, University of Agriculture, Faisalabad.
Drying of banana. Bananas were peeled, dried up to 3–6% moisture and banana powder was formulated for a further study. Drying of banana was carried out by a tray drier dehydrator, Model No. R-5A, Commercial Dehydrator System, Inc. 800-369-4283.
Measurements. Rheological characteristics of white flour with and without the addition of carbohydrate based fat replacers were determined by using Farinograph according to the procedure described in AACC [11] Method No. 54–21.
Farinographic studies. The treatments were run through Brabender Farinograph equipped with a 50 grams bowl of a capacity to evaluate the physical dough behavior of different flour treatments according to (AACC, 2000) Method No. 54–21. The parameter such as water absorption, dough development time, softening of dough, arrival time, departure time, dough stability time and the mixing tolerance index were calculated from the farinograms as described below.
Water absorption. The water absorption capacity of the flour sample was the amount of water required to reach the curve at center, 500 Brabender units (B.U.) line of the graph. It was directly observed from the water level in the burette attach with the apparatus and articulated as percentage.
Dough development time. The dough development time was observed as the time taken by the curve to achieve the point of maximum dough consistency before the first indication of weakening.
Softening of dough. The softening was measured as the difference in BU from the centre of the curve at the peak and the center of the curve after 12 minutes from the peak.
Arrival time. The arrival time was recorded from the farinogram as a difference in time between the point where the top of the curve first intersected the 500 B.U. line and the point where it started.
Departure time. The resistance of the dough to mixing was noted as the time from the addition of water until the top of the curve declined from 500 B.U. line.
Dough stability time. The dough stability time was calculated using the difference of departure time and arrival time, that is (departure time – arrival time = dough stability time).
Mixing tolerance index. The mixing tolerance index value was derived in Brabender Unit (BU) as a difference in the top of the curve at the peak to the top of the curve after 5 minutes from the peak.
Cookies preparation. Cookies formulation contains the following ingredients: wheat flour; water; sugar; vegetable oil; fat replacers combination; baking powder and eggs. Before the current experiment, a trial was conducted to determine the maximum fat replacers mixture level that could be incorporated in the cookies. The fat replacement was done into cookies at 5 levels (0%, 5%, 10%, 15%, and 20%) by replacing amount of oil for the cookies mixture. The cookies were placed into a tray and baked in a preheated oven at 180°C for 10–12 minutes. The cookies from each type of composite flours were prepared according to AACC (2000) Method No. 10–50D with some modifications as followed.
Analysis of cookies
Physical analysis of cookies. The cookies of different treatments were first prepared and then analyzed for their following physical parameters.
Color measurement.The color of cookies of different treatments was determined according to the methods described using Color Meter (Piga et al., 2005) with the help of a hand held tri stimulus colorimeter. The colorimeter was calibrated by using standards (153 CTn for dark and 181 CTn for light). The color of cookies was determined by placing the cookies under the photocell.
Textural analysis.The texture of all the treatment of cookies was determined according to (Piga et al., 2005) by using a texture analyzer (Model. TA-XT2, Stable Microsystems and Surrey, UK) with a 5 kg load cell. The Texture Export Program version 4 was used for data analysis. The textural determinations were made by using a 75 mm Compression Platen (P/75) for a compression test. The treatments samples were positioned centrally with the core at the right angles to the direction of force, on the Petri plates. Once a trigger force of 100 g has been achieved, the compression plate proceeds to move down onto the spread and there is a rapid rise in force. During this stage the sample is deformed under the applied force but there was no apparent breakdown of the product. As the compression distance increased, small peaks were seen on the graph profile, each peak indicating a compressive failure of the sample. This stage ended abruptly when the test was completed and indicated a large decrease in force. The greater the distance, the greater is the ability to withstand compression without sample breakage.
Other physical analysis. Cookies of different treatments were analyzed firstly for their physical parameters after preparation. The diameter/width, thickness and spread factor were determined according to their respective methods described inAACC (2000).
Thickness. To determine the thickness (T), five cookies of same treatment were placed on top of one another. The total height was measured in millimeters with the help of a ruler. This process was repeated thrice to get the average value for each treatment and results were reported in millimeters.
Diameter. To determine the diameter (D), three cookies of the same treatment were placed edge to edge. The total diameter of three cookies was measured in mm by using a ruler. The cookies were then rotated at an angle of 90°С for duplicate reading. This was repeated once more and the average diameter for each treatment was reported in millimeters.
Spread factor. The spread factor for each treatment was determined from the diameter and thickness, with the help of the following formula:
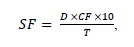
where CF is a correction factor at a constant atmospheric pressure. Its value was 1.0 in this case.
Proximate analysis of cookies. Cookies of different treatments were analyzed for moisture, crude protein, crude fiber and crude fat and total ash by using Methods described in AAAC (2000). The nitrogen free extract (NFE) was calculated using a difference method.
Sensory analysis. The cookies of different treatments were rated using a 9-point hedonic score system (9 = like extremely; 1 = dislike extremely) by a taste panel [12]. They were asked to express their opinion about the final product by giving score to the attributes like aroma, taste, crispness, mouth feel and the overall acceptability. During sensorial evaluation, cookies of different treatments were placed in the transparent plates labeled with random codes. Cold water and crackers were supplied to panelists for rinsing their mouths between the samples.
Statistical analysis. The data obtained for each parameter were subjected to statistical analysis to determine the level of significance according to the method described by [13].
РЕЗУЛЬТАТЫ И ИХ ОБСУЖДЕНИЕ
Rheological studies Farinographic studies. The rheological characteristics of white flour containing different levels of carbohydrate based fat replacers were studied for the parameters such as water absorption, dough development time, dough stability time, the mixing tolerance index and softening of dough by using Brabender Farinograph. The data representing the effects of various levels of carbohydrate based fat replacers on the farinographic characteristics of the dough has been given in Table 1.
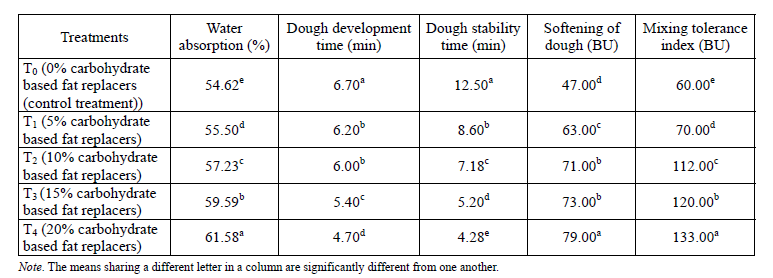
Water absorption. The mean values of the data regarding water absorption for the flour samples containing carbohydrate based fat replacers are presented in Table 1. The data on water absorption indicated that the values significantly differ from each other. It was obvious from the results that the water absorption was higher in T4 (61.58%), followed by T3 (59.59%), T2 (57.23%), T1 (55.50%), T0 (54.62%). The lowest water absorption was observed in T0 (54.62%). The results revealed that the water absorption increased with the addition of carbohydrate based fat replacers. The results representing the water absorption of dough in this study are in conformity with the findings of Azizi and Rao [13] who found out that the percentage of water absorption increases with the addition of carbohydrate based fat replacers. The mentioned results for water absorption of flour are also comparable with the findings of Ahmad [14] who observed an increase in water absorption with the use of carbohydrate based fat replacers.
Dough development time. Dough development time is defined as the time required for the development of gluten. It was found to be in the range of 4.70–6.70 min. The data regarding the analysis of variance for dough development time is shown in Table 1. The present results indicated a highly significant difference among the treatments. The mean values for the dough development time of different treatments of carbohydrate based fat replacers are given in Table 1. The highest value T0 (6.70 min) followed by T4 (4.70 min) was found, T1 (6.20 min) and T3 (5.40 min) while it was for T2 (6.00 min).
The results of this study are in agreement with the findings of Hafeez [16] who observed a decrease in dough development time with the use of carbohydrate based fat replacers. The results are also in concurrence with Asghar et al. [17].
Dough stability time. The data indicate a highly significant difference among the treatments for the dough stability time. The mean values of Table 1 showed that the highest value for dough stability time was observed in T0 (12.50 min) and the lowest value was obtained in T4 (4.28 min) while the mean values for T1, T2, and, T4, were found to be 8.60 min, 7.18 min and 4.28 min respectively. The above findings regarding dough stability time are in close agreement with the results of Ravi et al. (2000) who observed that the addition of carbohydrate based fat replacers affects the dough stability time of different treatments. These results are also comparable with the findings of Asghar et al. [17] who observed an increased dough stability time with the use of carbohydrate based fat replacers. The results of the present study are also in accordance to the findings of Azizi and Rao [13] who observed a decreased dough stability time by the addition of carbohydrate based fat replacers.
Softening of dough. The results indicate that there is a highly significant difference among the treatments. The mean values for softening of dough in Table 1 showed the maximum value for T4 (79.00 BU) and the minimum value for T0 (47.00 BU). The mean values for other treatments were T1 (63.00 BU), T2 (71.00 BU), and T3 (73.00 BU. The mentioned results are in conformity with the findings of Asghar et al. [17] who observed an increased BU value for softening of dough with the use of carbohydrate based fat replacers.
Mixing tolerance index. The results indicate a highly significant difference among treatments for mixing tolerance index. The mean values for the mixing tolerance index are given in Table 1. These results show the highest value for T4 (133.00 BU) followed by T3 (120.00 BU), T2 (112.00 BU), T1 (70.00 BU) and it was lowest for T0 (60.00 BU). The results indicate that the mixing tolerance index increased with the addition of carbohydrate based fat replacers. These results are in conformity with the values as observed by Hafeez [16] who explicated that the mixing tolerance index varies with theaddition of carbohydrate based fat replacers. The current findings are also comparable with the results of Ahmad [14] who observed an increased mixing tolerance index with the addition of carbohydrate based fat replacers.
Measurement of physical characteristics of cookies
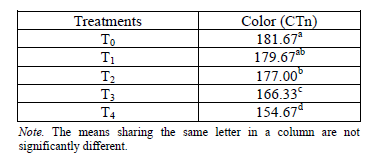
Color determination. The color value was determined by using a color meter. It was first calibrated with the standards having the lower and the upper limits (51–200) respectively. The color value for cookies prepared by using different treatments of white flour supplemented with varying concentrations of carbohydrate based fat replacers. These results indicated a significant difference for color among various treatments. The mean values for color (Table 2) showed that the highest value was observed in T0 (181.67 CTn) and the lowest in T4 (154.67 CTn). The mean values for other treatments were T1 (179.67 CTn), T2 (177.00 CTn) and T3 (166.33 CTn). The above mentioned instrumental color values are in agreement with Abu Ghoush et al. [19]. These observations regarding color are also comparable to the findings of Azizi and Rao [15] who observed that the color of cookies is affected by the addition of carbohydrate based fat replacers.
Cookies texture. Texture of cookies prepared by using various treatments of white flour supplemented with different concentrations of carbohydrate based fat replacers were measured in terms of hardness (firmness) and fracture ability. The hardness (firmness) was calculated in terms of the maximum force (kg) and the fracture ability was determined in terms of distance (mm).
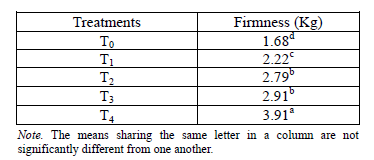
Hardness (Firmness). Hardness can be defined as the peak force during the first compression cycle (first bite). It is the force required to attain the given deformation. The values for the hardness of cookies ranged from 1.68 to 3.91 kg. The data regarding the analysis of variance for hardness are shown in Table 3. The given values for hardness of cookies differ significantly among the treatments. The mean values given in Table 3 indicated the maximum hardness value for T4 (3.91kg) and the minimum value for T0 (1.68 kg) while it showed a significant variation among other treatments. The mean values for T1, T2 and T3 were 2.22 kg, 2.79 kg and 2.91 kg.
The results of the present study regarding the hardness of cookies are in agreement with the observations of Ashwini et al. [20]. Different treatments significantly affect the hardness value of product. The above mentioned values are also similar to the findings of Azizi and Rao [15] who also observed a significant effect on the hardness of product with the addition of carbohydrate based fat replacers.
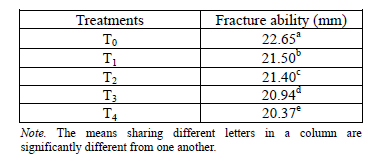
Fracture ability. Fracture ability (also known as brittleness) is a force at a first important break in the curve. As a break is a detectable phenomenon linked to the macro structure of the sample, it is known as changes in the modulation of the curve whose magnitude should be definite. It is the force the material or the product fractures with. These values indicate that there is a significant difference among the treatments for the fracture ability. The mean values for the fracture ability of cookies are given in Table 4. It is obvious from the mean values that the maximum fracture ability was observed in T0 (22.65 mm) followed by T1 (21.50 mm), T2 (21.40 mm), T3 (20.94 mm) and T4 (20.37 mm) while the minimum value for fracture ability was observed in T4 (20.37 mm). The results determined in the present study are similar to the findings of Ashwini et al. [20] who observed a significant change in the fracture ability of cookies by the addition of carbohydrate based fat replacers. These results are also in conformity with Azizi and Rao [15].
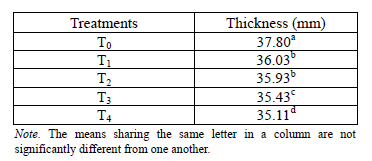
Cookies thickness. The thickness of cookies is affected by various factors such as the quality of flour, the type of ingredients and processing conditions. Thickness should not be too high or too low as it affects crumb grains. If the thickness of a product is too low, it indicates a very compact and closed grain structure whereas too high thickness results in a very accessible grain structure. The thickness of the cookies prepared by using various treatments of carbohydrate based fat replacers was determined using the following methods described in AACC (2000). The data regarding the analysis of variance for thickness is presented in Table 5. The data represented a highly significant difference among the treatments. The mean values for the thickness of cookies given in Table 5 indicated that the maximum value for thickness was observed in T0 (37.80 mm) followed by T1 (36.03 mm) and T2 (35.93 mm), T3 (35.43 mm) and T4 (35.11 mm). The current findings are in concord with Kaur et al. (2000).
Cookies diameter. The diameter of cookies is affected by various factors such as the quality of flour, the type of ingredients and processing conditions. The diameter should not be too high or too low as it affects crumb grains. The diameter of the cookies prepared by using various treatments of carbohydrate based fat replacer was determined using the following methods described in AACC (2000). The data represented a highly significant difference among the treatments. The mean values for the diameter of cookies given in Table 6 indicated that the maximum value for diameter was observed in T4 (151.00 m) followed by T3 (145.00 mm) and T2 (142.67 mm), T1 (139.00 mm) and T0 (134.67 mm). The current findings are in concord with Kaur et al. [21] and Ashwini et al. [20].
Cookies spread factor. The cookies spread factor is affected by various factors such as the quality of flour, the type of ingredients and processing conditions. The spread factor should not be too high or too low as it affects crumb grains. The cookies spread factor prepared by using various treatments of carbohydrate based fat replacers was determined using the following methods described in AACC (2000). The data represented a highly significant difference among the treatments. The mean values for the spread factor of cookies given in Table 7 indicated that the maximum value for the spread factor was observed in T4 (44.26 mm) followed by T3 (41.49 mm), T2 (38.85 mm), T1 (38.57 mm) and T0 (35.62 mm). The current findings are in concord with Kaur et al. [21] and Ashwini et al. [20].

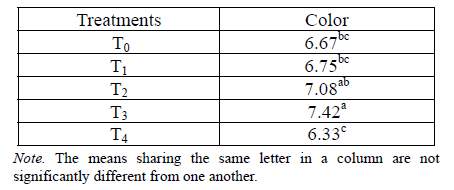
Color. The results revealed that there was a significant variation in the color score for cookies among different treatments. The mean values given in Table 8 indicated that the highest score for color was assigned to the treatments T3 (7.42) while the lowest score (6.33) was given to T4. Similarly, the color score of cookies prepared from T2 and T1 was 7.08 and 6.75. These findings also revealed that the cookies prepared by using carbohydrate based fat replacers from (T0) were 6.67. The results are comparable to the findings of Amerine et al. [22] and Meilgaard et al. [12].
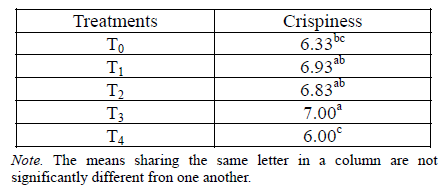
Crispiness. The mean values for this attribute have been presented in Table 9. The highest value for the crispiness score (7.00) was observed for T3 followed by T1 having a crispiness score of 6.93. The current results are in agreement to the findings of Amerine et al. [22]. The lowest moistness score (6.00) was recorded in the cookies prepared from T4 containing 20% fat replacers.
Flavor. It is obvious from the results that the cookies showed a significant difference in flavor by the addition of carbohydrate based fat replacers. The scores for flavor of the cookies presented in Table 10 indicated that the cookies prepared from T2 got the highest scores for flavor (7.08) followed by T3 obtained (6.92) for flavor. The mean scores for the cookies prepared from T0 got 6.33 while T1 and T4 got 6.58 and 6.25 respectively. The current results are also similar to the findings of Amerine et al. [22] who declared that the addition of carbohydrate based fat replacers in any product caused changes in taste, flavor, texture and overall acceptability scores. The current results are also in agreement to the findings of Meilgaard et al. [12].

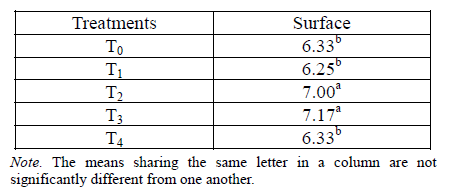
Surface. The addition of carbohydrate based fat replacers significantly affected the surface score of cookies. Mean scores for the surface of cookies showing an effect of carbohydrate based fat replacers has been presented in Table 11. The highest surface score (7.17) was assigned to T3 and followed by T2 (7.00). The results further indicated that T1 cookies got the lowest tenderness score (6.25). The current results are in agreement to the findings of Amerine et al. [22].
Taste. The mean values for this attribute given in Table 12 revealed that the taste scores assigned to cookies supplemented with different concentrations of carbohydrate based fat replacers ranged from 7.08 (T3) to 6.33 (T0). The results further indicated that the cookies prepared were significant regarding their shape scores. The current results are in agreement to the findings of Amerine et al. [22]. The lowest score 6.33 was assigned to the cookies prepared from T4.

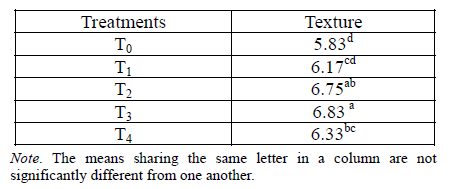
Texture. It was indicated that the texture of cookies was significantly affected by the increasing concentrations of carbohydrate based fat replacers. The mean scores assigned by the panelists to the texture of the cookies prepared from different treatments of carbohydrate based fat replacers are shown in Table 13. These results revealed that the control cookies T0 got the score 5.83 for texture. The cookies prepared from T3 and T2 were considered more acceptable by the panelists regarding the texture scores as 6.83 and 6.75 respectively. The current results are in agreement to the findings of Amerine et al. [22]. The results also revealed that the cookies prepared from all the treatments had significant differences for texture. The results are also comparable to the findings of Meilgaard et al. [12].
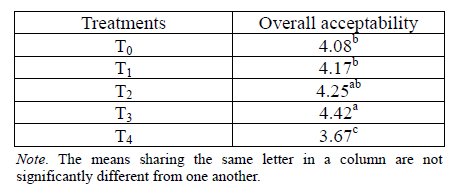
Overall acceptability. It was obvious from the results that the overall acceptability scores of cookies were significantly affected by carbohydrate based fat replacers. The mean values given in Table 14 indicated that the overall acceptability scores of cookies showed a slight variation with the addition of varying concentrations of carbohydrate based fat replacers. The highest score (4.42) for the overall acceptability was assigned to the cookies prepared from T3. The judges slightly disliked the cookies prepared from T4 and assigned the overall acceptability score 3.67. The overall acceptability score 4.25 was assigned to T2 by the panelists. The current results are in agreement to the findings of Amerine et al. [22] regarding the sensory evaluation of cookies for appearance, color, flavor, texture and overall acceptability. The results are also comparable to the findings of Meilgaard et al. [11]. The current results regarding the sensory evaluation of the cookies prepared using different concentrations of carbohydrate based fat replacers revealed that the treatments T3 carbohydrate based fat replacers showed the best results and were assigned maximum scores by the panelists in terms of likeness.
ВЫВОДЫ
The current results regarding the sensory evaluation of cookies prepared using different concentrations of carbohydrate based fat replacers revealed that the treatments T3 carbohydrate based fat replacers showed the best results and were assigned maximum scores by the panelists in terms of likeness.
In conclusion, the results of this study showed that the total phenolic, total flavonoid, rutin and tannin contents are important components in a 50% aqueous ethanol extract of Bulgarian dry leaves of Cichorium intybus L. this plant, and the chicory has some of the pharmacological effects. The results of the present study clearly show that the yield of Cichorium intybus L. rises rapidly with time at first, and then less and less quickly as the progress of extraction continues. The Bulgarian dry leaves of Cichorium intybus L. are an important component providing a protective/preventative health effect.
СПИСОК ЛИТЕРАТУРЫ
- Conforti F.D. and Archilla L. Evaluation of a maltodextrin gel as a partial replacement for fat in a high-ratio white- layer cake. International Journal of Consumer Science, 2001, vol. 25, no. 3, pp. 238-245. DOI: 10.1046/j.1470- 6431.2001.00178.x.
- Min B., Bae I.Y., Lee H.G., et al. Utilization of pectin enriched materials from apple pomace as a fat replacer in a model food system. Bioresource Technology, 2010, vol. 101, no. 5414-5418. DOI: 10.1016/j.biortech.2010.02.022.
- Schwenk N.E. and Guthrie J.F. Trends in marketing and usage of fat-modified foods implications for dietary status and nutrition promotion. Family Economics and Nutrition Review, 1997, vol. 10, pp. 16-32.
- Martin K. Replacing fat, retaining taste. Food Enginery International, 1999, vol. 24, pp. 57-59.
- Duflot P. Starches and sugars glucose polymers as sugar/fat substitutes. Trends in Food Science & Technology, 1996, vol. 7, no. 6, pp. 206-211. DOI: 10.1016/0924-2244(96)81242-8.
- Thakur B.R., Singh R.K., and Handa A.K. Chemistry and uses of pectin: A review. Critical Reviews in Food Science and Nutrition, 1997, vol. 37, pp. 47-73. DOI: 10.1080/10408399709527767.
- Wiese T. and Duffrin M.D. Effects of substituting pawpaw fruit puree for fat on the sensory properties of a plain shortened cake. HortTechnology, 2003, vol. 13, pp. 442-444.
- Rodriguez-Ambriz S.L., Islas-Hernandez J.J., Agama-Acevedo E., et al. Characterization of a fiber rich powder prepared by liquefaction of unripe banana flour. Food Chemistry, 2008, vol. 107, pp. 1515-1521. DOI: 10.1016/j.foodchem.2007.10.007.
- Hsu S.Y., Sun L.Y.Comparisons on 10 non meat protein fat substitutes for low-fat Kung-Wans. Journal of Food Engineering, 2005, vol. 69, no. 1, pp. 47-53. DOI: 10.1016/j.jfoodeng.2005.02.022
- Yang T.H., Jang Y.a, Han J.J., and Rhee J.S. Enzymatic synthesis of low calorie structured lipids in a solvent-free system. Journal of the American Oil Chemists' Society, 2001, vol. 78, no. 3, pp. 291-296. DOI: 10.1007/s11746-001-0259-2.
- Approved Methods of the American Association of Cereal Chemists. 10th Ed. MN American Association of Cereal Chemists, St Paul., USA, 2000. 1200 p.
- Meilgaard M.C., Civile G.V., and Carr B.T. Sensory Evaluation Techniques. 4th Ed. CRC Press. CRC Press, Boca Raton, FL, USA., 2007. 464 p.
- Steel R.G.D., Torrie J.H., and Dickey D. Principles and Procedures of Statistics: A Biometrical Approach. 3rd Ed. Mc-Graw Hill Book Co, Inc., New York, USA, 1997. 666 p.
- Ahmad R. Effect of fat replacement with polydextrose and maltodextrin on dough rheology and biscuit quality on soft dough biscuits. M.Sc. (Hons) Thesis, Faisalabad, Pakistan. 2011. n.p.
- Azizi M.H. and Rao G.V. Effect of surfactant gels on dough rheological characteristics and quality of bread. Journal of Food Quality, 2004, vol. 27, no. 5, pp. 320-336.
- Hafeez Z. Effect of surfactant gels on the functional and keeping quality of bread. M.Sc. (Hons.) Thesis, Faisalabad, Pakistan, 2006. n.p.
- Asghar A., Anjum F.M., Butt M.S., et al. Rheological and storage effect of hydrophilic gums on the quality of frozen dough pizza. Food Science and Technology Research, 2007, vol. 13, pp. 96-102.
- Abozeid W.M.M., Salama M.F., and Moawad R.K. Utilizationof fat replacer in the production of reduced cakes and cookies. Australian Journal of Basic and Applied Sciences, 2011, vol. 5, pp. 2833-2840.
- Abu-Ghoush M., Herald T.J., and Aramouni F. Comparative study of egg white protein and egg alternatives used in an angel food cake system. Journal of Food Processing and Preservation, 2010, vol. 34, pp. 411-425. DOI: 10.1111/j.1745-4549.2008.00284.x.
- Ashwini A.I., Jyotsna R., and Indrani D. Effect of hydrocolloids and emulsifiers on the rheological, microstructural and quality characteristics of eggless cake. Food Hydrocolloids, 2009, vol. 23, pp. 700-707. DOI: 10.1016/j.foodhyd.2008.06.002.
- Kaur A., Singh G., and Kaur H. Studies on the use of emulsifiers and hydrocolloids as fat replacers in baked products. Journal of Food Science and Technology, 2000, vol. 37, no. 3, pp. 250-255.
