Аннотация
The modern trends in the field of food quality management place emphasis on ensuring the traceability and systemic control of the parameters of the life cycle of products. ISO 9000 international standards recommend a process approach for these purposes. Since the standards do not give direct recommendations on the procedure for estimating the effectiveness of the quality management system (QMS), the development of approaches is an extremely urgent task for developers and has a wide application value. The given paper proposes a mathematical model for the complex estimation of the effectiveness of the QMS of a food enterprise. At the first stage, IDEF0 functional modeling methods were used to identify the processes of the life cycle of food products. Then, using the qualimetric approach, 27 unique indices were generated and coefficients were determined for each of them using Fishburn's weight coefficients. To derive a mathematical model for the complex estimation of the effectiveness of QMS processes of a food enterprise, all data were summarized from four levels of the hierarchy. The proposed mathematical model includes the quantitative and qualitative estimation of enterprise processes. The estimation indicators form a treelike hierarchy in which the factors of each sublevel have their own weight coefficients and are in preference or indifference relation to each other. The application of a mathematical model for the complex estimation of the effectiveness of QMS of a food or processing enterprise allows full compliance with the requirements of international standards, but does not require significant financial costs for implementation.Ключевые слова
Quality management system, effectiveness, food enterprise, process approachВВЕДЕНИЕ
In June 2016, the Government of the Russian Federation approved the Strategy for improving the quality of food products in the Russian Federation until 2030, one of the clauses of which states that "in order to ensure the quality of food products at all the stages of their life cycle, quality management systems should be introduced in food manufacture and processing organizations" [1]. Thus, the development and implementation of quality systems have become one of the top priorities of the heads of processing and food enterprises.
According to the international standard ISO 9001 : 2015 [2], the quality management system should be based on the application of the process approach and the Deming cycle: "Plan – Do – Check – Act" (PDCA), because it is this approach that allows an organization to plan its processes and their interaction.
At present, procedures for identifying and simulating the processes of various industrial enterprises have already been studied and developed [3, 4], which make it possible to make a complex analysis for all the stages of the product life cycle and form a visual structure of an organization, which is the first and most important stage in the construction of a quality management system. But a lot of developers have difficulties at the stage of estimating the effectiveness of these processes since there is no single approach and methodological recommendations for accomplishing this task. Along with this, the organizations that already have certified QMS often face the problem of estimating the effectiveness of process improvement, which is one of the basic principles of quality management and an inherent condition for the correct functioning of a system. There is the same problem when integrating a quality management system into a security management system taking into account the requirements of 9000 and 22000 international standards, which is especially characteristic for food production [5].
The approaches to estimating the effectiveness of the quality management system of an enterprise that are available in the domestic [6, 7] and world practice [8–11] do not often take into account the specifics of food enterprises and do not affect all the stages of a product life cycle. At the same time, such factors as the sanitary state of production, a wide range of products, multistage processing lines and short production terms significantly affect the structure and characteristics of a quality management system.
The study aimed at forming a mathematical model of the integrated estimation of the effectiveness of processes of the quality management system of a food enterprise
ОБЪЕКТЫ И МЕТОДЫ ИССЛЕДОВАНИЯ
The object of the study was a procedure for estimating the effectiveness of processes of a food product life cycle using the example of the analysis and study of a low-capacity meat-processing plant in Moscow.
Creating a treelike hierarchy. When creating a treelike hierarchy we guided by a number of principles [12]. First, the overall indicator is considered as a certain hierarchical set of properties; secondly, different scales for measuring the single indicators of properties of an object should be unified in a scale with a uniform dimension, i.e. the transformation of scales was carried out; thirdly, any property at each of the levels should be characterized by two measurable parameters: a single property indicator and its weight coefficient, and, fourthly, the sum of weight coefficients of properties of one level of the hierarchy must be predetermined and constant:
![]()
Fishburn's weight coefficient system. To determine the weight coefficients, Fishburn's weight system was used, which only provides the knowledge of a degree of preference of some indicators to others. One indicator may express strong preference, a preference-indifference relation or indifference relative to another [13]. A set of scales decreasing by the arithmetic progression rule corresponds best to this system of decreasing alternative preference:
![]()
where pi is the weight coefficient of importance of the i-th factor; i is the number of the current factor; N is the total number of factors.
A set of equal weights best corresponds to the system of indifferent alternatives:
![]()
The choice of Fishburn's weight coefficients is due to the fact that Fishburn's weights are rational fractions, the numerator of which contains the units of a natural series decreasing by 1 from N to 1, for example, 4/9, 3/9, 2/9, forming one in sum, and the denominator contains the sum of the arithmetic progression of the first terms of a natural series at a pitch of 1. Thus, the preference is expressed in a decrease in the rational weight coefficient fraction numerator of the weakest of the alternatives by one.
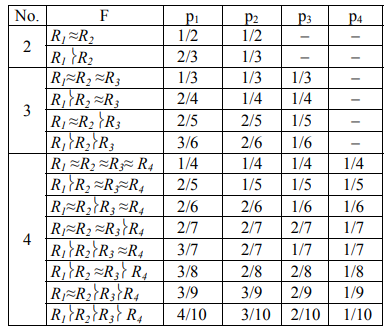
Below are Fishburn's fractions for all the mixed systems of preference relations for two, three and four single indicators (Table 1).
Obtaining the rankings. The series of preferences were created using the sequential comparison method. The preference of Object A before B is denoted as A>B. The equality of objects from the point of view of the level of the quality estimated by the expert was reflected as "indifference" and it was designated as A~B. A series is fully ordered in the case when there is no sign of "indifference" therein, and partially ordered if there is the given sign there.
The order of ranking was as follows: the experts compared two independent objects A and B, while obtaining the result A ‹ B or B>A. Each successive object C was alternately compared to each of the elements of the already formed series, beginning with the first one. The process was repeated until a more preferable object was found to the left of the compared object, and a less preferable object – to the right. Then the compared object C is put in the ranking between the specified objects. After the comparison of all the objects A, B, C, D, E a series of preferences, say, A> B> C> D> E, is obtained.
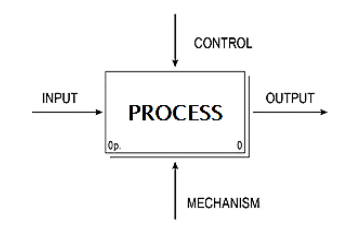
Functional modeling methods. The study used the methods of IDEF0 functional modeling [14]. The notation IDEF0 allowed to show processes as a composition of functional blocks that are graphically a set of rectangles and arrows (Fig. 1).
The functional model is a set of blocks with "inputs" and "outputs", resources and control actions which are detailed to the required level. Decomposition allows us to study each process of the product life cycle without detaching from the higher processes, but with sufficient detail. A process or operation is represented as a quadrilateral, each interaction with other processes or the environment – in the form of an arrow. The arrows in the IDEF0 notation have several meanings: an administrative impact, resources or mechanisms, inputs and outputs are among them.
At the upper level, each process is represented as a "black box" that converts the inputs into outputs. This definition almost completely coincides with the definition of the process laid down in the standard ISO 9000 : 2015 [15], so that the IDEF0 notation is widely used in modeling production processes [16, 17].
РЕЗУЛЬТАТЫ И ИХ ОБСУЖДЕНИЕ
Processes identification. At the first stage of the study, the processes of a product life cycle were identified, aimed at defining and forming the organization structure, because the incorrect modeling and identification of processes lead to the creation of a heavy and unmanageable system. In addition, when developing QMS, it is important to determine the processes of exactly the level the management of which will be most rational and effective.
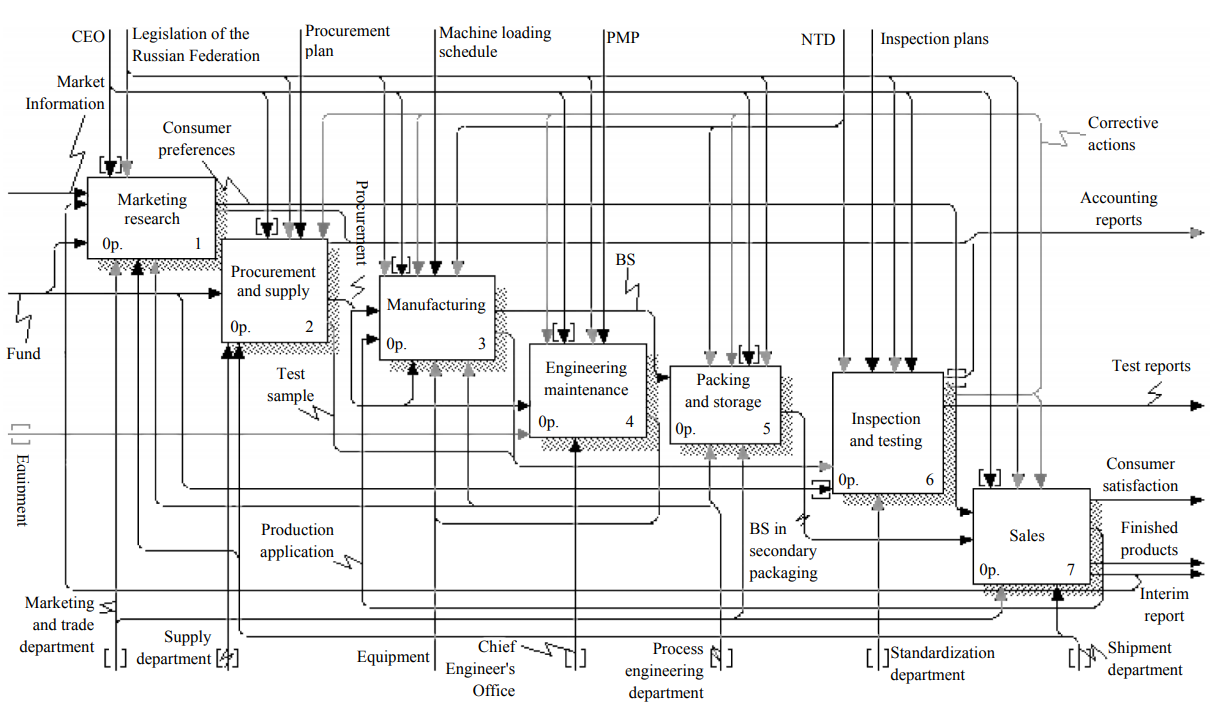
Process structures of three levels were modeled using the IDEF0 notation: A0 is the highest level without detail, A1 is the level with the details of processes of a product life cycle (Fig. 2), A2 is the level of details of each of the 7 processes of Diagram A1: marketing research, procurement and supply, production, engineering maintenance, packaging and storage, inspection, verification, testing and implementation. In addition, based on the identification principles [19], the processes not included in Diagram A1 were identified: Process A8 – launching products into manufacture and Process A9 – product conformity estimation.
Formation of a mathematical model. To estimate the effectiveness of QMS processes, the qualitative methods were used, which resulted in the generation of individual performance indicators, formulas for determining the values of these indicators were developed and scoring scales for their unification were determined. When forming the scoring scales, the range each criterion is within was revealed, while the maximum number of points was given to the best criterion value [20].
For the further formation of a complex performance indicator, the single indicators, which are a set of unordered factors, were to be systematized, and weight coefficients in order of the significance of each of the indicators were to be fixed. Fishburn's weight system was used to determine the weight coefficients of the single indicators.
A mathematical model was developed for estimating the effectiveness of the quality system called the EP model:
![]()
where H is the treelike hierarchy of performance indicators; S is the score scale of single indicators in the hierarchy, scores; F is the system of preferences relations of some indicators to others of the same level in the hierarchy. Whereby:

where } is a preference relation and ≈ is an indifference relation.
The proposed model described the tree hierarchy H using a direct acyclic graph without horizontal edges and loops within one comparison series with a common root vertex:
![]()
The arcs were arranged as follows in the treelike
graph: the vertex of the lower rank corresponds to the
beginning of the arc, and the vertex of the next level of
the hierarchy, which is one less than the previous one,
corresponds to the end of the arc. To estimate the
effectiveness of the quality management system in
accordance with identification and decomposition, the
resulting process hierarchy was presented in the form
of a treelike graph (Fig. 3) with a description:
Н= < {R0 is the effectiveness of QMS processes;
R1– basic processes;
R2 – management processes;
R3 – secondary processes;
R1.1 – marketing processes;
R1.2 – production processes;
R1.3 – a packaging and storage process;
R1.4 – an implementation process;
R1.5 – launching new products into manufacture;
R1.6R1.6 – a conformity esrtimation process;
R2.1 – a control and testing process;
R3.1 – a procurement and supply process;
R3.2 – an engineering equipment maintenance process;
R1.1.1 – a sales growth indicator;
R1.1.2 – an assortment indicator;
R1.1.3 – a brand popularity indicator;
R1.2.1 – a product quality indicator;
R1.2.2 – an output indicator;
R1.2.3 – an output terms indicator;
R1.2.4 – production process statistical controllability;
R1.3.1 – a packaging quality indicator;
R1.3.2 – a labeling quality indicator;
R1.3.3 – an order formation indicator;
R1.4.1 – a delivery terms indicator;
R1.4.2 – a sold output assortment indicator;
R1.4.3 – a sold output indicator;
R1.5.1 – a pilot lot deficiency amount indicator;
R1.5.2 – a labeling timeliness indicator;
R1.6.1 – a permitting documents preparation timeliness
indicator;
R1.6.2 – a permitting documents preparation correctness
indicator;
R2.1.1 – a sampling schedule compliance indicator;
R2.2.2 – a test parameter number indicator;
R2.2.3– an indicator of absence of performers' mistakes
when testing samples;
R2.2.4 – an indicator of timeliness of corrective actions
formation;
R3.1.1 – a procurement terms indicator;
R3.1.2 – a procurement volume indicator;
R3.1.3 – a procurement quality indicator;
R3.2.1 – a work schedule compliance indicator;
R3.2.2 – a repair quality indicator;
R3.2.3– a repair time indicator};
{the vertex connection in the graph is shown as the
enumeration of the vertices in accordance with the
hierarchy level taken by the vertex}>.
The next stage of the study was the formation of the system of preference / indifference relations between single indicators, which was carried out through the analysis of the results of expert estimation [21]. A number of diagrams of processes in the IDEF 0 notation and the hierarchy of single indicators of QMS process effectiveness were offered to the experts. The expert group estimated the importance of each of the group of single indicators of the Rijklevel, then the combined Rij level indicators and, in the end, the importance of each group of processes Ri. During the open meeting of the experts, the series of preferences were formed using the sequential comparison method which became the basis for the relation system F:

Based on the obtained system of relations F, the weight coefficients aijk were determined for the single indicators within each level of processes. The complex estimation of the effectiveness of the quality management system was presented in the form of a four-level hierarchical set of the indicators Ri, Rij, Rijk and the weight coefficients ai, aij, aijk. (Fig. 4), the sum of which is constant and equal to one at each level.
To derive a formula for the complex estimation of QMS effectiveness of a food enterprise, data were aggregated at the next stage. At the same time, the processes of all levels of the hierarchy, expressed by the values of the parameters Ri, Rij, Rijk, and their order relations at the same level of the hierarchy, were taken into account in accordance with the assigned weight coefficients ai, aij, aijk. The result of aggregation of the data is the formula:

Using the proposed mathematical model for the qualitative and quantitative estimation of the effectiveness of quality management systems of a food or processing enterprise allows us to comply with the requirements of international standards in full, using the current production information as the initial data. To ensure the quality management principle – constant improvement – and to analyze the performance dynamics, a formula was proposed for calculating the total deviation of the current value from the planned one:

where Ri and Ri' are the current and the planned value of a performance indicator, respectively. The deviation indicator of the current value dR makes it possible to control the degree of achievement of the planned level of effectiveness and, if necessary, to provide corrective actions.
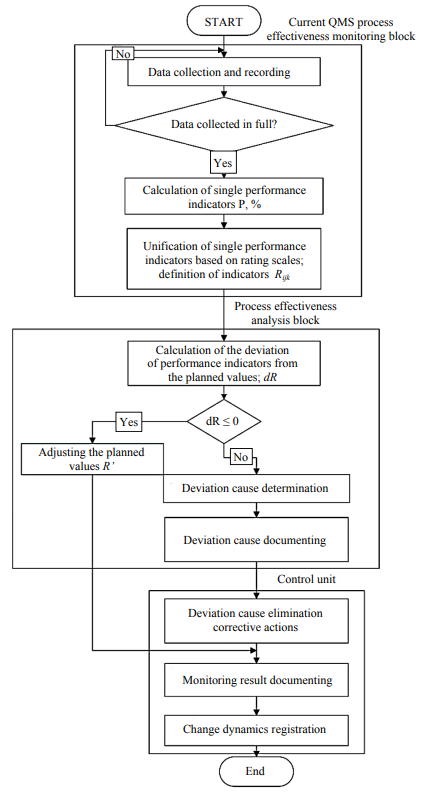
Development of an algorithm for estimating the effectiveness of quality management systems. The final stage of the study was the development of an algorithm for monitoring and estimating the effectiveness of QMS processes. The algorithm allows us to monitor systematically a change in the effectiveness of processes, to determine deviations from the planned values and identify the causes of these deviations (Fig. 5).
The algorithm includes three successively interconnected functional blocks: a monitoring block for the current effectiveness of processes of the quality management system, a process performance analysis block and an input control block. In the first block, data are collected and processed to estimate the state of processes, in the second – the calculation of the deviation of the current value dR, and in the third – the formation of corrective actions or the correction of the planned values, as well as documenting the results of performance monitoring.
ВЫВОДЫ
Forming a process model is a complex task that requires special methods and tools to solve. The use of the IDEF0 notation is considered by a lot of authors to be an obsolete tool, however, in our opinion, this is not so [19, 20]. When identifying processes of various levels, the use of IDEF0 functional modeling remains a very convenient and effective tool for displaying processes of various levels and their connections. In addition, the ideology of this approach is almost completely identical to the requirements of ISO 9000 international standards, which sufficiently makes the work of QMS developers easy.
The approach proposed by the study was tested in practice when developing a quality management system for a low-capacity meat-processing plant (Table 2). In estimating the effectiveness of the quality management system, the actual value of the single indicators was first determined, then, using Formula 5, the complex effectiveness of QMS processes was determined, the deviation from the achievement of the planned value was calculated using Formula 8. The obtained data contributed to the estimation of the success of a process approach for an enterprise and the correction of further improvement actions. The methods described in the study have been included in the organization standard STO "Methods for estimating the effectiveness of the life cycle processes of boiled sausages".
Activities for the production of boiled sausages" "}
A further activity area is the adaptation of the proposed methods to other enterprises taking into account branch specificity, as well as the development of a complex indicator of the estimation of the integrated quality and safety systems.
The study identifies the processes of the quality management system of a food enterprise. All the processes are divided into 3 levels, each of which is subordinate to the superior. There are 9 processes at the lower level: marketing research; procurement and supply; production; engineering maintenance; packing and storage; inspection, verification, testing; implementation; launching new products into manufacture; product conformity estimation. A mathematical model for estimating the effectiveness of processes has been developed, including a treelike hierarchy, a scale for estimating single indicators and a system of relations of preference of some indicators to others for the same level of the hierarchy. Formulae for calculating the QMS performance indicator F0 and the total deviation from the planned value dF have been developed. The data obtained have been summarized as an algorithm for estimating the effectiveness of the quality management system of a food enterprise.
СПИСОК ЛИТЕРАТУРЫ
- Strategiya povysheniya kachestva pishchevoy produktsii v Rossiyskoy Federatsii do 2030 goda: utv. rasporyazheniyem Pravitel’stva RF ot 29 iyunya 2016 g. № 1364-r. [The Strategy of Food Quality Improvement in the Russian Federation by 2030: (Government Decree No 1364-r of June 29, 2016)].
- International Standard ISO 9001:2015 Quality management systems. Requirements. Geneva: ISO, 2015. 29 p.
- Chen Hsiang Ru and Cheng Bor‐Wen. Applying the ISO 9001 process approach and service blueprint to hospital management systems. The TQM Journal, 2012, vol. 24, no. 5, pp. 418–432. DOI: 10.1108/ 17542731211261575.
- Leonov O.A., Bondareva G.I., Shkaruba N.Zh., and Vergazova Yu.G. Razrabotka sistemy menedzhmenta kachestva dlya predpriyatiy tekhnicheskogo servisa [Development of a quality management system for technical service enterprises]. Moscow: RSAU – MAA named after K.A. Timiryazev Publ., 2016. 161 p. DOI: 10.18413/2408-9346- 2017-3-2-42-50.
- Zelenskaya A.S. and Kuptsova S.V. On integration of requirements for quality and safety of products. Competence, 2011, no. 1, pp. 37–39. (In Russian).
- Goryachev V.V. Is it acceptable to compare QMS effectiveness of different enterprises? Methods of quality management, 2012, no. 7, pp. 15–21. (In Russian).
- Salimova T.A. and Voronova E.K. Effectiveness of the organization's activity from the position of quality management. Standards and quality, 2015, no. 7, pp. 90–94. (In Russian).
- Beckmerhagen I.A., Berg H.P., Karapetrovic S.V., and Willborn W.O. On the effectiveness of quality management system audits. The TQM Magazine, 2004, vol. 16, no. 1, pp. 14–25. DOI: 10.1108/09544780410511443.
- Psomas E.L., Pantouvakis A., and Kafetzopoulos D.P. The impact of ISO 9001 effectiveness on the performance of service companies. Managing Service Quality: An International Journal, 2013, vol. 23, no. 2, pp. 149–164. DOI: 10.1108/09604521311303426.
- Sundqvist E., Backlund F., and Chronéer D. What is project efficiency and effectiveness? Procedia – Social and Behavioral Sciences, 2014, vol. 119, pp. 278–287. DOI: 10.1016/j.sbspro.2014.03.032.
- Sumaedi S. and Yarmen M. The Effectiveness of ISO 9001 Implementation in Food Manufacturing Companies: A Proposed Measurement Instrument. Procedia Food Science, 2015, vol. 3, pp. 436–444. DOI: 10.1108/17410381311287481.
- Dunchenko N.I. and Yankovskaya V.S. Kvalimetriya [Qualimetry]. Moscow: RSAU – MAA named after K.A. Timiryazev Publ., 2016. 138 p.
- Miljković B., Žižović M.R., Petojević A., and Damljanović N. New Weighted Sum Model. Filomat,2017, vol. 31, no. 10, pp. 2991–2998.
- Repin V.V. and Eliferov V.G. Protsessnyypodkhod k upravleniyu. Modelirovaniebiznes-protsessov [Process approach to management. Modeling of business processes]. Moscow: Mann, Ivanov and Ferber Publ., 2013. 544 p.
- International Standard ISO 9000:2015 Quality management systems – Fundamentals and vocabulary. Geneva: ISO, 2015. 52 p.
- Usakov A.A. and Zhukova A.G. The approach to assessing the complexity of the sadt diagrams (IDEF0). Software products and systems, 2015, no. 1, pp. 34–37. (In Russian). DOI: 10.15827/0236-235X.109.034-037.
- Shilkina A.T. Modeling of formation of permanent improvement system based on methodology of functional modeling IDEF0. Bulletin of the Volga University named after V.N. Tatishchev, 2011, no. 22, pp. 91–97. (In Russian).
- Voloshina E.S. and Dunchenko N.I. Measurement of Quality Management System performance in meat processing. Theory and practice of meat processing, 2017, vol. 2, pp. 21–30. DOI: 10.21323/2414-438X-2017-2-3-21-30.
- Zimovets O.A. and Matrin S.I. Chart view in notation DFD, IDEF0 and BPMN using system-object model "Unitfunction- object". Belgorod State University Scientific Bulletin. Series: Economics, Computer Science, 2011, vol. 20, no. 19–1 (114), pp. 127–137. (In Russian).
- Zanni M.-A., Soetanto R., and Ruikar K. Defining the sustainable building design process: methods for BIM execution planning in the UK. International Journal of Energy Sector Management, 2014, vol. 8, no. 4, pp. 562–587. DOI: 10.1108/IJESM-04-2014-0005.


