

Аннотация
To develop processing lines, it is necessary to calculate the level of integrity of technological systems and determine the stability of subsystems at a certain level of stability. The complex analysis allows us to study a change in the entropy of the system (the growth of system stability) by describing the mechanism of structural information accumulation. Identifying the ranges of variation of adjustable operating parameters using the proposed approach for energy and resource saving and predicting the stability of the line at the design stage, reducing the subjectivity of estimation of technologies and their hardware design, is original and, in this regard, relevant. The studies were conducted to justify the estimation of the stability of the technological flow as a system and its subsystems in their interconnection at a certain level of stability using the method for estimating fuzzy entropy on the basis of analysis of material and technical flows. The study objects are the integrity of technological and technical systems, the stability of processes, operations and equipment operation. As a result of the analysis of technological flows and a change in the entropy of the technical system, the mechanism of accumulation of structural information entropy has been studied. The carried out analytical and experimental studies have confirmed the possibility of predicting the stability of the operation of technical and technological systems, as well as the expediency of determining the ranges of variation in the parameters of operation of the lines, technological limits and the quality indicators of the finished and semi-finished products. Thus, this method is recommended for use in the food industry.Ключевые слова
Theory of technological flow, system analysis, entropy, stability of technological systems, energy and resource savingВВЕДЕНИЕ
The progressive development of processing lines is due to the calculation of the level of integrity of the existing technological systems by experimentally determining the stability of the specific subsystems that have been established at a certain level of stability [1, 2, 6, 8]. The concept of stability of a subsystem (the level of its organization or integrity) has a broader meaning in comparison with the stability that characterizes the quality of functioning of a system.
The known methods for analyzing complex technological flows are only related to the use of information entropy to estimate the efficiency of the existing processing lines in order to modernize them and do not allow us to use system approaches in their design and layout, which leads to the subjectivity of estimation of technologies and their hardware design. It is possible to solve the situation by predicting the stability of operation of technical and technological subsystems and systems as a whole on the basis of making out material and energy balances to minimize energy and material losses. In addition, it is reasonable to determine the ranges of variation in the parameters of the operation of lines, technological limits and the quality indicators of the finished and semi-finished products. At the same time, the systemic complex analysis of technological flows can be carried out on the basis of studying the process of a change in the entropy of a technical system (the growth of system stability) by describing the processes of accumulation of the structural information calculated as the difference between the maximum and the real value of fuzzy entropy.
ОБЪЕКТЫ И МЕТОДЫ ИССЛЕДОВАНИЯ
The objects of the study are the integrity of technological and technical systems in general and their subsystems and the stability of their operation, that is, specific technologies, processes, operations and equipment items. The studies were carried out using the physico-mathematical methods of entropy estimation of the stability of a technological flow as a system and its subsystems in their interconnection at a certain level of stability.
An original method for assessing the integrity and stability of technological systems has been used based on the concept of fuzzy entropy [3, 7, 9, 10, 11] in analyzing material and technical flows for energy and resource saving purposes.
РЕЗУЛЬТАТЫ И ИХ ОБСУЖДЕНИЕ
One of the characteristics of the stability of subsystems is an entropy information function:
![]()
In fact, I, which is called information entropy, is the measure of ignorance or the information obtained when solving a task. This suggests that the quantitative estimation of information and entropy S is analogous according to Boltzmann, because by equating the factor K and the Boltzmann constant kB, a natural logarithm can be used.
For the existing technological flows, the method for calculating the integrity level is recommended [4, 5, 7, 10], which is based on the analogy of determination of information and thermodynamic entropies due to their additivity and the properties characteristic only thereof [8, 9]. The definitions of entropy function and information entropy are often identical, i.e. µi are characterized by a probability measure defined as a set ( P ii= 1,2,...) . The entropy function is determined by the equation:
Then the entropy function is determined from the characteristic:
![]()
For 2 possible results, the a priori probability of an event is determined using the equation:
![]()
This indicates that entropy varies from zero to maximum, moreover, there is a zero value with P = 0 and P = 1, when the distribution is insignificant and there is no uncertainty in the system. The entropy becomes maximum in the case of the equal probability of separate observations ( P = 0.5) , and the distribution is totally uncertain:
![]()
To calculate the entropy function for the process, the control parameters that affect the subsequent subsystem and the entire system should be distinguished in each of the subsystems using expert estimates. In subsystems, along with a number of control parameters, the weight coefficient of each of them is determined using expert estimates.
The basic, as well as the allowable values of the parameters that correspond to their requirements are chosen from standards, technical specifications, process instructions, etc. Then, the standard value of the complex quality indicator is calculated within the range from 0 to 1. Within a certain time interval, testing is carried out fixing the values of the parameters for a given interval in the stationary mode of operation of the equipment.
The concept of process stability is applicable to study the qualitative and quantitative variability of the study object. With the system analysis of a quality change, the task is simplified, because the boundary of two intervals is determined, the properties of the entire set of samples that satisfy and do not satisfy the standard requirements can be split into. The study of the quantitative estimation of the variability of products requires the determination of the range boundaries, if they are not provided in the regulatory and technical documentation.
Summarizing, we note that the stability of the
subsystem can be estimated using the indicator
![]() where ŋi and Hi are,
respectively, the stability and entropy of the i-th
subsystem, which in the case of a binary subsystem
with 2 possible regime process states related to certain
parameters is significant for the subsequent subsystem.
This method is applicable for the growth of stability of
a lot of technologies of animal and vegetable products.
The analysis of the existing technologies of yogurt
products and preparation of tobacco is given below as
an example [7, 10].
where ŋi and Hi are,
respectively, the stability and entropy of the i-th
subsystem, which in the case of a binary subsystem
with 2 possible regime process states related to certain
parameters is significant for the subsequent subsystem.
This method is applicable for the growth of stability of
a lot of technologies of animal and vegetable products.
The analysis of the existing technologies of yogurt
products and preparation of tobacco is given below as
an example [7, 10].
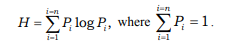
In the 1st case, the processing chain was divided into 4 subsystems: A – milk standardization and compounding a mixture; B – processing a mixture and preparing a starter; C – forming a ready clot; D – packaging and cooling the finished product. As a result, the characteristics of the subsystems presented in Table 1 ( Pi is the probability of yield of a product of a standard complex quality level from the subsystem) were obtained.
In this case, the integrity level is -0.8882. The characteristic curves that connect the averaged stability of subsystems, their number in the system and the level of its integrity have been plotted in [7]. It has been established based on the characteristics obtained that the integrity level of the technological flow considered in the example is low and is in the area of cumulative systems, which leads to the need to change the existing technologies and their hardware.
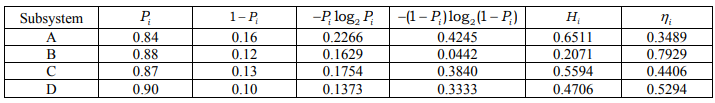
In the second case [10], the technology was divided into three subsystems: A – the preparation of cut tobacco for the production of cigarettes; B – cutting tobacco; C – the formation of leaf tobacco of various commercial varieties. As a result of the calculations, the characteristics of the subsystems presented in Table 2 (Pi is the probability of yield of a product of a standard complex quality level from the subsystem) were also obtained.
The integrity level for the given production system is 0.22; 0.12; 0.09. As it can be seen from the calculations, the levels of integrity of the technological system under study in all time intervals have positive values and range from 0.09 to 0.22, and therefore one can conclude about the integrity of its nature.
It should be noted that the above method is related to the narrow use of only information entropy for the system analysis of complex technological flows, which leads to the possibility of estimating the efficiency of the existing processing lines for their modernization and does not allow us to use system approaches in their development, arrangement and final designing. This disadvantage that leads to the subjectivity of estimation of the existing technological flows can be eliminated by predicting the stability of subsystems and the system as a whole based on making out material and energy balances to determine energy costs and material losses. In addition, it is reasonable to determine the ranges of variation in the parameters of the operation of the lines, technological limits and the quality indicators of the finished and semi-finished products that can be obtained by comparing the calculated and empirical estimates to correlate the obtained data. Herewith, the process of a change in the entropy of a technical system (the growth of system stability) can be described by the process of accumulation of the structural information calculated as the difference between the maximum and the real value of fuzzy entropy.
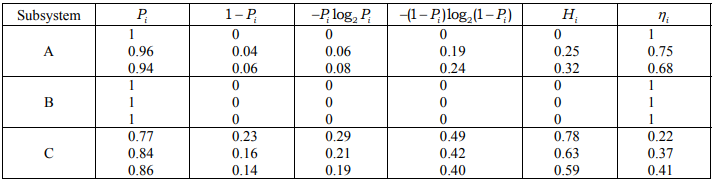
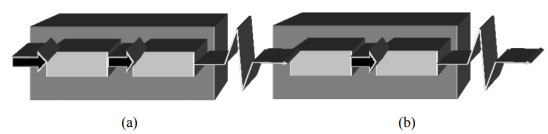
The structure of the flow is determined by connections between its separate operations. Any technological flow can be referred to one of three types: with a rigid, semi-rigid and with a non-rigid connection [1, 8]. In the flows with a semi-rigid and especially a non-rigid (flexible) connection, a "softer" production organization is allowed, which is due to imperfect technologies, the unstable properties of raw materials and semi-finished products, lack of machines with the required technical characteristics, various technological reliability of operations and constructive reliability of machines, etc. Taking into account the fact that there are mainly flows with a semi-rigid connection organized in the food enterprises of the most diverse sectors [7, 10, 13–18], let us describe for clarity a technological system that consists of three subsystems A, B and C with a semirigid connection (Fig.1).
The concept of process stability can be used to study the qualitative and quantitative variability of a product obtained as a result of a process. When studying the qualitative variability of the entire set of samples, the problem is simplified, since it is enough to determine the boundaries of two intervals that satisfy and do not satisfy the requirements of a standard. In this case, the system analysis of the aggregate of material and energy losses when the product goes through subsystems A, B and C is of interest.
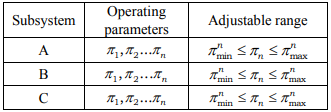
The theoretical and experimental studies of technology subsystems are related to the determination of the adjustable operating parameters of equipment and are aimed at the objective justification of their rational values. Let us assume that the adjustable operating parameters for subsystems A, B and C are, for example, the parameters given in Table. 3.
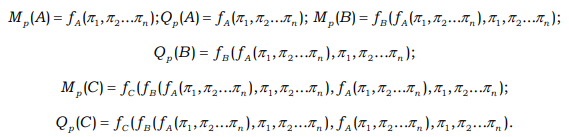
Material Mp and energy Qp losses when the product goes through subsystems A, B and C are functionally dependent on the operating parameters π1,π2 ... πn introduced into the technology, then:
If the actual operating parameters or equipment condition indicators do not give an opportunity to provide the expected or prescribed losses, it destabilizes the technology. In this case, for the integrity of the system, it is necessary to set and solve a management task that requires decisions at the level of introducing corrected operating parameters π1,π2 ... πn into the technological flow.
This task is understood as the arrangement of a sequence of software and (or) hardware procedures that provide additional information. Decisions are made on the basis of the analysis of possible options for the operating parameters of process equipment that provide an output for the technological process from an uncontrolled state. At the same time, the technical personnel as a component of the system formalize the thinking, and it can behave programmed in accordance with the chosen rational mode of a technological process, which does not require high qualification.
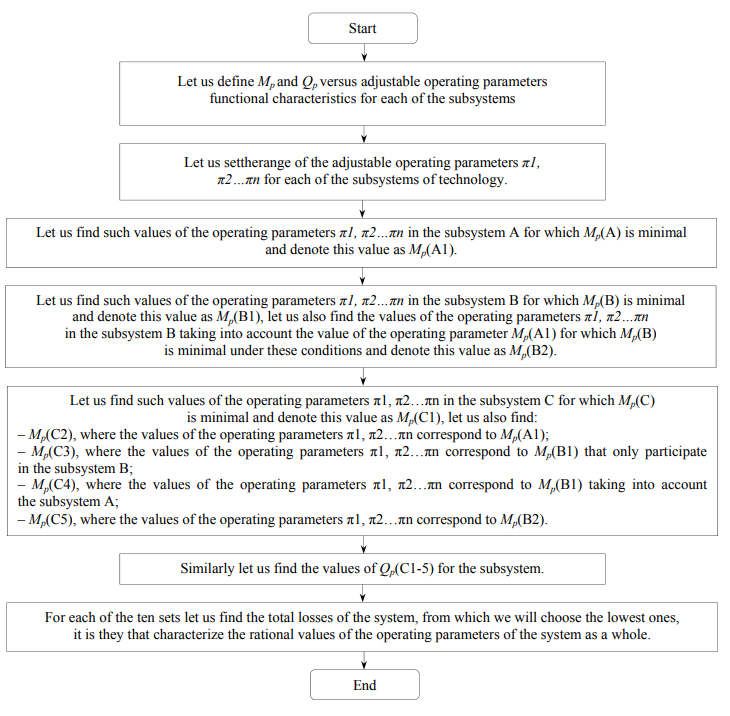
Figure 2 presents the block diagram of the algorithm for solving the management task for minimizing losses by calculating the necessary options for the operating parameters of process equipment. Based on the system analysis and the implementation of the presented algorithm, it is possible to optimize a complex parameter that takes into account material and energy losses depending on the range of variable factors in each subsystem on the basis of their interrelation. An indicator Kst equal to the product of Qrelativecommon and МPcommon or their sum can be taken as a complex parameter.
For interval undefined characteristics, which may
also be the indicators of losses when processing food
raw materials (by waste size), in the absence of any
additional conditions, the undefined entropy is a
rectangle ![]()
The presented system, consisting of three subsystems (Fig. 1), is not indicative and is only given to illustrate the proposed algorithm, because such an approach is inexpedient with three consecutive operations. In this case, it is possible to quickly determine the weak link by simply comparing the losses. However, in complex technologies, where the number of operations is significant and at the same time there is waste recycling by returning it to the flow, and also heat recovery, simple comparison is clearly not enough. In addition, the ranges of mass and energy losses can enter one into another or be significantly shifted from one another for different operations. In particular, an increase in mass or energy losses in the previous operations may lead to their decrease in the subsequent operations. For example, the fine grinding of the raw material is more energy-intensive compared with coarse grinding, leads to a decrease in the duration of thermal and mass-exchange processing of products and, as a consequence, a decrease in energy losses. In this case, it is necessary to optimize the operation of a technological flow on the basis of a system analysis and the probabilistic entropy approach, which, in fact, is based on determining the number of degrees of freedom of each subsystem and the system as a whole.
Virtually any technological operation can be characterized as a set of parameters that are at certain levels of development of machine-hardware design of technology. To estimate the level of stability and integrity using a fuzzy entropy component, it is possible to take the material and energy losses of each subsystem, given that the expert is able to distinguish them among a set of parameters that significantly affect a technological operation.
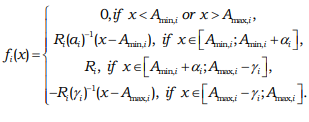
As for the material characteristics Ai of food products, there are always preferences based on their minimal losses when implementing technological operations, which indicates a more complex (nonrectangular) form of the preference function for the fuzzy value Ai.
Let fi(x) be the membership function of the
characteristic Ai. In view of the conceptual meaning of
the preference function, if f (Bi) > f(Bj), then the value Bi
is more preferable (more desirable) than the value Bj by
a factor of λ=f(Bi)/(Bj) , and then with sufficiently
high values of n and the equal lengths of the intervals Δi
and Δj, the following proportion is valid:
![]()
Since the last relation is valid for any pairs of the
indices i and j, we arrive at the conclusion that for all
values of i the equalities ni= µf(Bi) are valid, from
which it is not difficult to deduce that ![]() is valid for all i. Consequently,
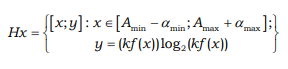
fuzzy entropy is a curvilinear trapezoid the values of
the argument x of which vary from Amin to Amax (along
the abscissa axis), and for each fixed value of x along
the ordinate axis is equal to kf(x)log2kf(x) . To
complete the analysis, it is necessary to estimate the
value of the coefficient k. If the preference function is
of rectangular type, then, as follows from the result
obtained above, the maximum value of entropy is
reached if the following condition has been fulfilled:
is valid for all i. Consequently,
fuzzy entropy is a curvilinear trapezoid the values of
the argument x of which vary from Amin to Amax (along
the abscissa axis), and for each fixed value of x along
the ordinate axis is equal to kf(x)log2kf(x) . To
complete the analysis, it is necessary to estimate the
value of the coefficient k. If the preference function is
of rectangular type, then, as follows from the result
obtained above, the maximum value of entropy is
reached if the following condition has been fulfilled:
![]()
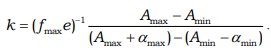
from where k=(fmaxe)-1 follows, where fmax is the maximum value of the preference function.
Preference functions of a trapezoidal type with an additional selected range of more preferable values are of greatest interest. In the case of a trapezoidal type function without a selected range of preferred values, the entropy value at the maximum point will be lower, since two buffer zones of a triangular shape with a base width αmin from the left and αmax from the right are added to the rectangular section. We assume that the decrease is characterized by the ratio of the corresponding horizontal sections of the domain of variation of the argument x corresponding to the rectangular zone and the entire domain of definition of the preference function, that is:
In the presence of the selected ranges, another coefficient is added for similar reasons:
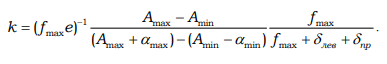
As a result, with respect to food technologies, we obtain: preference functions of a trapezoidal type and with the selected range of preferred values.
Fuzzy entropy is a curvilinear trapezoid with a base from (Amin-αmin) to (Amax-αmax) enclosed by a kf(x)log2kf(x) curve above:
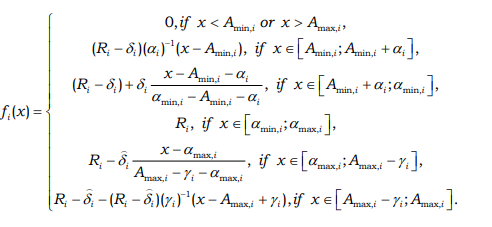
The expression that specifies the function f (x) is given in [12], where αmin =α , αmax =ɣ , fmax =R , δ left<>/sub = δ and δright are denoted, as well as the expressions for finding the coefficient k. With regard to the production of food products, the losses of various substances in the simplest case can be described by a trapezoidal membership function:
However, in some cases, not only the interval of changes in its possible values, but also the most desirable value of the indicator or its interval can be indicated for the loss indicator. In this case, instead of the trapezoidal membership function, it is proposed to use its modification, taking into account the specified additional condition (Fig. 3).
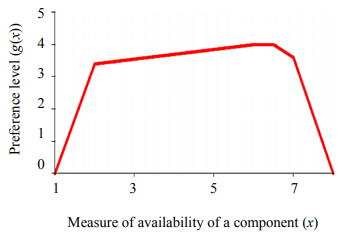
This modification of the membership function, shown in Figure 3, is defined as the ratio:
Thus, for the calculated and empirical estimates of energy costs, material losses, ranges of variation of line parameters, technological limits and quality indicators of the finished and semi-finished products, as well as to eliminate the subjectivity of estimating the existing technological flows and predicting the stability of subsystems and the system as a whole at the design stage, it is reasonable to use the conditional entropy of a subsystem (the level of losses when implementing a technological operation) specified by fuzzy entropy. In this case, the process of a change in the initial entropy of a technical system can be described as the process of accumulation of the structural information calculated as the difference between the maximum and the real values of entropy, i.e. the growth of stability.
As an example, let us describe a technological system that consists of two subsystems A and B with a semi-rigid connection (Fig. 4).
In this case, we are interested in material and energy losses when the product goes through subsystems A and B. Let there be Mp and Qp versus operating parameters π1, π2...πn functional characteristics and their adjustable range the data of which are presented in Table 4.
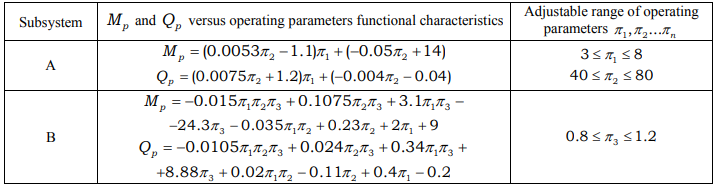
Let us find such values of the operating parameters π1, π2 in subsystem A for which the values Mp (A) and Qp (A) are minimal and denote these values as Mp (A1) and Qp (A1).


The fuzzy entropy of the system is expressed through material and energy fuzzy entropies for each of the operations. Figures 5 and 6 present the obtained graphs of the entropy component.

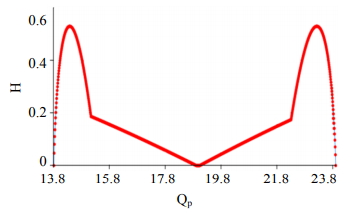
It is known that entropy changes from zero to a certain maximum value, moreover, the value "0" will be when the a priori probability P = 0 and P = 1, i.e. when there is practically no distribution and there is no uncertainty in the system. Let us assume such values QP common and MP common that the values of their entropies asymptotically approach zero, for example: QP common = 11.73 and MP common = 17.89.
Knowing the values of the total energy and material losses (MP common = 17.89, QP common = 11.73), as well as rational operating parameters of subsystem A (π1 = 3; π2 = 40), let us find the rational range of the parameter π3. After a simple calculation, we obtain the desired range of the parameter π3 with which subsystem B is stable: 0.82 ≤ π3 ≤ 0.91.
ВЫВОДЫ
By predicting the stability of technical and technological subsystems and systems as a whole by making out material and energy balances, minimizing energy and material losses is possible, as well as determining the ranges of variation in the parameters of line operation, technological limits and quality indicators of the finished and semi-finished products. At the same time, the systemic complex analysis of technological flows allows us to study the processes of an entropy change in a technical system (the growth of system stability) by describing the processes of accumulation of structural information, calculated as the difference between the maximum and the real value of fuzzy entropy.
Thus, the use of the conditional fuzzy entropy of the system to identify the ranges of variation of adjustable operating parameters for the stable operation of lines and the elimination of subjectivity of estimates for the operating technological flows and the prediction of stability of operation of subsystems and the system as a whole at the design stage is original and competitive.
СПИСОК ЛИТЕРАТУРЫ
- Antipov S.T. Sistemnoe razvitie tekhniki pishchevykh tekhnologiy [System development of technology of food technologies]. Moscow: Kolos Publ., 2010. 760 p.
- Antipov S.T., Panfilov V.A., Urakov O.A., and Shakhov S.V. Sistemnoe razvitie tekhniki pishchevykh tekhnologiy [System development of technology of food technologies]. Moscow: Kolos Publ., 2010. 762 p.
- Glazunov Yu.T., Ershov A.M., and Ershov M.A. Modelirovanie protsessov pishchevykh proizvodstv [Modelling of processes of food production]. Moscow: Kolos Publ., 2008. 360 p.
- Gorenkov E.S., Turkin J.K., Alkaev D.S., and Tolkachev V.F. Technological stream of packing and corking of diphasic fruit-and-vegetable canned food. Food processing industry, 2011, no. 10, pp. 12–13. ( In Russian).
- Ivashov V.I. Tekhnologicheskoe oborudovanie predpriyatiy myasnoy promyshlennosti [Technological equipment of meat industry enterprises]. St. Petersburg: GIORD Publ., 2007. 464 p.
- Kovalevskiy V.I. Proektirovanie tekhnologicheskogo oborudovaniy ai liniy [Design of process equipment and lines]. St. Petersburg: GIORD Publ., 2007. 320 p.
- Kononov N.S., Dunchenko N.I., and Afanasov E.E. Formalization of the technological process of yogurt products on the basis of system analysis. Izvestia vuzov. Pishchevaya tekhnologia, 2003, no. 1, pp. 64–66. (In Russian).
- Panfilov V.A. Teoriya tekhnologichesko gopotoka [Process flow theory]. Moscow: Kolos Publ., 2007. 319 p.
- Rebane K.K. Energiya, entropiya, sredaobitaniya [Energy, entropy, habitat]. Tallinn: Valgus Publ., 1984. 159 p.
- Satina L.I. The Results of systematic research of manufacture papiros. Apriori. Series: natural and technical sciences, 2016, no. 5, p. 13. (In Russian). Available at: http://www.apriori-journal.ru/seria2/5-2016/Satina.pdf. (accessed 11 November 2017).
- Chernov V.G. Osnovy teorii nechetkikh mnozhestv [Fundamentals of the theory of fuzzy sets]. Vladimir: VlSU Publ., 2010. 96 p.
- Nugmanov A.Kh.-Kh. Nauchno-prakticheskie podkhody k konstruirovaniyu mnogokomponentnykh pishchevykh sistem v tekhnologii obshchestvennogo pitaniya [Scientific and practical approaches to the design of multicomponent food systems in public catering technology]. Astrakhan: PE Sorokin Roman Vasilyevich, 2016. 96 p.
- Deshmukh K.C., Khot P.G., and Nikhil N. Generalized measures of fuzzy entropy and their properties. World Academy of Science, Engineering and Technology, 2011, no. 80, pp. 93–106.
- Katok A. and Hasselblatt B. Introduction to the Modern Theory of Dynamical Systems. Cambridge University Press, 1995. 822 p.
- Moejes S.N.B. and van Boxtel A.J. Energy saving potential of emerging technologies in milk powder production. Trends in Food Science and Technology, 2017, vol. 60, no. 2, pp. 31–42. DOI: 10.1016/j.tifs.2016.10.023.
- Arvanitis S., Peneder M., Rammer C., Stucki T., and Woerter M. Development and utilization of energy-related technologies, economic performance and the role of policy instruments. Journal of Cleaner Production, 2017, vol. 159, no. 8, pp. 47–61. DOI: 10.1016/j.jclepro.2017.04.162.
- Hegde S., Lodge J.S., and Trabold T.A. Characteristics of food processing wastes and their use in sustainable alcohol production. (Review). Renewable and Sustainable Energy Reviews, 2018, vol. 81, pp. 510–523. DOI: 10.1016/j.rser.2017.07.012.
- Irani Z., Sharif A.M., Lee H., et al. Managing food security through food waste and loss: Small data to big data. Computers and Operations Research, 2017. DOI:10.1016/j.cor.2017.10.007. (In press).
- Yang Z., Shao S., Yang L., and Liu J. Differentiated effects of diversified technological sources on energy-saving technological progress: Empirical evidence from China's industrial sectors. Renewable and Sustainable Energy Reviews, 2017, vol. 72, no. 5, pp. 1379–1388. DOI: 10.1016/j.rser.2016.11.072.
