

Аннотация
Myofibrillar and sarcoplasmic proteins were extracted from pork meat (M. Longissimus dorsi) and then separated by capillary gel electrophoresis (CGE). Migration time and peak areas of individual protein molecules in the electropherogram were analysed. The electropherograms obtained after the separation of myofibrillar proteins contained 53 well-separated peaks, of which the following were identified: thymosin, myosin light chain-3 (MLC-3), myosin light chain-2 (MLC-2), troponin C, troponin I, myosin light chain-1 (MLC-1), tropomyosin 1, tropomyosin 2, troponin T, actin, desmin, troponin, C protein, and myosin heavy chain (MHC). The relative concentration of the identified myofibrillar proteins was 74.5%. Of the 56 separated sarcoplasmic proteins the following were identified: myoglobin, myokinase, triosephosphate isomerase, phosphoglycerate mutase, lactate dehydrogenase, glyceraldehyde phosphate dehydrogenase, aldolase, creatine kinase, enolase, phosphoglucose isomerase, pyruvate kinase, phosphoglucomutase, and phosphorylase b. The relative concentration of the identified sarcoplasmic proteins was 83.6% of all sarcoplasmic proteins extracted from the pork meat.Ключевые слова
Myofibrillar proteins, sarcoplasmic proteins, capillary gel electrophoresisВВЕДЕНИЕ
The quality of meat and meat products depends on the amount and state of proteins present there. Biochemical reactions occurring during processing and storage of meat affect the structure and functional properties of meat protein [1, 2]. These changes lead to two directions: splitting of large protein molecules and aggregating of small protein molecules. The result is protein denaturation that affects the technological properties of meat. Changes in myofibrillar proteins have a great influence on the texture and other properties of meat and meat products [2]. In order to properly manage the processing and storage of pork meat, it is necessary to determine the state of the present proteins. Several techniques are used to analyse myofibrillar and sarcoplasmic proteins in meat.
Polyacrylamide gel electrophoresis (PAGE) is often used for proteins separation [3]. PAGE can be used to determine native and denatured proteins. There are several techniques for carrying out polyacrylamide gel electrophoresis: disc gel electrophoresis [4, 5], one- dimensional SDS-polyacrylamide gel electrophoresis (1D SDS-PAGE) [6–9], and two-dimensional SDS-polyacrylamide gel electrophoresis (2D SDS- PAGE) [10]. A capillary gel electrophoresis (CGE) was developed as an alternative to the traditional slab-gel PAGE [1, 11, 12]. The separation of proteins by CGE is based on the difference in the electrophoretic mobility of ions in the medium within small capillaries. The size of a molecule has a significant influence on the mobility of the ions [13]. New technical solutions, transferred from high-performance liquid chromatography (HPLC) instruments, enabled the development of high- performance instruments, such as high-performance capillary electrophoresis (HPCE). HPCE is a modern analytical technique based on the principles of classical electrophoresis and chromatographic performance [14]. Different HPCE techniques allow using of empty or filled capillaries. In many cases, a capillary is filled with polyacrylamide gel. When a sample is treated in an SDS-containing buffer, the technique is known as capillary SDS-CGE. It has a similar protein separation possibility as a slab-gel SDS-PAGE. SDS-CGE has several advantages over the traditional slab gel electrophoresis, including on-capillary detection, great resolving power, a capability of accurate protein quantification and molecular weight determination, and instrumental automation [15]. SDS-CGE provides rapid separation of peptides and proteins from complex mixtures such as meat, milk, grains and other food products [1, 16, 17].
To determine the influence of soluble and insoluble proteins on meat quality, precise methods for quantifying each protein need to be developed. Quantification of isolated proteins is a complex problem. The process of densitometric scanning of coloured SDS-PAGE gels in the traditional slab PAGE is complicated and insufficiently precise. For this reason, several authors recommend the application of new techniques. The aim of this paper is to investigate application possibilities of high performance SDS-CGE for the identification and quantification of myofibrillar and sarcoplasmic proteins in pork meat.
ОБЪЕКТЫ И МЕТОДЫ ИССЛЕДОВАНИЯ
Preparation of the capillary electrophoresis (CE) instrument. Electropherograms were obtained using a capillary electrophoresis CE 7100 instrument (Agilent Technologies, PaloAlto, CA) equipped with a non- column DAD for UV detection and spectra collection. Migration time and peak areas of individual protein molecules in the electropherogram were analysed using ChemStation Software (Agilent Technologies, PaloAlto, CA). The preparation of the CE instrument was carried out according to certain recommendations [18].
For CGE analysis using the SDS Gel Buffer from Beckman Coulter, 50 μm ID. Bar-fused silica capillaries were used, with a total length of 33 cm and an effective length of 24.5 cm. One time per day, the capillaries were conditioned as follows: rinsed at high pressure (2 bar) with 0.1 N NaOH during 10 min, with 0.1 N HCl during 5 min and with deionized water during 2 min; then rinsed at high pressure (4 bar) with the SDS Gel Buffer during 10 min. After that, both electrodes were dipped in water. Voltage equilibration was conducted at 16.5 kV during 10 min with 5 min ramping. Prior to each sample application, the capillaries were conditioned as follows: rinsed at high pressure (4 bar) with 0.1 N NaOH during 3 min, with 0.1 N HCl during 1 min, with deionized water during 1 min, and with the SDS Gel Buffer during 10 min. After that, both electrodes were dipped in water.
The injection of the samples was performed electronically using -5 kV for 20 seconds. After dipping the inlet electrode in water, the proteins were separated by using -16.5 kV (-500 V/m-2) during 30 minutes. A pressure of two bars was used to both inlet and outlet vials during the run. After the run was completed, the capillaries were conditioned as follows: rinsed at high pressure (4 bar) with 0.1 N NaOH during 15 min, rinsed at high pressure (3.5 bar) with 0.1 N HCl during 5 min, and with water during 10 min. All the rinses were carried out in the forward direction, that is pressure was used to the inlet vial. The capillary temperature was maintained at 25ºC. The detection wavelength was 220 nm with a bandwidth of 20 nm (no reference wavelength) and a response time of 1 second. The glass vials of 2 mL were used for all utilized reagents. The filling volume was 1.2 mL, except the vials for water dipping, which contained 1.6 mL water, and the vials for waste, which contained 0.6 mL water. Three separate waste vials were used to collect 0.1 N NaOH, 0.1 N HCl/water and the SDS Gel Buffer. The SDS gel buffer was replaced after every sequence of eight runs.
CGE with Beckman Coulter gel. An SDS-MW Analysis Kit was purchased from Beckman Coulter, Fullerton, CA. The Kit contained the following components: 50 μm I.D. bare-fused silica capillaries of 57 cm; SDS-MW Gel buffer – proprietary formulation; SDS; sample buffer – 100 mM Tris-HCl with pH 9.0 and 1% SDS; SDS protein size standard (10 to 225 kDa) 16 mg/mL; internal standard 10 kDa protein 5mg/mL, acidic wash solution 0.1 N HCl; and basic wash solution 1.1 N NaOH.
Preparation of SDS-MW Size Standard. SDS-MW size standard was removed from arefrigerator and left at room temperature for 15 min before starting the sample preparation. The standard was thoroughly mixed and briefly centrifuged in a standard microfuge. 10 μL of the size standard was pipetted into a micro vial, and then 85 μL of the sample buffer, 2 μL of the internal standard, and 5 μL of 2-mercaptoethanol were added, respectively. The vial was tightly capped and thoroughly mixed. The mixture was heated in a water bath at 100°C for 3 min in a closed micro vial. The vial was then placed in a room temperature water bath to cool for 5 min before injection.
Protein extraction from pork meat. For this study, pork meat samples were obtained from M. Longissimus dorsi muscle of pigs that lived on a farm near Banja Luka, Bosnia and Herzegovina. The animals were farmed under the same conditions. Before slaughter, they were 6 months old, and their average weight was 110–120 kg. The slaughter was done in an abattoir, under controlled conditions. After slaughtering, the carcasses were cooled to 4°C. The samples for analysis were taken 24 h post mortem and transported to the laboratory under refrigeration. The analysis was carried out immediately after the samples were brought to the laboratory.
The water-soluble proteins were extracted from pork muscles (4 g diluted 1:10 with 0.03 M potassium phosphate buffer, pH = 7.4) at 2°C for 2 min in a homogeniser (Ultraturax, IKA) followed by centrifugation at 5000 rpm for 20 min [19]. The supernatant (sarcoplasmic proteins) was collected for qualitative and quantitative assays. The pellet was washed again by the same procedure. The resulting pellet was then dispersed in 10 volumes of 8 M urea containing 10 ml β-mercaptoethanol per litre, and extracted for 2 min at 2°C in a homogeniser (Ultraturax, IKA) [19]. The homogenate was centrifuged under refrigeration at 5000 rpm for 20 min and the supernatant, containing the myofibrillar proteins, collected for further qualitative and quantitative assays. The sample solutions were filtered using 0.2 μm syringe filters prior to analysis.
Preparation of protein sample. The sample was diluted with the SDS sample buffer for a total 95 μL volume to obtain a final protein concentration range of 1.2 mg/mL to 2 mg/mL. the amount of protein in the sample was estimated by Lowry’s method, using bovine serum albumin (BSA) as a standard. Then 2 μL of internal standard and 5 μL of 2-mercaptoethanol were added. The vial was tightly capped and then thoroughly mixed. The mixture was heated in a water bath at 100°C for 3 min in a closed micro vial. After that, the vial was placed in a room temperature water bath to cool for 5 min before injection.
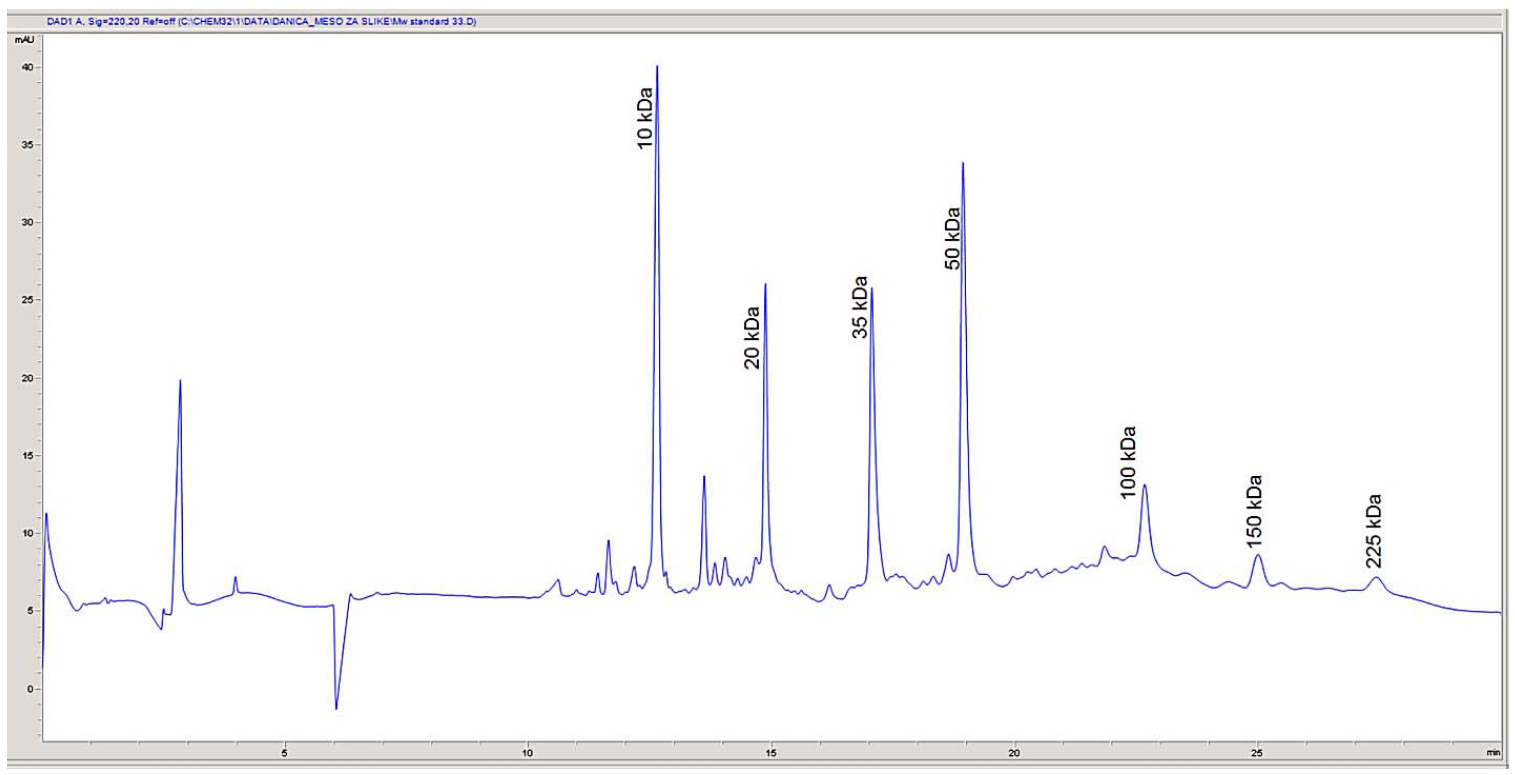
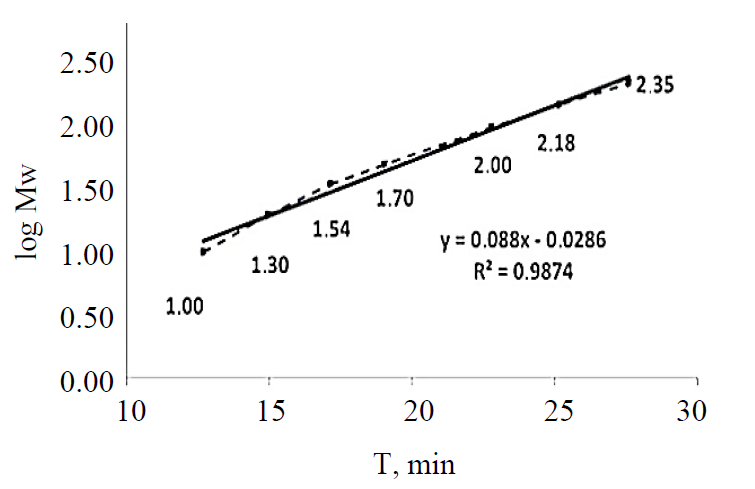
Protein determination. In order to determine the molecular weights corresponding to the electrophoretic peaks, a calibration curve was obtained using seven proteins in SDS-MW size standard (Beckman Coulter, Inc., Fullerton, CA): uith protein molecular weights of: 10, 20, 35, 50, 100, 150, and 225 kDa. All the proteins were completely separated within 30 min (Fig. 1). The first peak (MT = 12.64 min), corresponding to a 10 kDa protein, was used as an internal standard during the analysis of myofibrillar and sarcoplasmic proteins in pork meat. Within this range, the logarithm of the protein molecular weight is linear with its reciprocal electrophoretic mobility. A standard protein mixture was used to construct a calibration curve (Fig. 2). A regression line was obtained: y (logMw) = 0.088X – 0.0286, R2 = 0.9874. Protein identification was performed by comparing the obtained molecular weights with the relevant data published in the literature [4, 8, 20, 21].
Determination of relative protein concentration. The peak areas and relative protein concentrations were determined by ChemStation Software (Agilent). The areas of peaks in the electropherograms, determined by indirect detection, allowed us to automatically quantify the relative concentration of each protein in the mixture using the capillary instrument software.
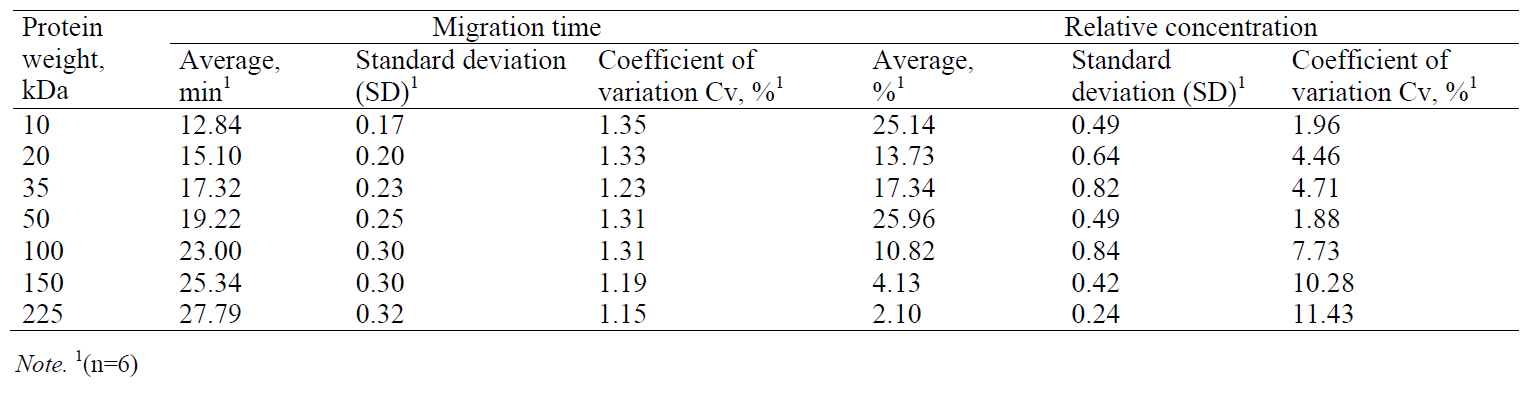
Validation method. The repeatability of the protein separation process from a mixture of known molecular weight proteins was evaluated in seven repetitions. The migration time (MT) and relative concentrations of seven proteins (10, 20, 35, 50, 100, 150 and 225 kDa) are shown together with the standard deviation and coefficient variation in Table 1. The results with good repeatability confirm the coefficient of variation in all the measurements of migration time and relative protein concentration being less than 1.35% and 11.43%, respectively. The obtained data were used to identify the separated myofibrillar and sarcoplasmic proteins. It should be noted that all the measurements during the test of repeatability were performed by an analyst using the same measurement procedure and the same measuring instrument in the same working conditions.
РЕЗУЛЬТАТЫ И ИХ ОБСУЖДЕНИЕ
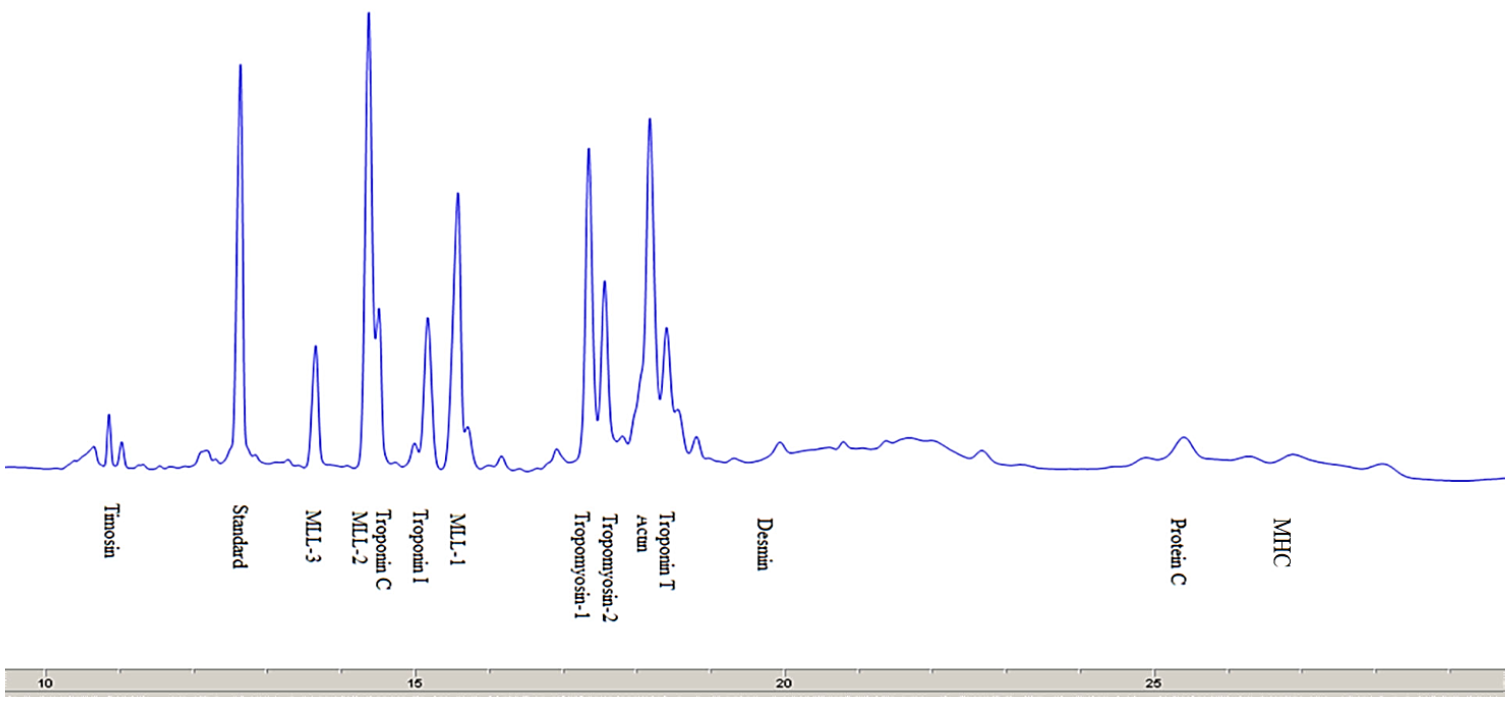
There are many proteins in the meat that differ in their chemical and physical characteristics and functions performed in the muscles of living animals and in the meat post mortem [22]. The electropherograms of myofibrillar and sarcoplasmic proteins separated by SDS-capillary gel electrophoresis (SDS-CGE) are shown in Fig. 3.
Myofibrillar proteins. Fig. 3 presents an electropherogram obtained after separating myofibrillar proteins from pork meat (M. longissimus dorsi). The proteins were separated and detected at a certain time, which was specific and constant for each of the myofibrillar proteins. The total number of peaks obtained after the CGE separation of myofibrillar proteins from the pork meat (M. longissimus dorsi) was 52 or 53 (Table 2). The molecular weight of each identified protein was determined on the basis of the migration time and calibration curve obtained on the electropherogram database for the mixture of known molecular weight proteins (Mw standard) (Fig. 2). This technique allowed the separation and identification of proteins to be ranged from 10 kDa to 225 kDa. To separate proteins of very high molecular weight, electrophoretic methods are not sufficient and they need to be combined with other separation techniques. By partial fragmentation of large protein molecules in smaller segments and their analysis, it is possible to obtain qualitative and quantitative data for proteins of high molecular weights [23].
The relative concentration of the separated proteins was determined as a ratio between the corresponding peak area and the total area of all the peaks in the electropherogram (Table 2). Proteins whose migration time was shorter than 10 min (concentration of 0.1%) were not considered. Myofibrillar proteins are characterized by high heterogeneity and a wide range of molecular weights. In order to facilitate electrophoretic studies, it is useful to divide them into several groups that differ by molecular weight: group I (Mw < 20 kDa), group II (Mw = 20–50 kDa), group III (Mw = 50–100 kDa), group IV (Mw = 100–150 kDa), and group V (Mw > 150 kDa). The numbers of peaks separated were as follows: 24–27 peaks in group I (total relative concentration of 26.75–27.87%), 15–17 peaks in group II (total relative concentration of 50.98–53.34%), 6 peaks in group III (total relative concentration of 9.73–10.96%), 1 peak in group IV (total relative concentration of 1.11%), and 4 peaks in group V (total relative concentration 9.08%) (Table 2).
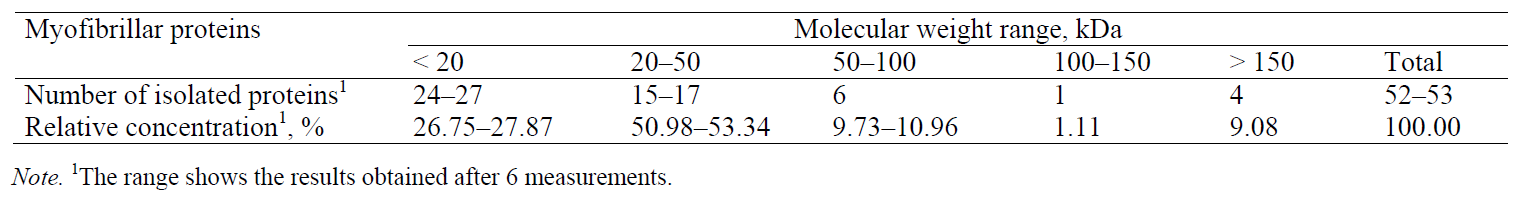
Based on the obtained molecular weights of myofibrillar proteins, the following proteins were identified (Table 3): thymosin, myosin light chain-3 (MLC-3), myosin light chain-2 (MLC-2), troponin C, troponin I, myosin light chain-1 (MLC-1) tropomyosin 1, tropomyosin 2, troponin T, actin, desmin, troponin, C protein, and myosin heavy chain (MHC).
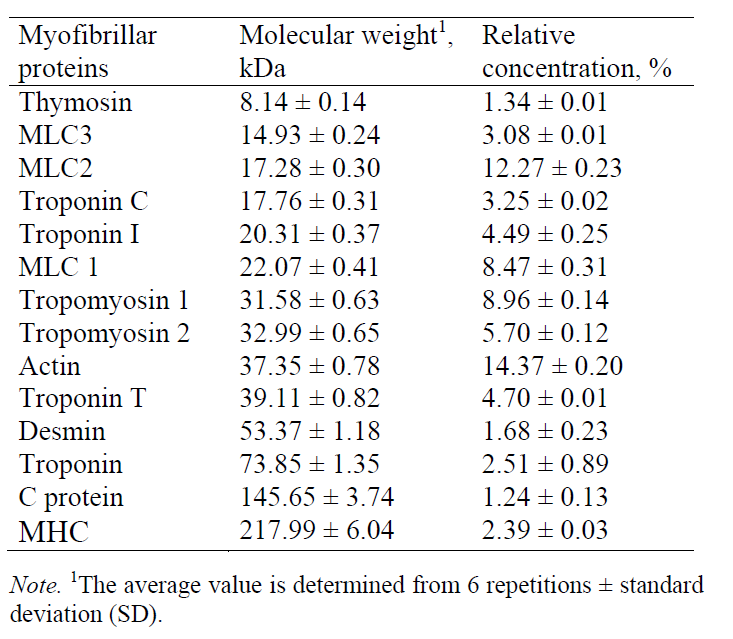
These results are in agreement with the findings of other authors [4, 8, 20, 21].
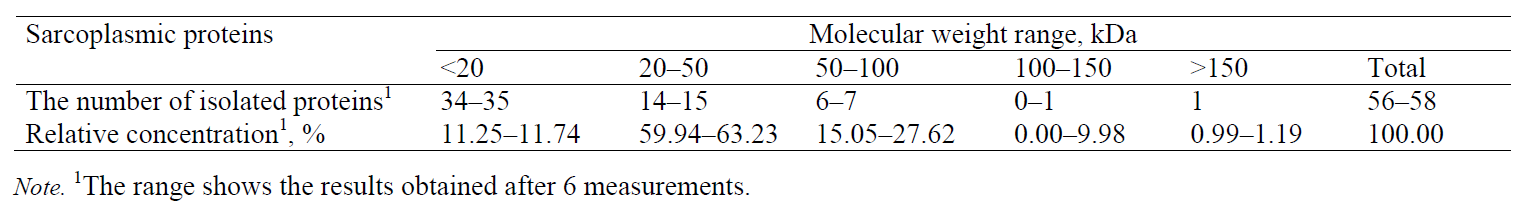
Sarcoplasmic proteins. The electropherogram obtained by separating sarcoplasmic proteins extracted from the pork meat (M. longissimus dorsi) is shown in Fig. 4. The total number of peaks (whose relative concentration was greater than 1%) was 56–58. The proteins were divided into five groups according to their molecular weight. The numbers of peaks identified in the groups were as follows: 34–35 in group I (0–20 kDa), 14–15 in group II (20–50 kDa), 6–7 in group III (50–100 kDa), one peak in group IV (100–150 kDa), and one peak in group V (> 150 kDa) (Table 4).
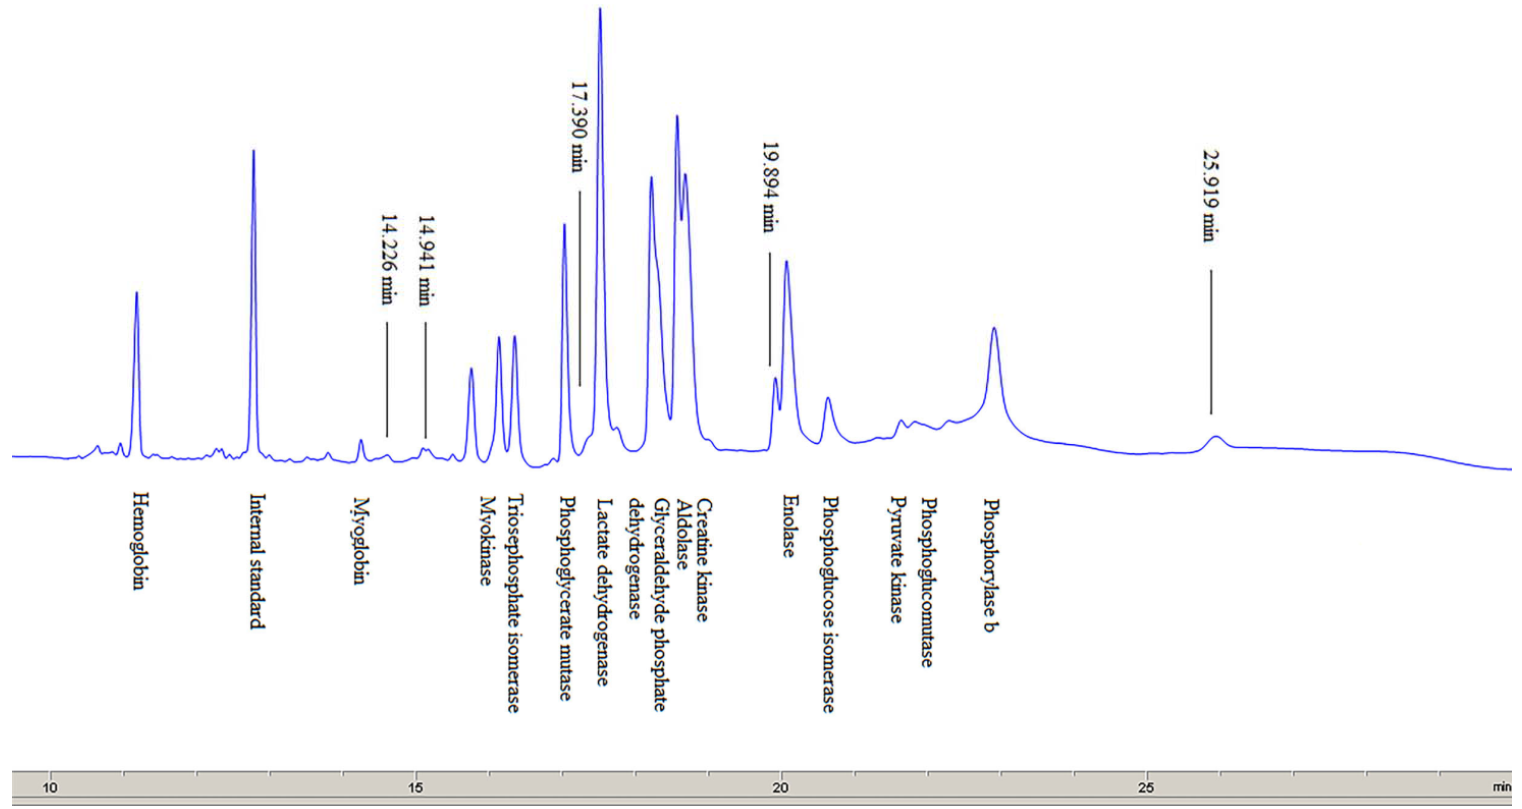
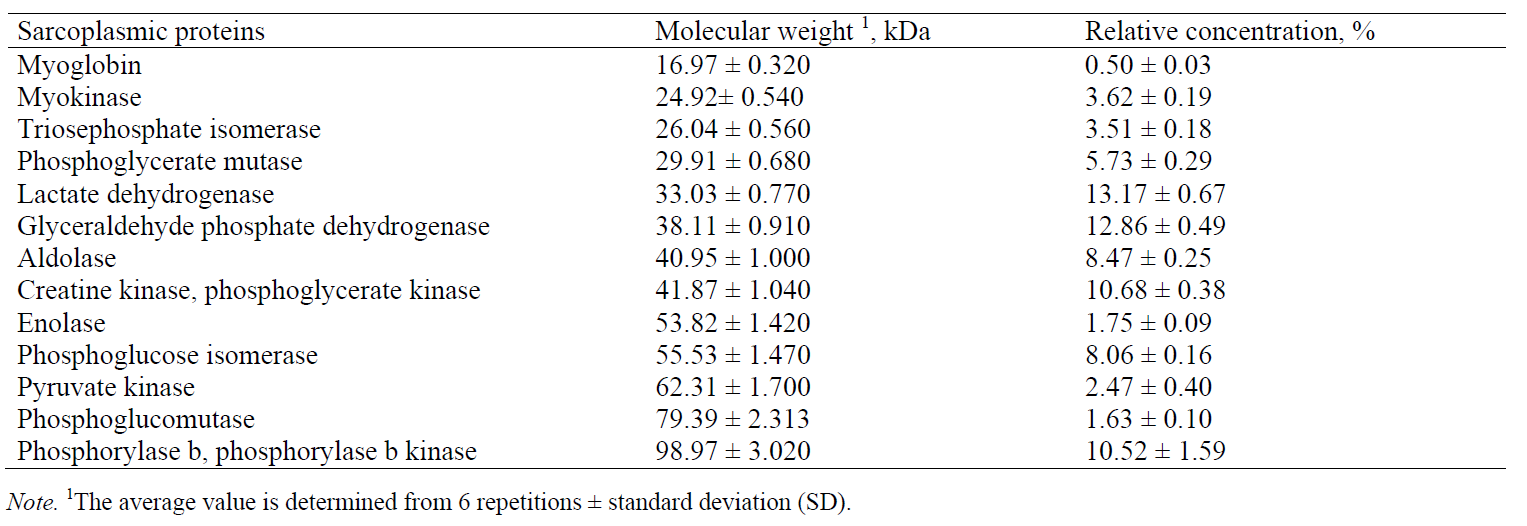
Based on the obtained molecular weights of sarcoplasmic proteins, the following proteins were identified (Table 5): myoglobin, myokinase, triosephosphate isomerase, phosphoglycerate mutase, lactate dehydrogenase, glyceraldehyde phosphate dehydrogenase, aldolase, creatine kinase, enolase, phosphoglucose isomerase, pyruvate kinase, phosphoglucomutase, and phosphorylase b. The results obtained in this paper are in agreement with the previous studies [4, 21, 23]. Marino et al. [23] used two-dimensional gel electrophoresis (SDS-PAGE) to separate sarcoplasmic proteins from bovine meat and then to identify the proteins by mass spectrometry (with exact molecular weights of some sarcoplasmic proteins determined). In comparison with those results, the data obtained in this study, using CGE, show the same order of separated sarcoplasmic proteins and similar values of molecular weights for most of the identified proteins.
In addition to the identified sarcoplasmic proteins, a few more peaks (with a migration time of 14.23 min, 14.94 and 17.725 or 17.390 min) may be observed in Fig. 4. They are likely to be enzymes with a low concentration in the sarcoplasm in pork meat, or they might represent low molecular weight products, resulting from the degradation of myofibrillar proteins. Marino et al. [23] reported that these peaks represented the following proteins: myosin light chain-1 (MLC-1), myosin light chain-2 (MLC-2) and tropomiozin-2. Several authors have studied changes in protein composition of extracts obtained during meat ageing [24], after applying certain meat processing technologies [25], and also to identify or analyse the type of meat in the mixture [1, 9]. Gallego et al. [8] cite molecular weights of multiple sarcoplasmic and myofibrillar proteins, calculated by nLC-MS/MS.
ВЫВОДЫ
Capillary gel electrophoresis (CGE) is used to separate, identify and quantify proteins in pork meat as well as determine molecular weights of separated myofibrillar and sarcoplasmic proteins, ranging from 10 kDa to 225 kDa. After the separation of proteins by capillary gel electrophoresis, the electropherograms contained 53 peaks of myofibrillar proteins and 56 peaks of sarcoplasmic proteins.
The myofibrillar proteins identified on the electropherogram included thymosin, myosin light chain-3 (MLC-3), myosin light chain-2 (MLC-2), troponin C, troponin I, myosin light chain-1 (MLC-1), tropomyosin 1, tropomyosin 2, troponin T, actin, desmin, troponin, C protein, and myosin heavy chain (MHC).
The sarcoplasmic proteins identified on the electropherogram included myoglobin, myokinase, triosephosphate isomerase, phosphoglycerate mutase, lactate dehydrogenase, glyceraldehyde phosphate dehydrogenase, aldolase, creatine kinase, enolase, phosphoglucose isomerase, pyruvate kinase, phosphoglucomutase, and phosphorylase b.
The results obtained in this work are in agreement with the values obtained from the curve for standard protein solutions and with the bands obtained using the classic gel electrophoresis methods.
The advantages of capillary gel electrophoresis (CGE), which justify its recommendation for practical application, include the separation rate, the repeatability of the results, and a simple procedure for determining the content of myofibrillar and sarcoplasmic proteins in meat qualitatively and quantitatively.
КОНФЛИКТ ИНТЕРЕСОВ
The authors declare no potential conflict of interest.
СПИСОК ЛИТЕРАТУРЫ
- Vallejo-Cordoba B., Rodríguez-Ramírez R., and González-Córdova A.F. Capillary electrophoresis for bovine and ostrich meat characterization. Food Chemistry, 2010, vol. 120, no. 1, pp. 304–307. DOI: https://doi.org/10.1016/j.foodchem.2009.09.080.
- Matarneh S.K., England E.M., Scheffler T.L., and Gerrard D.E. The Conversion of Muscle to Meat. In Toldra F. (ed) Lawrie’s Meat Science. Cambridge, UK: Woodhead Publ., 2017. pp. 159–185.
- Ssrensen H., Ssrensen S., Bjergegaard C., and Michaelsen S. Chromatography and capillary electrophoresis in food analysis. London, UK: The Royal Society of Chemistry, 1999. pp.198–276.
- Porzio M.A. and Pearson A.M. Improved resolution of myofibrillar proteins with sodium dodecyl sulfate-polyacrylamide gel electrophoresis. Biochimica et Biophysica Acta (BBA) – Protein Structure, 1977, vol. 490, no. 1, pp. 27–34. DOI: https://doi.org/10.1016/0005-2795(77)90102-7.
- Grujić R., Petrović L., Pikula B., and Amidžić Lj. Definition of the optimum freezing rate—1. Investigation of structure and ultrastructure of beef M. longissimus dorsi frozen at different freezing rates. Meat Science, 1993, vol. 33, no. 3, pp. 301–318. DOI: https://doi.org/10.1016/0309 1740(93)90003-Z.
- Claeys E., Uytterhaegen L., Buts B., and Demmeyer D. Quantification of beef myofibrillar proteins by SDS–PAGE. Meat Science, 1995, vol. 39, no. 2, pp. 177–193. DOI: https://doi.org/10.1016/0309-1740(94)P1819-H.
- Ahmed N.S., Abd El-Gawad M.A.M, El-Abd M.M., and Abd-Rabou N.S. Properties of buffalo Mozzarella cheese as affected by type of coagulante. Acta Scientiarum Polonorum Technologia Alimentaria, 2011, vol. 10, no. 3, pp. 339–357.
- Gallego M., Mora L., Aristoy M.C., and Toldrá F. Optimisation of a simple and reliable label-free methodology for the relative quantitation of raw pork meat proteins. Food Chemistry, 2015, vol. 182, pp. 74–80. DOI: 10.1016/j.foodchem.2015.02.114
- Kim G-D., Seo J.-K., Yum H.-W., Jeong J-Y., Yang H-S. Protein markers for discrimination of meat species in raw beef, pork and poultry and their mixtures. Food Chemistry, 2017, vol. 217, pp. 163–170. DOI: https://doi.org/10.1016/j.foodchem.2016.08.100.
- Dziuba J., Szerszunowicz I., Nałęcz D., and Dziuba M. Proteomic analysis of albumin and globulin fractions of pea (Pisum sativum L.) seeds. Acta Scientiarum Polonorum Technologia Alimentaria, 2014, vol. 13, no. 2, pp. 181–190. DOI: https://doi.org/10.17306/J.AFS.2014.2.7.
- Cota-Rivas M. and Vallejo-Cordoba B. Capillary electrophoresis for meat species differentiation. Journal of Capillary Electrophoresis, 1997, vol. 4, no. 4, pp. 195–199.
- Hajba L. and Guttman A. Recent advances in column coatings for capillary electrophoresis of proteins. Trends in Analytical Chemistry, 2017, vol. 90, pp. 38–44. DOI: https://doi.org/10.1016/j.trac.2017.02.013.
- Sirén H. Capillary Electrophoresis in Food Analysis. In: Nollet L.M.L and Toldra F.. Handbook of Food Analysis – Two Volume Set, 3rd Edition. Boca Raton, Florida: CRC Press, 2015. pp. 493–519.
- Weinberger R. Practical Capillary Electrophoresis. Chappaqua, New York: Academic Press, 2000. pp. 1–24.
- Zhu Z., Lu J.J., and Liu S. Protein Separation by Capillary Gel Electrophoresis: A Review. Analytica Chimica Acta, 2012, vol. 709, pp. 21–31. DOI: https://doi.org/10.1016/j.aca.2011.10.022.
- Stepanova S. and Kasicka V. Recent applications of capillary electromigration methods to separation and analysis of proteins. Analytica Chimica Acta, 2016, vol. 933, pp. 23–42. DOI: https://doi.org/10.1016/j.aca.2016.06.006.
- Bonczar G., Walczycka M., and Duda I. The changes of proteins fractions shares in milk and fermented milk drinks. Acta Scientiarum Polonorum Technologia Alimentaria, 2016, vol. 15, no. 4, pp. 379–389. DOI: https://doi.org/10.17306/J.AFS.2016.4.36.
- Wenz C. Performance of commercially available gels for protein characterization by capillary gel electrophoresis with UV detection on the Agilent 7100 CE System. Application Note. Agilent Technologies, 2011.
- Toldra F., Rico E., and Flores J. Cathepsin B, D, H and L activities in the processing of dry-cured ham. Journal of the Science of Food and Agriculture, 1993, vol. 62, no. 2, pp. 157–161. DOI: https://doi.org/10.1002/jsfa.2740620208.
- Sotelo G.C., Pineiro C., Perez-Martin I.R., and Gallardo M.J. Analysis of fish and squid myofibrillar proteins by capillary sodium dodecyl sulfate gel electrophoresis: actin and myosin quantification. European Food Research and Technology, 2000, vol. 211, no. 6, pp. 443–448. DOI:https://doi.org/10.1007/s002170000176.
- Ngapo T.M. and Alexander M. Capillary gel electrophoresis versus SDS PAGE of exudate from fresh pork. Meat Science, 1999, vol. 53, no. 3, pp. 145–148. DOI: https://doi.org/10.1016/S0309-1740(99)00049-2.
- Purslow P.P. The Structure and Growth of Muscle. In Toldra F. (ed) Lawrie’s Meat Science. Cambridge, UK: Woodhead Publ, 2017. pp 49–97.
- Marino R., Albenzio M., della Malva A., et al. Changes in meat quality traits and sarcoplasmic proteins during aging in three different cattle breeds. Meat Science, 2014, vol. 98, no. 2, pp. 178–186. DOI: https://doi.org/10.1016/j.meatsci.2014.05.024.
- Wu G., Farouk M.M., Clerens S., and Rosenvold K. Effect of beef ultimate pH and large structural protein changes with aging on meat tenderness. Meat Science, 2014, vol. 98, no. 4, pp. 637–645. DOI: https://doi.org/10.1016/j.meatsci.2014.06.010.
- Jia G., Liu H., Nirasawa S., and Liu H. Effects of high-voltage electrostatic field treatment on the thawing rate and post-thawing quality of frozen rabbit meat. Innovative Food Science and Emerging Technologies, 2017, vol. 41, pp. 348–356. DOI: https://doi.org/10.1016/j.ifset.2017.04.011.
