

Аннотация
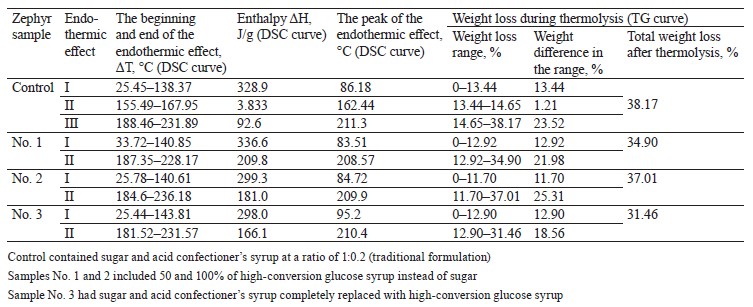
When formulating a product, it is just as important to measure changes in free and bound moisture as it is to analyze quality indicators. Zephyr, a Russian whipped dessert, made with sugar dries quickly during storage, gradually losing its moisture. Its crystalline sugar crust thickens and its entire mass saccharifies, resulting in higher firmness and poor appearance. In this study, we aimed to determine the effect of high-conversion glucose syrup on the amount of moisture and its binding forms in zephyr after storage.We studied four samples of pectin-based zephyr with different carbohydrate profiles after three months of storage. Differential scanning calorimetry, thermogravimetry, and non-isothermal kinetics were applied to assess moisture contents and forms of binding in zephyr.
Thermograms with thermoanalytical curves were used to analyze the thermolysis of zephyr samples with different contents of glucose syrup in the temperature range from 20 to 300°C. We also studied the endothermic effects at various stages of thermolysis and measured free and bound moisture in the samples. Four stages of their dehydration were identified on the basis of graphical dependences between weight changes and heating temperatures.
The control zephyr sample contained more capillary and polymolecular bound moisture, while the experimental samples in which sugar and confectioner’s syrup were partially or completely replaced with high-conversion glucose syrup had more polymolecular and monomolecular bound moisture. The use of high-conversion glucose syrup instead of sugar and confectioner’s syrup reduced the amount of free moisture and therefore increased the amount of bound moisture, keeping zephyr fresh throughout its shelf life.
Ключевые слова
Zephyr, glucose syrup, differential thermal analysis, moisture content, forms of moisture bindingВВЕДЕНИЕ
Modern quality control methods in Russia are used to evaluate food products with various technological, structural, mechanical, thermophysical, and electrophysical properties throughout their shelf life [1]. They include chromatographic, spectral, optical, and thermovimetric instruments. It is particularly important to control changes in moisture binding, namely the ratio of free and bound moisture in the product based on the content and properties of moisture as it interacts with dry substances. This also requires a comprehensive determination of the product’s thermodynamic, thermophysical, structural, and mechanical characteristics, as well as its mass-exchange properties [2].
Whipped pastille mass has a colloidal capillary-porous coagulation structure. It is a two-phase gas-liquid system, where the dispersed phase is air (or gas) bubbles (up to 25 microns in size) separated by protein films and the dispersion medium is a solution of sugar, glucose syrup, acids, pectin, and other components. The dispersion medium, which is formed due to the pectin frame of colloidal particles, is a stabilized foamy jelly with certain mechanical strength, plasticity, and elasticity [3].
Zephyr mass has a foamy structure and an intermediate moisture content of 18 to 25% that contributes to its increased plasticity and elasticity. In zephyr mass, water mainly moves along the skeleton of the jelly but it can evaporate and condensate inside the pores (cells).
Zephyr is produced with various types of gelling agents, including pectin, agar-agar, agaroid, furcellaran, gelatin, etc. These agents are high-molecular compounds that are similar to polysaccharides with a chainlike structure of molecules [4, 5]. In a soluble form, they contribute to the stability of foams. In particular, they are adsorbed in the liquid films covering air bubbles and increase their strength. Egg or milk-protein foaming agents are used to stabilize the foam structure.
Strong pectin jelly is produced from pectins, sugar (or its substitutes), sugary starch hydrolysates (glucose syrups of various types), organic acids, salts of alkali metals and weak organic acids, as well as water. Pectin forms a dense, elastic network of the frame which firmly holds the liquid phase of the jelly. To cause pectin substances to coagulate, water polarity is changed and the surface tension is increased by adding sugar or sugar-containing products. The amount of added sugar depends on the amount of pectin.
Greater esterification of molecules correlates with their lower polarity, which requires a lower sugar content in the solution, and vice versa [6]. Higher concentrations of sugar lead to higher surface tension, causing sucrose molecules to bind and hold more water molecules and resulting in lower water polarity. If the concentration of pectin with a medium gelling capacity is 0.8–1.0% of the jelly weight, the amount of sugar should be at least 65%, corresponding to the concentration of a saturated solution at 70°C.
Molded zephyr halves gradually cool down as they mature, with pectin jelly forming in the dispersion medium. As they dry, a thin crystalline crust forms on their surface, preventing them from sticking. As a result, zephyr halves can be easily removed from the trays, fastened together, and sprinkled with powdered sugar.
During storage, zephyr dries out quite quickly, gradually losing its moisture. Its crystalline crust thickens and its entire mass gets saccharified, resulting in better strength but poorer appearance (reduced volume).
To keep zephyr fresh, its moisture should be evenly distributed and retained throughout its entire shelf life [7]. Free moisture is actively involved in various biochemical and microbiological processes. Bound moisture is associated with proteins and carbohydrates through physical and chemical interactions and least contributes to product spoilage. Bound moisture can be increased by using polysaccharide hydrocolloids (dietary fibers, gums, pectin-containing materials, starch, polysaccharides, carrageenans, etc.) [8]. Chemically, they are linear or branched high-molecular compounds with hydrophilic groups. They easily enter into physical interaction with moisture in the product and ensure its reliable retention.
Glucose syrups, depending on their type, contain from 15 to 60% of polysaccharides (dextrins, tetra- and trisaccharides), which are branched high-molecular compounds [9]. In addition, they contain hygroscopic reducing substances (glucose and maltose), which are good at retaining moisture for a long time.
The traditional zephyr formulation contains 40–50% of confectioner’s syrup (by weight of sugar) with 36– 44% of reducing substances on a dry basis (dextrose equivalent, DE), 42–34% of dextrins, and 65–75% of sugar (of the total weight). In addition, the syrup contains 0.1–0.4% of minerals, such as potassium, phosphorus, sodium, calcium, magnesium, and iron, as well as organic acids [10]. Its pH varies from 3.5 to 6.0.
In our previous studies, we tried to prolong zephyr’s freshness during storage by slowing down its drying and gradual saccharization. For this, we partially or completely replaced sugar and confectioner’s syrup in the control sample with various types of syrups [11]: high-conversion glucose syrup (DE = 62.6%) with 15.4% of dextrins, confectioner’s syrup (DE = 40.4%) with 37.6% of dextrins, and low-conversion glucose syrup (DE = 32.3%) with 45.7% of dextrins. According to our results, confectioner’s or low-conversion syrups used instead of sugar significantly increased the zephyr’s viscosity and density, but decreased its shape-holding ability, causing the mass to spread after molding due to a high content of polysaccharides in these syrups. The use of high-conversion glucose syrup provided the zephyr mass with good viscosity and plasticity, as well as a density of 460 ± 10 kg/m3, which allowed the mass to be shaped by using a depositor [12].
Foamy zephyr mass can be obtained by two methods: 1) by prolonged mechanical whipping of an apple-sugar- pectin mixture at atmospheric pressure in the presence of a foaming agent, followed by adding a glucose syrup and 2) by saturating the mass from an apple-sugar-pectin mixture and a glucose syrup with air at excess pressure. In this study, the zephyr mass was obtained in laboratory conditions using the first method using a Kitfort KT-1338 planetary mixer at a rotation speed of 4.3 s–1.
We aimed to study how the content of high-conversion glucose syrup changed the amount of water and its binding forms in zephyr during storage by using differential thermal analysis.
ОБЪЕКТЫ И МЕТОДЫ ИССЛЕДОВАНИЯ
We studied zephyr samples based on pectin with different carbohydrate profiles resulting from partial or complete replacement of sugar and confectioner’s syrup with high-conversion glucose syrup. After manufacturing, the samples were packed in food-grade plastic transparent containers made of polyethylene terephthalate and stored for three months under controlled external conditions (21 ± 1.5°C, relative humidity of 82 ± 2%). The control sample was prepared according to the traditional method by using sugar and acid confectioner’s syrup at a ratio of 1:0.2. Samples No. 1 and No. 2 had sugar partially (50%) and completely (100%) replaced with high-conversion glucose syrup in the whipped formulation mixture, respectively. Sample No. 3 had sugar and acid confectioner’s syrup completely replaced with high-conversion glucose syrup in the whipped mixture and syrup.The control sample was prepared as formulated in Table 1 by whipping an apple-sugar-pectin mixture with egg white and then adding, with constant stirring, confectioner’s syrup with a moisture content of 85.0 ± 0.5% at 85–90°С until the zephyr mass reached a moisture of 33.0 ± 0.5% and a density of 440 ± 10 kg/m3.
The partial or complete replacement of sugar with high-conversion glucose syrup gradually decreased the sweetness of the zephyr mass, intensified the aroma and taste of the fruit puree and flavoring additives (acids, flavors), and increased the mass’s viscosity and strength. The content of reducing substances increased from 16.6% (control) to 38.7% (sample No. 3). Sucrose crystallization slowed down or stopped completely. Larger amounts of high-conversion glucose syrup in the zephyr samples increased the contents of mono- and disaccharides (glucose and maltose), whose molecules are highly hydrophilic, compared to those of sucrose. In particular, they bind moisture better and retain it for a long time, keeping zephyr fresh [13].
Using high-conversion glucose syrup instead of sugar increased the moisture content in the zephyr mass. To obtain the required moisture of 33.5 ± 0.3%, the syrup was boiled down to a higher dry matter content of 86–88%. The content of apple puree was reduced from 23.5% (control) to 20% (sample No. 3) of the total mass in line with State Standard R 702.1.015-2021. After three months of storage, the control and experimental samples No. 1, 2, and 3 had moisture contents of 10.1, 11.5, 12.1, and 14.3%, respectively. Moisture was determined by the refractometric method in accordance with State Standard 5900-2014.
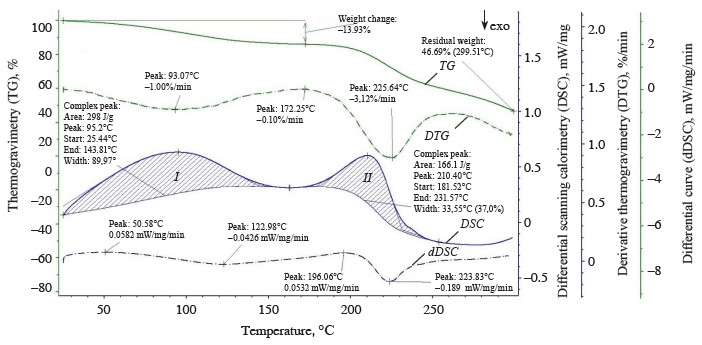
Changes in moisture and its binding forms in the zephyr samples after storage were determined by the differential thermal method involving differential scanning calorimetry (DSC), thermogravimetry (TG), and non-isothermal kinetics. Thermoanalytical curves (thermogravimetry and differential scanning calorimetry), which were used for quantitative processing by the method of non-isometric kinetics, showed changes in temperature, weight, and enthalpy [14]. Particularly, the thermogravimetry curve indicated weight losses caused by increased temperatures; the derivative thermogravimetry (DTG) curve showed the rate of weight losses; and the differential scanning calorimetry curve characterized the thermal effects of reactions at linearly increasing temperatures.
The differential scanning calorimetry method deter mines the direction and magnitude of enthalpy changes associated with changes in the product’s moisture caused by heating. It registers thermal effects in the form of absorbed energy during physical, chemical, and structural changes in the product. The experimental curves show the dependence of the heat flux of absorbed energy on the exposure temperature [15]. The differential scanning calorimetry method measures differences in heat fluxes and temperatures between the experimental samples and the control.
The thermogravimetry method measures changes (losses) in the weight of a sample during its heating in a wide temperature range (from 20 to 300°C), corresponding to various phase transformations of moisture [16].
Thermal curves, or thermograms, resulting from thermal analysis depend on the chemical composition and structure of the sample. The differential scanning calorimetry and thermogravimetry curves are processed using the MS Excel and NETZSCH Proteus software [17]. The resulting DSC and DTG curves show the rate of absorbed energy and the rate of weight loss due to moisture removal by heating, respectively. The dDSC curve determines the rate of absorbed energy at different stages of sample heating, the initial and final temperatures of thermal reactions, and the temperature peaks with maximum rates of moisture evaporation or volatilization of other substances. The region of the derivative thermogravimetry curve with a constant drying rate corresponds to the removal of free moisture, while the region with a decreasing drying rate characterizes the removal of bound moisture [18].
In this study, we used an STA 449 F3 Jupiter synchronous thermal analysis (TG-DSC) apparatus (NETZSCH, Germany) for various gas atmosphere values. This apparatus has the advantages of a highly sensitive thermobalance and a differential scanning calorimeter.
The thermal analysis of the zephyr samples was carried out in the analytical center of Voronezh State University of Engineering Technologies at atmospheric pressure, maximum temperature of 573 K (300°С), and a temperature change rate of 5°С/min. Zephyr samples were placed in 20-µL oxidized aluminum crucibles with a pierced lid. Since zephyr mass foams when heated, the sample weights were lower than the allowable volume of a crucible (12 mg), namely 6.3930, 7.8803, 5.1045, and 8.0919 mg for the control and samples No. 1, 2, and 3, respectively. The crucibles were placed in a nitrogen gas atmosphere of class 5.0, with a flow rate of 60 and 20 mL/min for the active sweeping gas and the protective gas, respectively.
РЕЗУЛЬТАТЫ И ИХ ОБСУЖДЕНИЕ
When heated, zephyr mass gradually loses its free moisture and then bound moisture. This is accompanied by wide endothermic effects characterizing moisture loss and decomposition of nutrients. Moreover, these processes depend on the chemical composition, quantity, and ratio of carbohydrates introduced with sugar and glucose syrup; pectins and dietary fibers introduced with apple puree; protein substances of the foaming agent; and sugar decomposition products forming during the boiling of syrups [19].
High temperature causes significant physical and chemical changes in organic compounds, resulting in moisture release which transforms nutrients inside the product [20]. The weight of zephyr samples decreases due to moisture evaporation, protein denaturation, and carbohydrate decomposition [21].
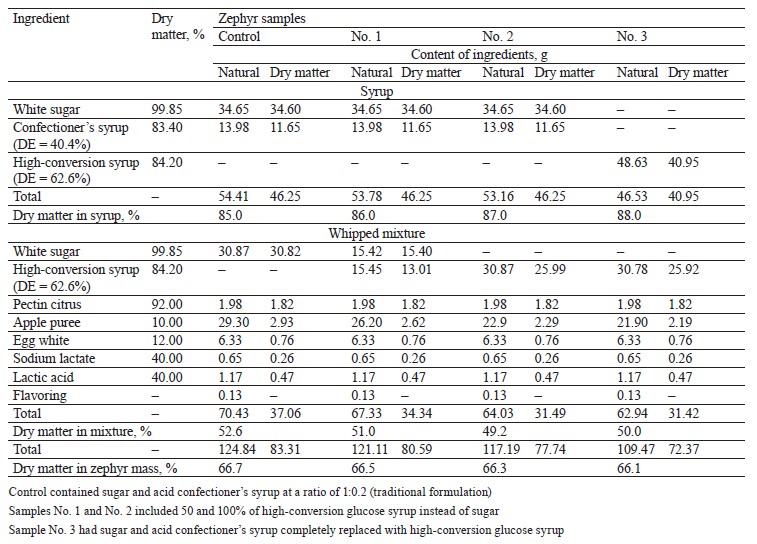
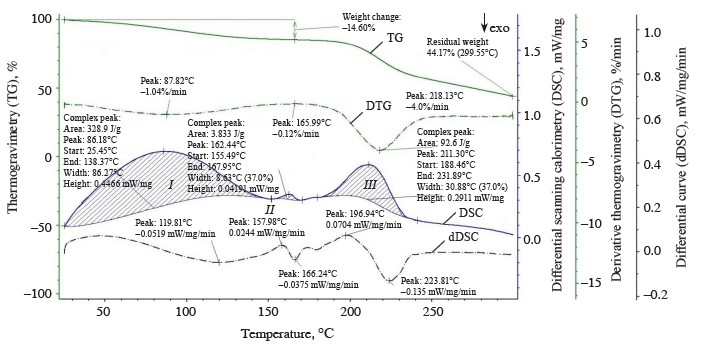
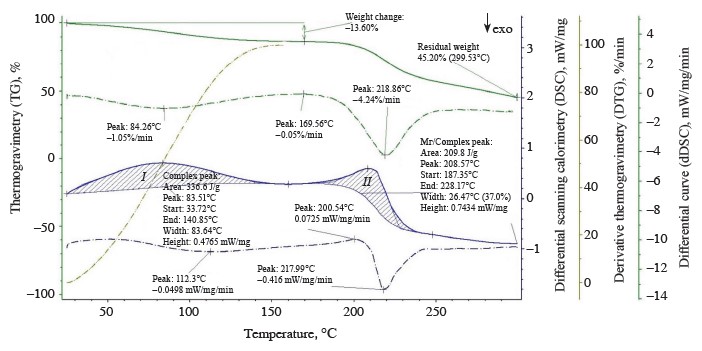
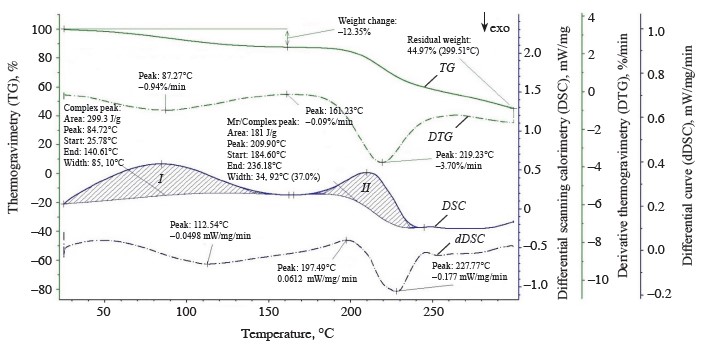
The thermolysis of the zephyr samples in the temperature range from 20 to 300°C is shown in the thermoanalytical curves (Figs. 1–4). As can be seen, the weight of the control sample decreased by 55.83%, with the residual weight of 2.8238 mg or 44.17%; the weight of sample No. 1 decreased by 54.80%, with the residual weight of 3.5619 mg or 45.20%; that of sample No. 2, by 55.03%, with the residual weight of 2.2955 mg or 44.97%; and that of sample No. 3, by 53.31%, the residual weight of 3.7781 mg or 46.69%.
The initial heating of the zephyr samples was in the temperature range of 20–25°C. Further heating intensified moisture removal and, accordingly, increased the energy of breaking the bond between water and the material. The differential scanning calorimetry curves showed a number of endothermic effects characterized by changes in the enthalpy index and accompanied by heat absorption [22]. The thermogravimetry curves revealed changes in the weights of the zephyr samples and peaks of the endothermic effects (differential scanning calorimetry curves). The endothermic effects identified in various temperature ranges (Table 2) indicated a gradual removal of moisture from the samples according to the forms and energy of moisture binding with the biopolymers of the product [23].
During heat exposure, the zephyr samples passed from a structured to a highly elastic state due to moisture removal and many physicochemical processes [24].
The differential scanning calorimetry curve showed three endothermic effects for the control sample (Fig. 1), namely:
1. In the temperature range from 25.45 to 138.37°C, with a large amount of internal energy (328.9 J/g) absorbed at a medium rate (1.04%/min) at the peak of the derivative thermogravimetry curve (t = 87.82°C) and a weight loss of 0.8596 mg (13.44%) (thermogravimetry curve) due to dehydration with a removal of capillary, poly- and monomolecular bound moisture (0.6460 mg) at the beginning of melting, thermal decomposition of monosaccharides (fructose and maltose), denaturation and subsequent decomposition of protein substances, and the formation of various chemical compounds with volatile substances released in the form of gases (0.2136 mg).
2. In the temperature range from 155.49 to 167.95°C, with a small amount of internal energy (3.833 J/g) absorbed at a low rate (0.12%/min) at the peak of the derivative thermogravimetry curve (t = 165.99°C) and a weight loss of 0.0774 mg (1.21%) (thermogravimetry curve) due 1. to the melting of glucose and sucrose, the decomposition and caramelization of fructose and maltose, as well as the formation of anhydrides, reversion (condensation) products, hydroxymethylfurfural, organic (formic and levulinic) acids, and colored compounds (carameline, caramelene), with volatile substances released in the form of gases (0.0774 mg).
3. In the temperature range from 188.46 to 231.89°C, with a small amount of internal energy (92.6 J/g) absorbed at a high rate (4.0%/min) at the peak of the derivative thermogravimetry curve (t = 218.13°C) and a weight loss of 1.5044 mg (23.52%) (thermogravimetry curve) due to the thermal decomposition and caramelization of sucrose and glucose, the formation of anhydrides, reversion products, hydroxymethylfurfural, organic acids, and colored compounds, as well as the decomposition of dextrins and protein substances, with volatile substances released in the form of gases (1.5044 mg).
The differential scanning calorimetry curve revealed two endothermic effects for sample No. 1 (Fig. 2), namely:
1. In the temperature range from 33.72 to 140.85°C, with a large amount of internal energy (336.6 J/g) absorbed at a medium rate (1.05%/min) at the peak of the derivative thermogravimetry curve (t = 84.26°C) and a weight loss of 1.0181 mg (12.92%) (thermogravimetry curve) due to dehydration processes with a removal of capillary, poly- and monomolecular bound moisture (0.9062 mg) and the beginning of melting and thermal decomposition of monosaccharides (fructose, maltose), denaturation and subsequent decomposition of protein substances, and the formation of various chemical compounds with a release of volatile substances in the form of gases (0.1119 mg).
2. In the temperature range from 187.35 to 228.17°C, with a smaller amount of internal energy (209.8 J/g) absorbed at a high rate (4.24%/min) at the peak of the derivative thermogravimetry curve (t = 218.86°C) and a weight loss of 1.7321 mg (21.98%) (thermogravimetry curve) due to the thermal decomposition and caramelization of mono- and disaccharides (sucrose, glucose, fructose, and maltose), the formation of anhydrides, reversion products, hydroxymethylfurfural, organic acids, and colored compounds, as well as the decomposition of dextrins and protein substances into by-products with ta release of volatile substances in the form of gases (1.7321 mg).
The thermolysis of sample No. 2 had two endothermic effects, as shown on the differential scanning calorimetry curve (Fig. 3), namely:
1. In the temperature range from 25.78 to 140.61°C, with a large amount of internal energy (299.3 J/g) absorbed at a medium rate (0.94%/min) at the peak of the derivative thermogravimetry curve (t = 87.27°C) and a loss weight of 0.5972 mg (11.70%) (thermogravimetry curve) due to dehydration processes with a removal of capillary, poly- and monomolecular bound moisture (0.5972 mg) during the denaturation of protein substances and the beginning of melting of monosaccharides (fructose and maltose).2. In the temperature range from 184.6 to 236.18°C, with a smaller amount of internal energy (181.0 J/g) absorbed at a high rate (3.70%/min) at the peak of the derivative thermogravimetry curve (t = 219.23°C) and a weight loss of 1.8892 mg (25.31%) (thermogravimetry curve) due to dehydration with a removal of monomole- cular bound moisture (0.0205 mg) during the thermal decomposition and caramelization of mono- and disaccharides (sucrose, glucose, fructose, and maltose), the formation of anhydrides, reversion products, hydroxymethylfurfural, organic acids, and colored compounds, as well as the decomposition of dextrins and protein substances into by-products with a release of volatile substances in the form of gases (1.292 mg).
The differential scanning calorimetry curve showed two endothermic effects for sample No. 3 (Fig. 4), just as for samples No. 2 and 3, namely:
1. In the temperature range from 25.44 to 143.81°C, with a large amount of internal energy (298.0 J/g) absorbed at a medium rate (1.0%/min) at the peak of the derivative thermogravimetry curve (t = 93.07°C) and a weight loss of 1.0439 mg (12.9%) (thermogravimetry curve) due to dehydration processes with a removal of capillary, poly- and monomolecular bound moisture (1.0439 mg) during the denaturation of protein substances and the beginning of melting of monosaccharides (fructose and maltose).
2. In the temperature range from 181.52 to 231.57°C, with a smaller amount of internal energy (166.1 J/g) absorbed at a high rate (3.12%/min) at the peak of the derivative thermogravimetry curve (t = 225.64°C) and a weight loss of 1.5018 mg (18.56%) (thermogravimetry curve) due to dehydration processes with a removal of monomolecular bound moisture (0.1132 mg) during the thermal decomposition and caramelization of mono- and disaccharides (sucrose, glucose, fructose, and maltose), the formation of anhydrides, reversion products, hydroxymethylfurfural, organic acids, and colored compounds, as well as the decomposition of dextrins and protein substances into by-products with a release of volatile substances in the form of gases (1.3886 mg).
According to our data, the temperature ranges at which the first endothermic effect occurred were wider for the experimental samples than the control, indicative of a higher degree of moisture binding in them. At the beginning of thermolysis, after the first endothermic effect, when the largest amount of free moisture was removed, the enthalpy values were higher for the control and sample No. 1 (328.9 and 336.6 kJ/g, respectively) than for samples No. 2 and 3 (299.3 and 298.0 kJ/g, respectively). This explains the greater decrease in the weight of the control and sample No. 1 (13.44 and 12.92%, respectively) compared to samples No. 2 and 3 (11.7 and 12.9%, respectively). At this stage of dehydration, the control and sample No. 1 not only lost capillary, poly- and monomolecular bound moisture, but also began to undergo the processes of melting and thermal decomposition of monosaccharides and protein substances into by-products. With further heating, the weight of the control and sample No. 1 decreased by 24.73 and 21.98%, respectively, while the weight of samples No. 2 and 3 reduced by 25.31 and 18.56%, respectively. The total weight loss after thermolysis amounted to 38.17, 34.90, 37.01, and 31.46% for the control and experimental samples No. 1, 2, and 3, respectively. The total amount of by-products was 1.7954, 1.844, 1.292, and 1.3886 mg for the control and samples No. 1, 2, and 3, respectively.
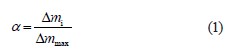
To quantify the changes in moisture and the forms of its binding with the sample components, the dependence between weight change on the thermogravimetry curves and dehydration in the specified temperature ranges is converted into the dependence between the degree of weight change, or the degree of substance transformation (α, mg/mg), and the heating temperature (T, K) [25]. For this, weight changes (Δmi, %) were registered on the thermogravimetry curves at certain temperatures after
every rise of 5°C, which corresponded to the amount of water released at temperature Тi. The indicator α was calculated as a ratio of the current weight change (Δmi) at a certain time (τi) to the total weight change at the end of dehydration (Δmmax, %) according to the formula [26]:
Based on the thermogravimetry curves (Figs. 1–4), we presented the initial weights of the zephyr samples (mi), their changes during thermolysis (Δmi), and the α indicator in the temperature range from 24 to 183°C (Table 3). After three months of storage, the moisture contents, as determined by the arbitration method, were 10.1, 11.5, 12.1, and 14.3% in the control and samples No. 1, 2, and 3, respectively.
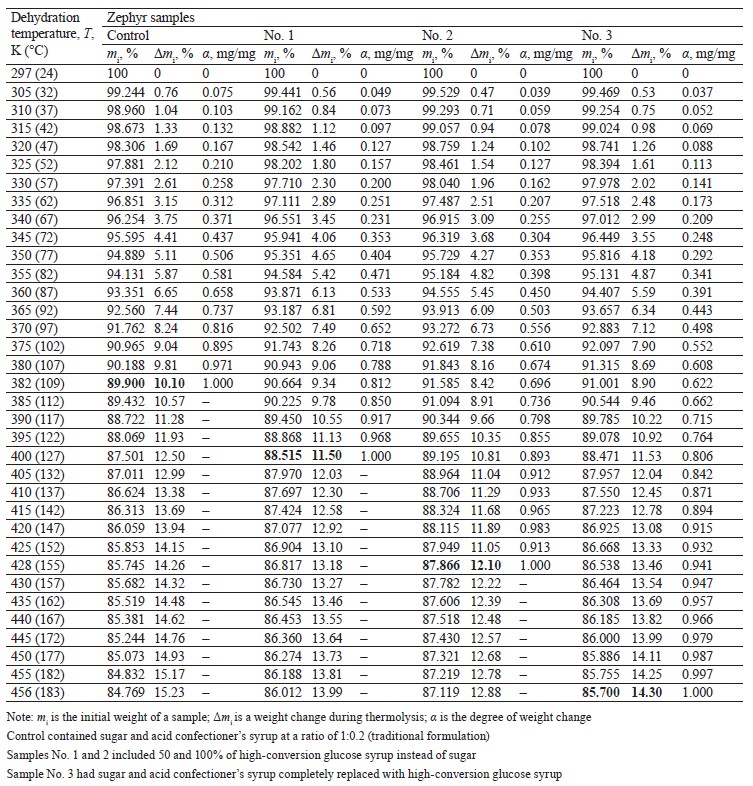
Figure 5 shows graphical dependences between moisture changes in the zephyr samples and thermolysis temperatures in the range from 24 to 183°C.
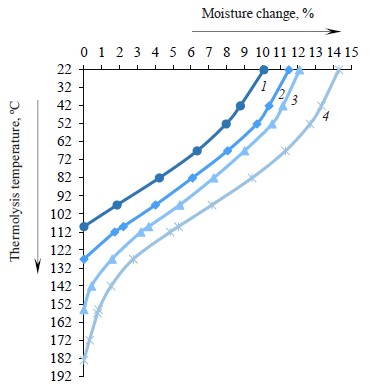
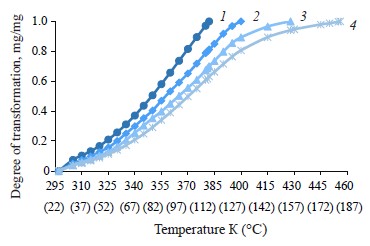
The dependence curves α = f(T) (Fig. 6) have an S-shaped form [27] which shows a complex nature of interaction between water and dry substances in the zephyr samples and the process of dehydration with different rates of release of moisture and binding energy at different stages of thermal analysis [28]. These curves reveal various kinetically unequal forms of moisture binding in the samples at different rates of dehydration.
To establish the forms of moisture binding and the mechanism of moisture removal in the zephyr samples, we used the curves in the α-Т coordinates, as well as the data on temperature ranges and the amounts of bound moisture, and plotted the same curves in the coordinates (–lgα)-(103/Т). The dependences –lgα = f (103/Т) were made for the temperature range of 297–456 K (Fig. 7) [29–31].
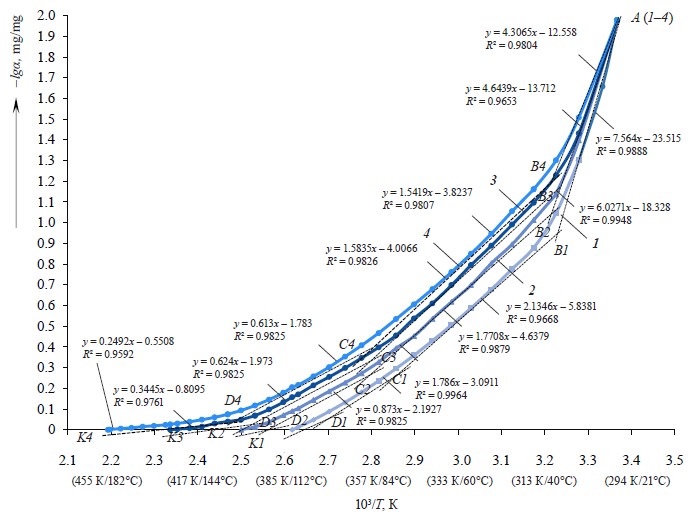
Based on the curves showing graphic dependences between the changes in α converted into (–lgα) and the changes in temperature (103/Т), we identified four stages of dehydration of the zephyr samples with a removal of moisture in various forms and with different binding energy. The curves that indicate weight changes at certain temperatures had characteristic inflection points Вi, Ci, and Di, showing changes in degradation. The graphic dependences (Fig. 7) were approximated in the form of four-line splines in order to establish the rates of moisture removal in relation to the energy levels of moisture binding in the samples [32, 33]. Approximating curves were constructed for each temperature range, which were linear in nature (R2 ≈ 1).
Four linear sections marked with a dash-dotted line (Fig. 7) confirm a gradual (stage by stage) removal of moisture depending on the forms of its binding with biopolymers [34, 35] in the zephyr samples with different carbohydrate profiles, namely:
– stage 1 (section АiВi) characterizes the removal of free, physically and mechanically bound (capillary-bound) moisture from zephyr micro- and macrocapillaries (pores) that has a low energy of binding with the material (the desorption of capillary moisture has a lower activation energy compared to the moisture released in the second stage) [36];
– stage 2 (section ВiCi) characterizes the removal of physically and chemically bound (capillary- and polymolecule-bound) moisture that is more strongly bound with zephyr nutrients than capillary moisture and is mainly contained in the form of hydrated moisture in the closed cells of nutrient micelles and around carbohydrate molecules [27];
– stage 3 (section СiDi) characterizes the removal of physically and chemically bound (poly- and monomo- lecular bound) moisture during the partial decomposition of nutrients that is strongly bound with nutrients and is involved in the swelling of proteins, pectins, and dietary fibers [37, 38]; and
– stage 4 (section DiКi) characterizes the removal of physically and chemically bound (poly- and monomo- lecular bound) moisture and gaseous substances formed during the decomposition of nutrients.
Table 4 shows the degrees of transformation (Δα) corresponding to the four-stage dehydration kinetics of the zephyr samples with different carbohydrate profiles.
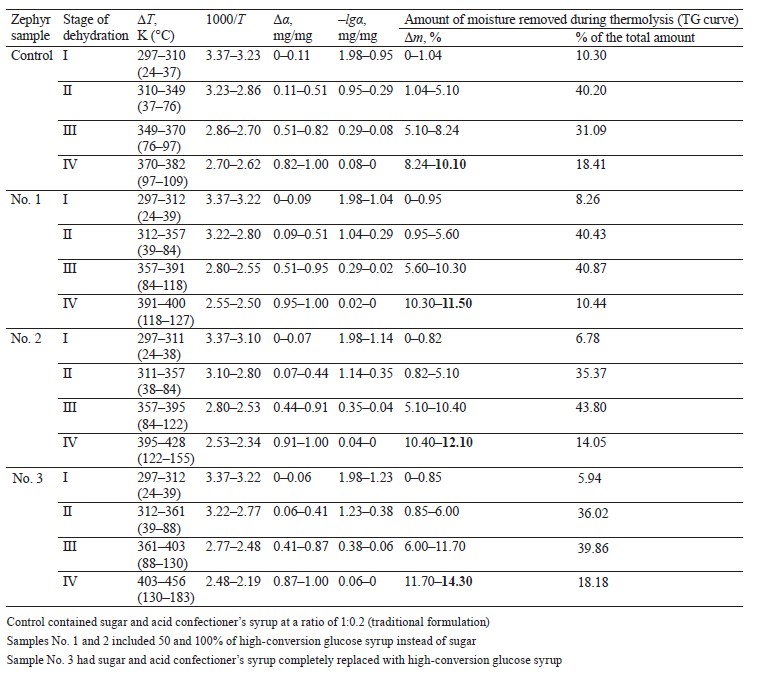
As can be seen, the first section (А1В1–А4В4), which refers to the temperature range of 297–312 K (24–39°C), is where the “water-water” bonds are destroyed and the “free”, physically and mechanically bound (capillarybound) moisture is released from the surface of the zephyr samples in insignificant amounts: 10.30, 8.26, 6.78, and 5.94% for the control and samples No. 1, 2, and 3, respectively.
The second section (В1C1–В4C4) refers to a more intensive removal of physically and chemically bound (capillary- and polymolecular bound) moisture in the temperature range of 310–361 K (37–88°С) in the following amounts: 40.20, 40.43, 35.37, and 36.02% for the control and samples No. 1, 2, and 3, respectively.
The third section (С1D1–С4D4) is where physically and chemically bound (poly- and monomolecular bound) moisture is removed in the temperature range of 349–403 K (76–130°С) in the following amounts: 31.09, 44.35, 43.80, and 39.86% for the control and samples No. 1, 2, and 3, respectively.The last section (D1К1–D4К4) refers to the removal of physically and chemically bound (poly- and mono- molecular bound) moisture and gaseous substances in the temperature range of 370–456 K (97–183°С) in the following amounts: 18.41, 10.44, 14.05, and 18.18% for the control and samples No. 1, 2, and 3, respectively.
ВЫВОДЫ
In this study, we used thermal analysis to determine the content of moisture and forms of its binding in zephyr during storage. The samples in which sugar and confectioner’s syrup were partially or completely rep- ced with high-conversion glucose syrup gradually lost some of their sweetness and had a more pronounced taste and smell of fruit puree, as well as flavoring agents, a higher degree of moisture binding due to an increased content of reducing sugars (glucose and maltose), and slower, or completely eliminated, crystallization of sucrose during storage.
In addition, the samples had a lower content of fructose (or no fructose at all), a highly hygroscopic sugar formed during the boiling of glucose syrup that contributes to a rapid wetting of zephyr. Although glucose and maltose are less hygroscopic, they are highly hydrophilic – they bind moisture firmly and retain it for a long time, keeping zephyr fresh.
The thermal analysis of the zephyr samples with different carbohydrate profiles showed that at the initial stage of dehydration, the largest amount of “free”, physically and mechanically bound moisture was removed from the control sample, which had a lower content of reducing sugars and dextrins. The wider temperature ranges in all sections of heating of the experimental samples indicated a higher content of physically and chemically bound moisture in them, compared to the control. Therefore, replacing sugar and confectioner’s syrup with high-conversion glucose syrup results in less “free”, capillary-bound moisture and more poly- and monomolecular bound moisture in zephyr. This is due to a higher content of reducing sugars which have high hydrophilic properties allowing them to firmly bind and retain moisture for a long time, prolonging the freshness of zephyr and slowing down its drying during storage [39].
The differential thermal analysis used to assess moisture and forms of its binding in zephyr samples with different carbohydrate profiles allowed us to determine the effect of high-conversion glucose syrup on the content of free and bound moisture in zephyr and to predict a possibility of extending its freshness during storage. In the future, our results may be used to create a database of ingredients that contribute to the product’s quality and extended shelf life.
Вклад авторов
I.V. Plotnikova developed the research concept, prosed a methodology for the experiment, and edited the manuscript for submission. G.O. Magomedov supervised and monitored the experiment. D.A. Kazartsev processed the experimental data, performed calculations, and edited the manuscript for submission. M.G. Magomedov processed the experimental data and advised on the experiment. K.K. Polansky organized the production tests and advised on the experiment. V.E. Plotnikov reviewed literary sources on the research problem and conducted the experiment. All the authors were equally involved in writing the manuscript and are equally responsible for plagiarism.
КОНФЛИКТ ИНТЕРЕСОВ
The authors declare no conflict of interest regarding the publication of this article.
БЛАГОДАРНОСТИ
We thank the Center for Control and Management of Energy Efficient Projects at Voronezh State University of Engineering Technologies for providing an STA 449 F3 Jupiter apparatus for synchronous thermal analysis.СПИСОК ЛИТЕРАТУРЫ
- Soldatova EA, Misteneva SYu, Savenkova TV. Conditions and criteria for ensuring the storage ability of confectionery. Food Industry. 2019;(5):82–85. (In Russ.). https://doi.org/10.24411/0235-2486-2019-10078
- Ketel EC, de Wijk RA, de Graaf C, Stieger M. Effect of cross-cultural differences on thickness, firmness and sweetness sensitivity. Food Research International. 2020;152. https://doi.org/10.1016/j.foodres.2020.109890
- Herremans E, Bongaers E, Estrade P, Gondek E, Hertog M, Jakubczyk E, et al. Microstructure – texture relationships of aerated sugar gels: Novel measurement techniques for analysis and control. Innovative Food Science and Emerging Technologies. 2013;18:202–211. https://doi.org/10.1016/j.ifset.2013.02.003
- Iijima M, Hatakeyama T, Hatakeyama H. DSC and TMA studies of polysaccharide physical hydrogels. Analytical Sciences. 2021;37:211–219. https://doi.org/10.2116/analsci.20SAR10
- Frolova YuV, Sobolev RV, Sarkisyan VA, Kochetkova AA. Effect of polysaccharide compounds on the stability of oil-in-water emulsions during storage. Food Processing: Techniques and Technology. 2022;52(1):32–45. (In Russ.). https://doi.org/10.21603/2074-9414-2022-1-32-45
- Wang Y, Truong T, Li H, Bhandari B. Co-melting behaviour of sucrose, glucose & fructose. Food Chemistry. 2019;275:292–298. https://doi.org/10.1016/j.foodchem.2018.09.109
- Gunes R, Palabiyik I, Konar N, Toker OS. Soft confectionery products: Quality parameters, interactions with processing and ingredients. Food Chemistry. 2022;385. https://doi.org/10.1016/j.foodchem.2022.132735
- Sánchez M, Gomez J, Giraldo C. Effect of the incorporation of polyols, fructooligosaccharides and antihypertensive peptides in a deposited masmelo. Revista Colombiana de Investigaciones Agroindustriales. 2022;9(2):1–14. (In Spanish).
- Plotnikova IV, Magomedov GO, Zharkova IM, Miroshnichenko EN, Plotnikov VE. Jelly formulated with different carbohydrate profiles: Quality evaluation. Foods and Raw Materials. 2022;10(2):262–273. https://doi.org/10.21603/2308-4057-2022-2-535
- Khvostov AA, Magomedov GO, Ryazhskih VI, Plotnikova IV, Zhuravlev AA, Magomedov MG. Cooling caramel in ethyl alcohol: Constructing a mathematical model. Food Processing: Techniques and Technology. 2020;50(3):425–438. (In Russ.). https://doi.org/10.21603/2074-9414-2020-3-425-438
- Magomedov GO, Plotnikova IV, Kuznetsova IV, Naumchenko IS, Saranov IA. The study of forms of bonding marshmallow moisture with different composition by method of thermal analysis. Proceedings of the Voronezh State University of Engineering Technologies. 2017;79(3):42–50. (In Russ.). https://doi.org/10.20914/2310-1202-2017-3-42-50
- Plotnikova IV, Magomedov MG, Zanudina TG. Method of preparation of marshmallow. Patent RU 2674629C1. 2018.
- Kondratyev NB, Kazantsev EV, Osipov MV, Bazhenova AE, Linovskaya NV. The influence of the amount of caramel syrup on the processes of moisture transfer during the storage of marmalade. Proceedings of the Voronezh State University of Engineering Technologies. 2020;82(4):24–29. (In Russ.). https://doi.org/10.20914/2310-1202-2020-4-24-29
- Parniakov O, Bals O, Barba FJ, Mykhailyk V, Lebovka N, Vorobiev E. Application of differential scanning calorimetry to estimate quality and nutritional properties of food products. Critical Reviews in Food Science and Nutrition. 2018;58(3):362–385. https://doi.org/10.1080/10408398.2016.1180502
- Tutunchi P, Roufegarinejad L, Hamishehkar H, Alizadeh A. Extraction of red beet extract with β-cyclodextrin-enhanced ultrasound assisted extraction: A strategy for enhancing the extraction efficacy of bioactive compounds and their stability in food models. Food Chemistry. 2019;297. https://doi.org/10.1016/j.foodchem.2019.124994
- Kawai K, Uneyama I, Ratanasumawong S, Hagura Y, Fukami K. Effect of calcium maltobionate on the glass transition temperature of model and hand-made hard candies. Journal of Applied Glycoscience. 2019;66(3):89–96. https://doi.org/10.5458/jag.jag.JAG-2019_0005
- Mayhew EJ, Schmidt SJ, Lee S-Y. Sensory and physical effects of sugar reduction in a caramel coating system. Journal of Food Science. 2017;82(8):1935–1946. https://doi.org/10.1111/1750-3841.13785
- Kazantseva IL. Research of forms of a moisture communication in the raw materials and the finished confectionery by thermal analysis method. Storage and Processing of Farm Products. 2015;(7):36–40. (In Russ.). https://elibrary.ru/UNXXSH
- Rodionova NS, Popov ES, Klimova EA, D'yakov AA. The influence of natural biocorrectors on the forms of communication of moisture and storage of confectionery with honey. Food Industry. 2019;(11):16–19. (In Russ.). https://doi.org/10.24411/0235-2486-2019-10170
- Rivero R, Archaina D, Sosa N, Leiva G, Baldi Coronel B, Schebor C. Development of healthy gummy jellies containing honey and propolis. Journal of the Science of Food and Agriculture. 2020;100(3):1030–1037. https://doi.org/10.1002/jsfa.10107
- Rodionova NS, Popov ES, Matveev DI, Pevtsova ES, Sokolova AV, Diakov AA. Vegetable biocorrectors influence on the moisture state in functional purpose flour products. Proceedings of the Voronezh State University of Engineering Technologies. 2019;81(1):190–195. (In Russ.). https://doi.org/10.20914/2310-1202-2019-1-190-195
- Rodionova NS, Popov ES, Rodionov AA, Razinkova TA. Assessment of the exopolysaccharide activity of probiotic consortia using differential thermal analysis. Proceedings of Universities. Applied Chemistry and Biotechnology. 2018;8(4):95–105. (In Russ.). https://doi.org/10.21285/2227-2925-2018-8-4-95-105
- Rodionova NS, Razinkova TA, Popov ES, Polyansky KK, Rodionova NA, Zarubina KYu, et al. Exopolysaccharide activity of probiotic microorganisms under different fermentation regimes. Dairy Industry. 2020;(4):28–30. (In Russ.). https://elibrary.ru/ORYXJJ
- Mardani M, Yeganehzad S, Ptichkina N, Kodatsky Yu, Kliukina O, Nepovinnykh N, et al. Study on foaming, rheological and thermal properties of gelatin-free marshmallow. Food Hydrocolloids. 2019;93:335–341. https://doi.org/10.1016/j.foodhyd.2019.02.033
- Ostrikov AN, Kuznetsova IV, Glukhov MA, Rudometkin AS. Differential thermal analysis of wheat and bean mixture. Transactions of the TSTU. 2007;13(1):95–100. (In Russ.). https://elibrary.ru/KARYOJ
- Ostrikov AN, Napolskikh MS. Differential thermal analysis for the study of bonds between moisture of vegetable-meat mixture conatining lupin, lentil and sublimated meat. Problems of Contemporary Science and Practice. Vernadsky University. 2012;42(4):335–339. (In Russ.). https://elibrary.ru/PJVSTH
- Ozcan Y, Icyer NC, Ozmen D, Toker OS. Effect of soapwort extract as an alternative to albumin on the physical, textural, sensory, and rheological properties of marshmallow. Journal of Food Processing and Preservation. 2022;46(11). https://doi.org/10.1111/jfpp.16931
- Pozhidaeva EA, Popov ES, Ilyushina AV, Bolotova NV, Ivanova EV. Study of the forms of moisture binding in curd products by differential scanning calorimetry and thermogravimetry. Food Industry. 2018;(11):73–77. (In Russ.). https://elibrary.ru/YQIENF
- Sánchez-Romero MA, García-Coronado P, Rivera-Bautista C, González-García R, Grajales-Lagunes A, Abud-Archila M, et al. Experimental data and predictive equation of the specific heat capacity of fruit juice model systems measured with differential scanning calorimetry. Journal of Food Science. 2021;86(5):1946–1962. https://doi.org/10.1111/1750-3841.15693
- Shakhov SV, Saranov IA, Sadibaev AK, Malibekov AA, Litvinov EV, Gruzdov PV. The research of moisture forms in the rape by the thermogravimetric analysis method. Proceedings of the Voronezh State University of Engineering Technologies. 2019;81(1):27–31. (In Russ.). https://doi.org/10.20914/2310-1202-2019-1-27-31
- Jakubczyk E, Gondek E, Kamińska-Dwórznicka A, Samborska K, Wiktor A, Królikowski K. A complex approach to assessing properties of aerated agar-fructose gels: Application of acoustic emission technique. Food Hydrocolloids. 2019;91:66–75. https://doi.org/10.1016/j.foodhyd.2019.01.013
- Jakubczyk E, Kamińska-Dwórznicka A. Effect of addition of chokeberry juice concentrate and foaming agent on the physical properties of agar gel. Gels. 2021;7(3). https://doi.org/10.3390/gels7030137
- Kondratiev NB, Osipov MV, Petrova NA. Management of fat and moisture migration processes during confectionery storage. Food Products Commodity Expert. 2022;(5):352–354. (In Russ.). https://doi.org/10.33920/igt-01-2205-17
- Delgado P, Bañón S. Effects of replacing starch by inulin on the physicochemical, texture and sensory characteristics of gummy jellies. CyTA – Journal of Food. 2017;16(1):1–10. https://doi.org/10.1080/19476337.2017.1327462
- Mariz de Avelar MH, de Castilho Queiroz G, Efraim P. Sustainable performance of cold-set gelation in the confectionery manufacturing and its effects on perception of sensory quality of jelly candies. Cleaner Engineering and Technology. 2020;1. https://doi.org/10.1016/j.clet.2020.100005
- Kurt A, Bursa K, Toker OS. Gummy candies production with natural sugar source: Effect of molasses types and gelatin ratios. Food Science and Technology International. 2022;28(2). https://doi.org/10.1177/1082013221993566
- Moghaddas Kia E, Ghaderzadeh S, Mojaddar Langroodi A, Ghasempour Z, Ehsani A. Red beet extract usage in gelatin/gellan based gummy candy formulation introducing Salix aegyptiaca distillate as a flavouring agent. Journal of Food Science and Technology. 2020;57(9):3355–3362. https://doi.org/10.1007/s13197-020-04368-8
- Danilchenko AS, Siyukhov KhR, Korotkova TG, Siyukhova BB. Determination of the content of free and attached moisture in spent grain. New Technologies. 2020;15(4):41–52. (In Russ.). https://doi.org/10.47370/2072-0920-2020-15-4-41-52
- Kondratiev NB, Rudenko OS, Osipov MV, Bazhenova AE. Forecasting the shelf life of confectionery products under accelerated storage conditions: scoping review. Storage and Processing of Farm Products. 2022;(4):22–39. (In Russ.). https://doi.org/10.36107/spfp.2022.354
