

Аннотация
The Quality Index Method (QIM) provides a quick and accurate quality assessment. It makes it possible to calculate preserving time and establish the freshness of sea food. This article introduces a quality assessment program based on the QIM scheme and quality index (QI) for the Jinga shrimp.The research included Jinga shrimps (Metapenaeus affinis L.), a commercially valuable aquatic species widely distributed throughout the Vietnamese coast. The input data included the changes in appearance and sensory profile of sampled shrimps during 20 days of storage at 0–4°C in ice water.
They were used to construct a QIM scale, which was applied to other shrimp samples at different storage time to evaluate the relationship between the QI score and the storage time. After that, the QIM scale was tested on ten random shrimp samples to verify its shelf-life predictive power. This study managed to establish a correlation equation between the QI scores and the storage time with the coefficient of R2= 0.97. This correlation proved highly reliable as verified by comparing the predicted and actual best shelf life of Jinga shrimps stored in ice water for 8–10 days.
The QIM program provides a practical and effective science-based tool that delivers fast and reliable results for customers, fishermen, food traders, and aquacultural enterprises.
Ключевые слова
Jinga shrimp, sensory evaluation, quality index method, storage time, ice storage, shelf lifeВВЕДЕНИЕ
Consumers assess food products according to their sensory properties [1, 2]. Sensory evaluation is necessary to commercialize a food product. It is especially important for seafood, since freshness is the most important aspect of fisheries and aquaculture products [3, 4]. Wholesalers often use ice water to store shrimps in fishing vessels or processing facilities. However, the quality of fresh aquatic raw materials, especially raw shrimps, degrades very quickly during storage. Therefore, all stakeholders need a quick and efficient method to assess the freshness of aquatic products.
Sensory assessment is a scientific method used to evoke, measure, analyze, and interpret sensations that are perceived through sight, smell, taste, touch, and hearing [5]. For marine seafood, sensory assessment is fast, cheap, and effective. The list of contemporary aquatic sensory assessment methods includes the EUscheme, the Quality Index Method, and the Torry Sensory Analysis [6]. The Quality Index Method (QIM) is an especially fast and reliable means of measuring the freshness of seafood [7, 8]. QIM tests the significant levels of such attributes as skin, slime, eyes, abdomen, smell, etc. of aquatic products. These attributes are indicated in the table of assessment guidelines with scores from 0 to 3. Quality Index (QI) is the total score. If the QI value is close to zero, the product is considered fresh, whereas a higher QI value indicates that the product has degraded. Each aquatic species has its own QIM [9, 10]. QIM has an obvious advantage over the conventional classification method commonly used for seafood raw materials: the QI is the sum of all attribute variations. As a result, food scientists can establish a linear relationship between the QI score and the ice-preserving time, thereby estimating the storage period [11, 12].
Shrimps go through a number of physical and chemical transformations from catch to death. These processes cause sensory changes in appearance, texture, and color during the storage period. Discoloration is a common phenomenon in aquatic products. In shrimps, suboptimal preservation might cause immediate black spots called melanosis. This phenomenon was first reported in 1951 [13]. Originally, scientist attributed melanosis to the activity of microorganisms although today it is concluded to be the oxidation of polyphenoloxidase enzymes in shrimp and crabs [14, 15]. In shrimps, the color depends on the close connection between pigments and proteins. This association makes shrimps shiny blue while alive. When boiled, shrimps turn reddish pink. When shrimps are alive, astaxanthin pigment exists in the form of a protein bond that creates the characteristic color. When shrimps die, this bond weakens and disappears under the impact of temperature and light, separating from the protein and creating a new red color [16].
Many contemporary studies apply QIM to evaluate the transformation of sensory quality in Northern shrimps (Pandalus borealis L.), white-leg shrimps (Lipopenaeus vannamei L.), and giant tiger prawns (Penaeus monodon L.) [17–22].
Jinga shrimps (Metapenaeus affinis L.) are harvested by shrimp trawls. In Vietnam, Jinga shrimps are widely distributed throughout the North-South coast [23]. Jinga shrimps have a water content of 77–79% and lipids of 1–2%, which is higher than in other shrimp species. These two characteristics affect the spoiling process, thus, requiring appropriate post-harvest preservation methods [24]. Considering the importance of maintaining the quality, we developed a program using the quality index method to evaluate the sensory quality transformation of the Jinga shrimp (M. affinis) during ice-water storage.
ОБЪЕКТЫ И МЕТОДЫ ИССЛЕДОВАНИЯ
Study objects. This study introduces a new program that applies the Quality Index Method (QIM) to the sensory assessment of Jinga shrimps (Metapenaeus affinis L.) during ice water storage.
Research materials. The research involved fresh Jinga shrimps, 30–35 shrimps/kg, harvested near Do Son at Hai Phong Port, the biggest port city in Northern Vietnam, in October 2019 and November 2020.
The shrimps were stored in insulated ice crates with a shrimp/ice ratio of 1:2 (w/w) and transported to the Marine Science Laboratory of the Seafood Research Institute (Hai Phong, Vietnam). There, the shrimps were put into plastic boxes, which were filled with ice up to the ratio of 1:2 (w/w) and water up to the ice surface. The boxes were kept in a refrigerator at 0–4°C. Ice supplements and water withdrawal were made every two days. Samples for analysis and sensory evaluation were taken daily, from fresh (day 0) until spoiled (day 20).
Methodology. Methodology for developing the QIM program for Jinga shrimps.
Developing terms to describe changes in sensory profile of shrimps stored in ice water. Panelists were selected and trained according to TCVN 12388-2:2018 Sensory analysis – General guidance for the staff of a sensory evaluation laboratory – Part 2: Recruitment and training of panel leaders. The terms to describe the changes in texture, smell, and color were collected from direct observation of the study samples and from previous studies (TCVN 11182:2015 Sensory analysis – Vocabulary, TCVN 12614:2019 Frozen – Black tiger, Vannamei shrimp) [20–22, 25]. The trained panelists selected the terms by extensive discussion. According to the selection criteria, the terms were to be concise, clear, familiar, and easy to understand.
Formulating and developing the QIM scheme for Jinga shrimps. The QIM program included the following steps:
Step 1. Preliminary program: three to five experts of the Seafood Research Institute were tasked to observe and record all changes in quality attributes (color and structure of head, legs, and body; meat texture; smell) and set the terms in the preliminary program. Each attribute was scored from 0 to 3, with the lowest score for the best quality.
Step 2. QIM program and panel training: the shrimps were stored at 0–4°C and evaluated daily for 20 days. The shrimps were stored at different intervals in ice, as described in Section 2.1. Six experts participated in the training sessions for the panelists. During the training, the panelists received the information on the storage time to associate the attribute changes with the time. Next, they performed the assessment without information about the storage time to guarantee reliable and accurate evaluation results.
Step 3. Practicing the QIM program: the panelists collected ten samples of Jinga shrimps (samples T01–T10) stored in ice water and evaluated them according to the QIM program, as described in Step 2. The correlation equation between the storage time and the quality score was used to determine the stored time and the remaining shelf life of the shrimps to be compared with the actual storage shelf life.
Quality index (QI) scoring method. The method of calculating QI followed the procedure described in [26]. The quality index was calculated according to the following Eq. (1):
![]()
where QI was the sensory quality index (average total sensory quality score); QI1,..., QIn stood for the total sensory quality score of each member of the evaluation board; n denoted the number of panelists; i was the number of the panelist; m was the number of shrimp attributes recorded in the QIM table (m depends on the species); t denoted the number of sensory scores of the panelist for each shrimp attribute; and k1... km were shrimp attributes.
Data analysis methods. The data collected were analyzed using descriptive statistics (mean, standard deviation). The difference in the factors between the modal tests was analyzed by ANOVA 1 factor (p < 0.05) using the Statgraphic XV software and the Excel software. Each experiment was conducted three times, resulting in an average of total experiments.
РЕЗУЛЬТАТЫ И ИХ ОБСУЖДЕНИЕ
Results of recording the transformation and selection of terminology according to the storage time. The goal of the research was to document the changes in the sensory properties of Jinga shrimps stored in ice, including color, texture, smell, etc. Preference belonged to the terms with the highest frequency of occurrence in a given period.
Term selection results for smell. The shrimp smell changed at different stages.
Stage 1 (days 0–4). The shrimps still retained the characteristic fresh smell described as “the smell of the sea”, with a high frequency of occurrence > 80% (Fig. 1). After this period, the shrimp smell began to change.
Stage 2 (days 4–8). Most samples were reported to have a slightly fishy smell of seaweed.
Stage 3 (days 8–14). The shrimps smelled fishy or of weak ammonia. The unmistakable fishy smell was more frequent, but both descriptions appeared for a long time and in the same period. Both descriptions were found fit to describe the shrimp smell at this stage.
Stage 4 (days 14–20). The clear ammonia and putrid odor clearly indicated that the shrimps went bad.
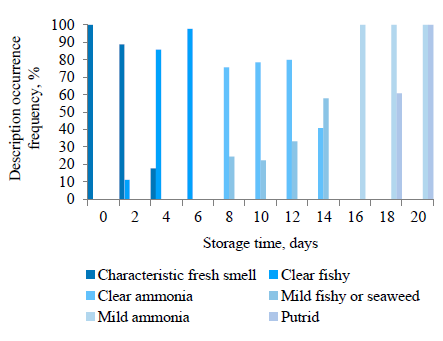
The terms selected to describe the smell of shrimps ranked as follows: characteristic fresh shrimp smell → smell of seaweed/mild fishy → clear fishy/mild ammonia → clear ammonia/putrid.
Term selection results for color. Shrimp head color. The shrimp head color change occurred in four stages (Fig. 2):
Stage 1 (days 0–2). The color was almost unanimously described as a clear and shiny yellow. The description of a bright, pink color (< 5%) was not selected due to the low frequency, and it was registered only on day 0.
Stage 2 (days 2–8). The two most frequent descriptions included a less clear color (light yellow) and reduced gloss (> 80%).
Stage 3 (days 8–14). The shrimp heads were described as pale pink-orange. This description had a high frequency and appeared on many days. Black grey also was reported during this period; however, its frequency was low.
Stage 4 (days 14–20). The shrimp heads were orangepink, black, grey, orange, and orange-red. The descriptions were persistent and appeared during the spoilage stage.
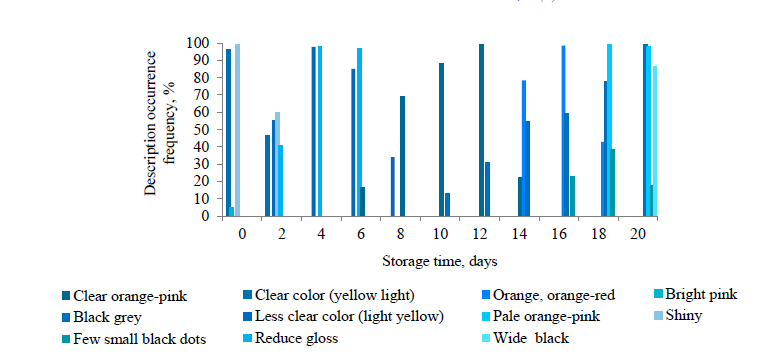
The terms selected to describe the color of shrimp heads ranked as follows: clear color (yellow)/shiny → less clear color (light yellow)/reduced gloss → pale orange pink → clear orange-pink, orange, orange-red, black grey.
Shrimp body color. Figures 3 demonstrates the color variation of the shrimp body:
Stage 1 (days 0–2). The color remained clear and shiny. The green dots on the body were distinct.
Stage 2 (days 2–10). The shrimp body color became less clear; the gloss decreased, and the green dots on the body grew slightly faded.
Stage 3 (day 10–16). The shrimp body turned orange; the dots became faint.
Stage 4 (days > 16). The body lost its color and turned dark orange; the green dots became blurred, and black spots started to appear.
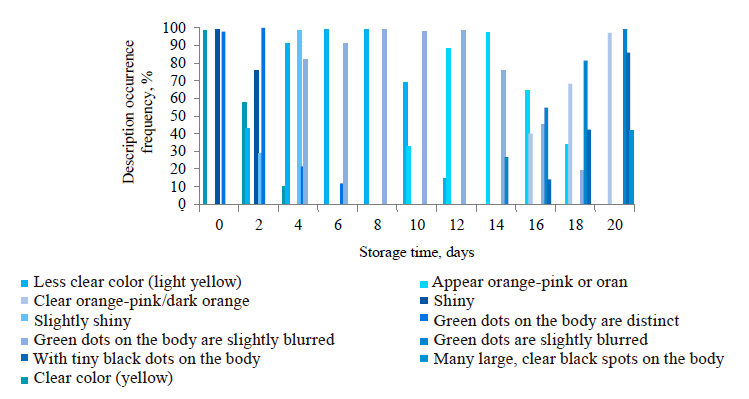
Multiple descriptions were selected for each stage to provide a detailed description of shrimp body. The terms depicting the color variation of shrimp body were selected as follows: shiny clear color, green dots on the body are distinct → color is less apparent; gloss is reduced (slightly shine); green dots are slightly blurred → appear orange-pink/orange starts to appear; green dots are slightly blurred, with tiny black dots → clear orangepink/ dark orange; the green dots are blurred; many large, clear black spots start to appear.
Shrimp leg color. Figure 4 shows the color terms that depict the changes in shrimp legs:
Stage 1 (days 0–2). The legs were bright yellow.
Stage 2 (days 2–8). The yellow color grew lighter (> 60%).
Stage 3 (days 8–14). The shrimp legs showed signs of blackening.
Stage 4 (days 14–20). They turned black.
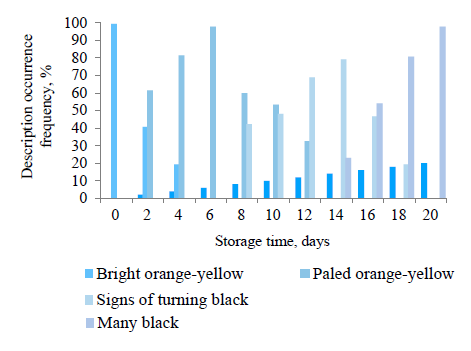
The terms to describe the change in the color of the shrimp legs were selected as follows: bright orangeyellow → pale orange-yellow → signs of turning black black.
Shrimp meat color. Figure 5 shows the terms that be the color of shrimp meat in four stages:
Stage 1 (days 0–4). The shrimp meat was delicate white (> 60%).
Stage 2 (days 4–10). The meat lost its translucency and turned white.
Stage 3 (days 10–16). The meat was opaque white.
Stage 4 (days 16–20). The shrimp meat was pale yellow or pale pink, and small black spots started to appear.
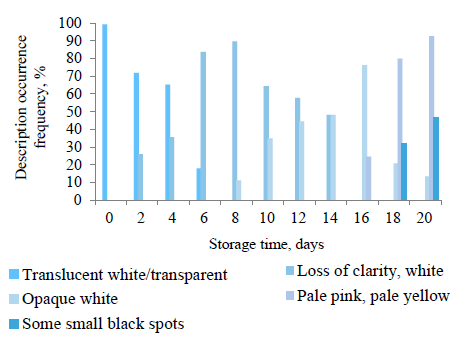
The terms to describe the changes in the color of shrimp meat ranked as follows: translucent white/ transparent → loss of clarity, turning white → opaque white → pale pink, pale yellow, with some small black spots.
Term selection results for structure/state. Shrimp head structure. Figure 6 shows the way shrimp head structure changed with storage time:
Stage 1 (days 0–4). The shrimp heads were intact and firmly attached to the bodies; all the samples got this description with a very high frequency.
Stage 2 (days 4–6). The heads began to show signs of loosening from the body (> 70%).
Stage 3 (days 6–16). The shrimp heads began to loosen, with signs of tomalley dilution.
Stage 4 (days 16–20). The shrimp heads demonstrated crushed tomalley and fell off.
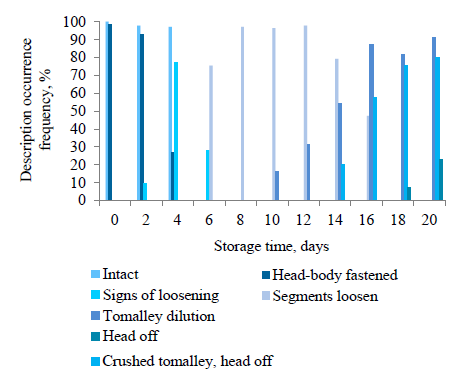
The terms to describe the structure of shrimps were selected as follows:intact; head fastened to body intact, signs of loosening → tomalley dilution → crushed tomalley, head off.
Shrimp body structure. The term depicts the four stages of body structure transformations (Fig. 7):
Stage 1 (days 0–4). The shrimp body was intact from, and the abdomen segments were firmly attached (> 80%).
Stage 2 (days 4–8). the shrimps showed signs of loosening (> 50%), along with firmly attached abdomen segments.
Stage 3 (days 8–14). one to two abdomen segments loosened; the term appeared with a high frequency of occurrence.
Stage 4 (days 14–20). the shrimps loosened in most segments; this description increased in occurrence frequency.
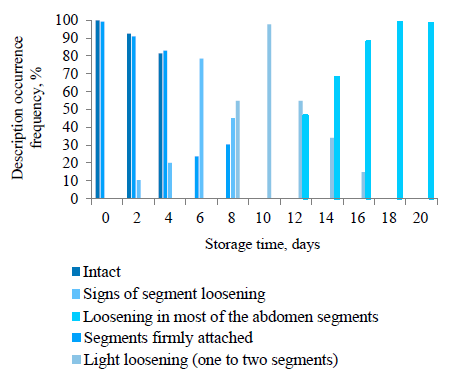
The terms to describe the state of the shrimp body were selected as follows: intact, firmly attached segments → signs of slight loosening in 1–2 segments → loosening in most abdomen segments.
Shrimp meat texture. Figure 8 shows the terms that describe the textural change in shrimp meat:
Stage 1 (days 0–4). the shrimp meat was described as firm and elastic, with high frequency (> 80%).
Stage 2 (days 4–10). the meat was still elastic (> 50%), followed by the description of less elastic and soft meat. The shrimp meat in this period began to transform and was not as good as at Stage 1.
Stage 3 (days 10–16). the meat was described as less elastic, which showed a reduction in the shrimp meat quality.
Stage 4 (days 16–20). The meat lost its elasticity and gained softness and flaccidity (> 60%).
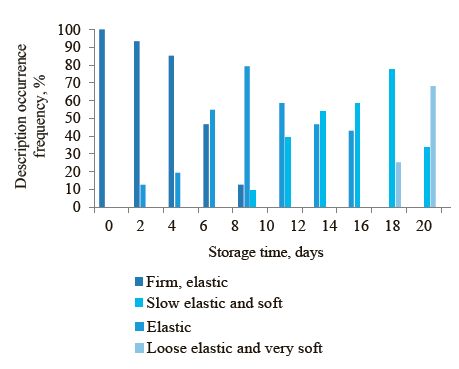
The terms to describe the changes the shrimp meat texture were selected as follows: firm, elastic → elastic → slow elastic and soft → not elastic, soft and flaccid.
Shrimp shell status. Figure 9 illustrates the frequency of terms selected to depict the transformation of shrimp shells:
Stage 1 (days 0–4). The shells were described as shiny, hard, and firm, tightly attached to the meat;
Stage 2 (days 40–14). The shells grew slightly tender and started loosening from the meat; and
Stage 3 (days 14–20). The shell became soft and loosely attached to the meat.
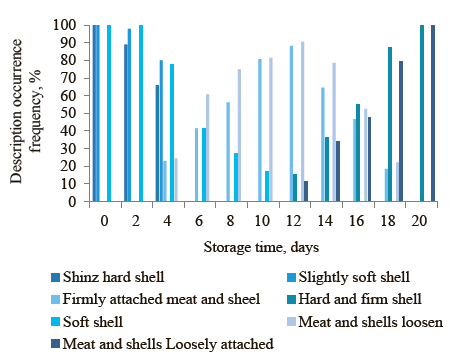
The terms to describe the shrimp shells selected ranked as follows: shiny, hard shells; firmly attached shell and meat → slightly soft shells; meat and shells not firmly attached → soft shells; shells loosen from meat.
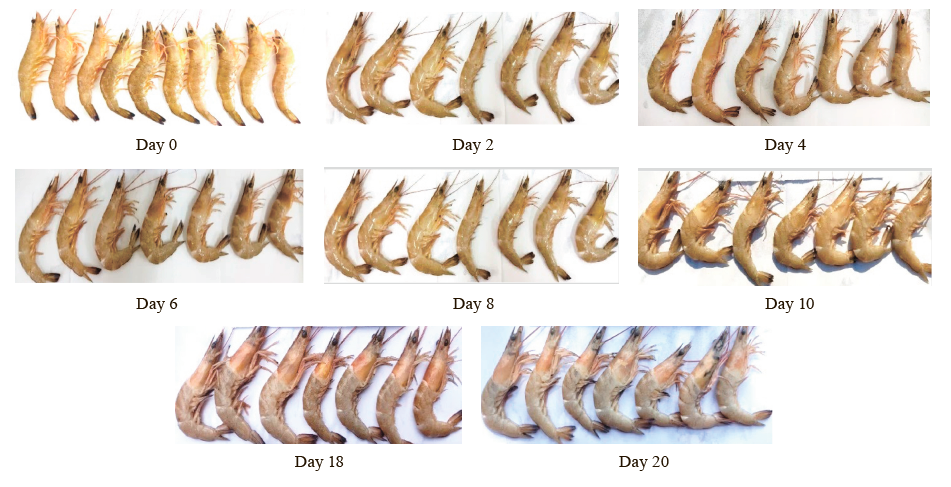
Figure 10 illustrates the changes in the overall appearance of the shrimps during 20 days of storage in ice water.
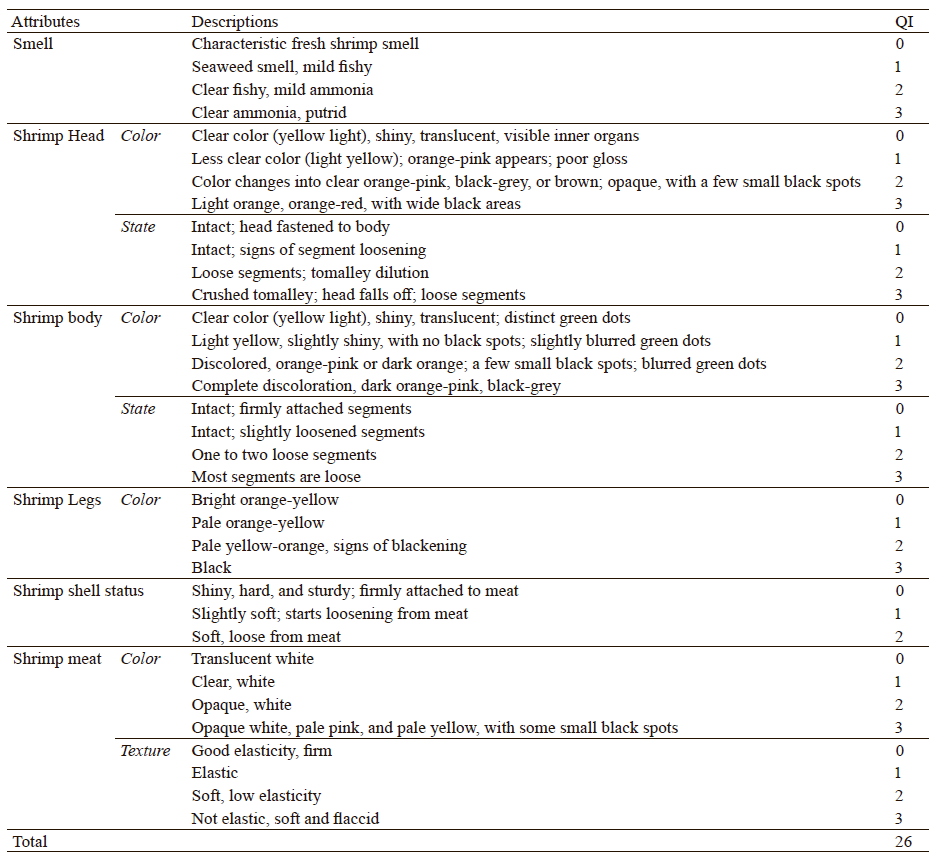
QIM program for shrimp sensory evaluation. Table 1 shows scores from 0 to 3 that marked the changes in sensory properties of different parts of shrimp body. The QIM scheme was based on nine attributes observed to have changed during storage: smell; color of the head, body, and legs; body and head status; meat texture. These nine attributes were included in the QIM assessment program with scores from 0 to 26 points: QI = 0 corresponded to the best quality shrimps, and QI = 26 corresponded to the lowest quality possible.
The QIM scheme (Table 1) was designed to assess the sensory quality of Jinga shrimps preserved in ice water. Compared to the QIM program developed for giant tiger prawns and white-leg shrimps, the attributes of Jinga shrimps were different in terms of head and body color, leaning toward yellow, orange, and black. In terms of smell, ammonic smell grew clear over time. The color of giant tiger prawns changes from blue to green and the smell grows sour at the end of shelf life. White-leg shrimps change from grey to green and emit an unmistakable smell of trimethylamine, as reported by Le et al. [22, 25]. Thus, each type of shrimp has different sensory variations depending on the species and habitat, and each of them needs a tailored QIM scheme.
Results of developing the correlation equation between QI and storage time for Jinga shrimps. Table 2 sums up the changes in the sensory properties of Jinga shrimp’s over preserving time.
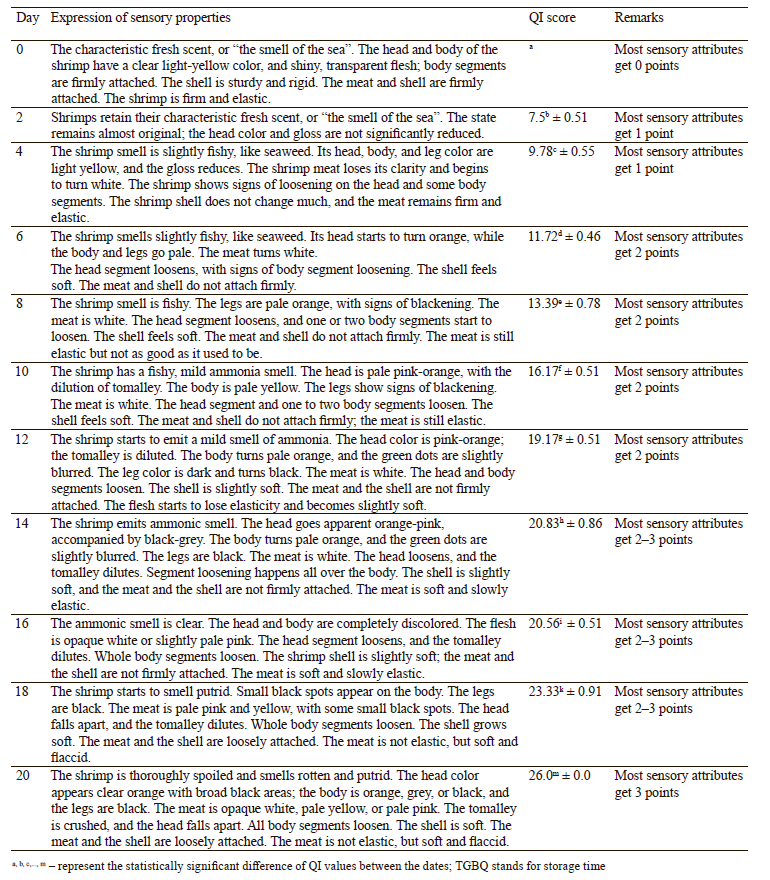
The temporal transformations were consistent with the terminology developed by the panelists, and the progress of the changes was apparent over time. On day 2, the shrimps had almost the same properties as on day 0, thus keeping the original value; the head color and the shell gloss reduced but not significantly. On day 4, the shrimps developed evident changes: a fishy smell, dull color, opaque white meat, loose segments, etc. On day 6, the properties associated with freshness were almost gone: the heads turned orange, the meat grew white, the shell loosened from the meat, and the head separated from the body. On day 8, the shrimps began to show signs of deformation: the head turned orange or pink-orange while the legs turned black; the shell grew soft, and the meat and the shells started to loosen. On day 10, the shrimps developed a smell of ammonia, and the tomalley started to dilute while the head and body segments loosened. On days 12–20, the shrimps showed obvious signs of spoilage and emitted a robust putrid smell. We observed discoloration of the whole shrimp body, appearance of black spots, complete body segment loosening, and shell softening. The meat turned from poorly elastic to soft pasty, the head fell off the body, and the tomalley diluted to watery.
The results in Table 2 show that QI increased with storage time, and the increase was significant with p < 0.05. The regression equation takes the following Eq. (2):
![]()
Other researchers also reported that the quality index (QI) increases linearly with the storage time in ice water in seafood, giant tiger prawns, and white-leg shrimps [10, 20, 22, 25]. Figure 11 illustrates the correlation between the shrimp quality scores and the storage date.
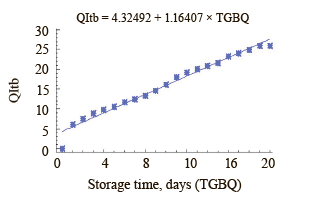
The graph shows the linear relationship and the proportional correlation between storage time and QI score with p < 0.05 and angle coefficient a > 0. Based on Table 3, Jinga shrimps stored in ice water should be consumed within 8–10 days when the QI is still < 18 points. These results were similar to those published on giant tiger prawns (8 days) and white-leg shrimps (9 days) [22, 25].
Verification results of QIM scheme for Jinga shrimps. Ten random shrimp samples with different freshness (unknown) were collected at Do Son port. The panelists scored them using the developed QIM scheme (Table 1). Table 3 shows the results of determining the storage time, predicting the remaining shelf life according to the equation (*), and the actual shelf life.
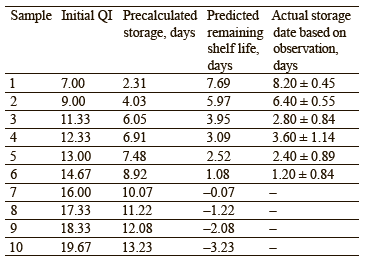
Table 3 shows no statistically significant difference between the predicted and actual storage dates. The residual value of the actual shelf life was close to the residual shelf life calculated using the regression equation (*). The obtained results indicate the possibility of estimating the preservation limit and predicting the remaining storage time of Jinga shrimp stored at 0–4°C. The result suggested that the QIM scheme developed for Jinga shrimp quality assessment provided good results and proved suitable for practical evaluation. It can be used as a reliable scientific tool to assess freshness and quality of raw Jinga shrimps.
ВЫВОДЫ
This study featured the transformations of Jinga shrimp sensory profile during storage in ice water. We developed a Quality Index Method (QIM) scheme to assess the sensory quality of Jinga shrimps based on nine sensory properties, with an Quality Index score of 0–26. We also developed a correlation equation between the QI score and the storage time with the coefficient of R2 = 0.97. The best shelf life of Jinga shrimps stored in ice water was predicted to be between 8 and 10 days. The QIM program is a user-friendly and effective science-based tool that delivers fast and reliable results. It can help customers, fishermen, traders, aquaculture enterprises, and quality control officials to specify the storage time and estimate the remaining shelf life of Jinga shrimps. However, to improve the effectiveness and persuasiveness of the quality index method, it is possible to combine it with the chemical indicators of freshness, this creating a complete program for the Jinga shrimp quality assessment.Вклад авторов
B.T.T. Hien: research concept, methodology, formal analysis, research, original draft, review and proofreading. D.T. Pham: methodology, research, and original draft. L.P. Vu: validation and research. P.H. Dao: validation and research. P.V. Tuyen: research. N.V. Nghia: research, review and proofreading. N.K. Bat: formal analysis, research, and original draft. All the authors have read and agreed to the published version of the manuscript.КОНФЛИКТ ИНТЕРЕСОВ
The authors declare that there is no conflict of interests regarding the publication if this article.БЛАГОДАРНОСТИ
We express our sincere gratitude to the Ministry of Agriculture and Rural Development for facilitating our study.ФИНАНСИРОВАНИЕ
The research was supported by the Vietnamese Ministry of Agriculture and Rural Development, project “Research and assessment of the post-harvest losses level on offshore fishing boats (falling net, purseiner, trawler, pair-trawler, handliner)” (20/HĐ-KHCN, 22/01/2018).СПИСОК ЛИТЕРАТУРЫ
- Calanche JB, Beltran JA, Hernandez Arias AJ. Aquaculture and sensometrics: The need to evaluate sensory attributes and the consumers’ preferences. Reviews in Aquaculture. 2020;12(2):805–821. https://doi.org/10.1111/raq.12351
- Sánchez-García F, Hernández I, Palacios VM, Roldán AM. Freshness quality and shelf life evaluation of the seaweed Ulva rigida through physical, chemical, microbiological, and sensory methods. Foods. 2021;10(1). https://doi.org/10.3390/foods10010181
- Ambrosio RL, Gogliettino M, Agrillo B, Proroga YTR, Balestrieri M, Gratino L, et al. An active peptide-based packaging system to improve the freshness and safety of fish products: A case study. Foods. 2022;11(3). https://doi.org/10.3390/foods11030338
- Wu D, Zhang M, Chen H, Bhandari B. Freshness monitoring technology of fish products in intelligent packaging. Critical Reviews in Food Science and Nutrition. 2021;61(8):1279–1292. https://doi.org/10.1080/10408398.2020.1757615
- Margeta P, Kralik G, Grčević M, Hanžek D, Kralik Z. Importance of sensory evaluation in assessment of egg quality. Poljoprivreda. 2019;25(1):56–63. https://doi.org/10.18047/poljo.25.1.8
- Freitas J, Vaz-Pires P, Câmara JS. Quality Index Method for fish quality control: Understanding the applications, the appointed limits and the upcoming trends. Trends in Food Science and Technology. 2021;111:333–345. https://doi.org/10.1016/j.tifs.2021.03.011
- Ciampa A, Laghi L, Picone G. Validation of a 1H-NMR Spectroscopy quantitative method to quantify trimethylamine content and K-Index value in different species of fish. Journal of Food Quality. 2022;2022. https://doi.org/10.1155/2022/3612095
- Vázquez-Sánchez D, García EES, Galvão JA, Oetterer M. Quality Index Method (QIM) scheme developed for whole Nile tilapias (Oreochromis niloticus) ice stored under refrigeration and correlation with physicochemical and microbiological quality parameters. Journal of Aquatic Food Product Technology. 2020;29(3):307–319. https://doi.org/10.1080/10498850.2020.1724222
- Hien BTT, Pham DT, Tuyen PV, Tran H-D, Nguyen TV, Dang AV, et al. A quality index method for squid Uroteuthis (Photololigo) chinensis L. (Gray, 1849) preserved on ice. Foods and Raw Materials. 2020;8(2):216–222. https://doi.org/10.21603/2308-4057-2020-2-216-222
- Freitas J, Vaz-Pires P, Câmara JS. Freshness assessment and shelf-life prediction for Seriola dumerili from aquaculture based on the Quality Index Method. Molecules. 2019;24(19). https://doi.org/10.3390/molecules24193530
- Esteves E, Aníbal J. Sensory evaluation of seafood freshness using the Quality Index Method: A meta-analysis. International Journal of Food Microbiology. 2021;337. https://doi.org/10.1016/j.ijfoodmicro.2020.108934
- Nga MTT, Diem NTK. Modification of quality index method scheme for Nile tilapia fillets and application in quality assessment of the product stored at low temperatures. Pertanika Journal of Science and Technology. 2019;27(S1):137–147.
- Simpson BK. Innovative strategies for controlling fresh fish texture degradation during postharvest handlingand storage. In: Shahidi F, Jones YM, Kitts D, editors. Seafood safety, processing, and biotechnology. Boca Raton: CRC Press; 2020. pp. 161–180. https://doi.org/10.1201/9781003075899
- Sae-leaw T, Benjakul S. Prevention of melanosis in crustaceans by plant polyphenols: A review. Trends in Food Science and Technology. 2019;85:1–9. https://doi.org/10.1016/j.tifs.2018.12.003
- Ginson J, Remya Kumari KR., Bindu J. Review on spoilage and quality indices of prawns. Fishery Technology. 2021;58(4):191–202.
- Jin Y, Li S, Yu Y, Zhang C, Zhang X, Li F. Transcriptome analysis provides insights into the mechanism of astaxanthin enrichment in a mutant of the ridgetail white prawn Exopalaemon carinicauda. Genes. 2021;12(5). https://doi.org/10.3390/genes12050618
- Khodanazary A. Freshness assessment of shrimp Metapenaeus affinis by quality index method and estimation of its shelf life. International Journal of Food Properties. 2019;22(1):309–319. https://doi.org/10.1080/10942912.2019.1580719
- Uyen PTX. Developing the Quality Index Method (QIM) to assess the freshness of whiteleg shrimp (Lipopenaeus vannamei) preserved at 0°C. Journal of Science and Technology. 2019;39(03):58–68. (In Vietnamese). https://doi.org/10.46242/jst-iuh.v39i03.453
- Tam LN, Uyen PTX, Vu THA. Effect of treatment on quality of black tiger shrimp (Penaeus monodon). Vietnam Journal of Chemistry. 2018;56(6):773–777. https://doi.org/10.1002/vjch.201800086
- Tam LN, Vu THA, Hai CV. The shelf-life of black tiger shrimp (Penaeus monodon) treated with the different conditions. Vietnam Journal of Science and Technology. 2019;57(4):410–419. https://doi.org/10.15625/2525-2518/57/4/12901
- Hoque MS, Ripon MAS, Hossain MB, Rahman MA, Hasan MM, Mithun BD, et al. Quality assessment and molecular identification of bacteria across the black tiger shrimp (Penaeus monodon) supply chains in Southern Bangladesh. International Aquatic Research. 2021;13(3):173–184. https://doi.org/10.22034/iar.2021.1924974.1142
- Le NT, Doan NK, Nguyen Ba T, Thi TTV. Towards improved quality benchmarking and shelf life evaluation of black tiger shrimp (Penaeus monodon). Food Chemistry. 2017;235:220–226. https://doi.org/10.1016/j.foodchem.2017.05.055
- Tu HN. Some biological characteristics of Jinga shrimp (Metapenaeus affinis). Journal of Science and Technology. 2016:67–73. (In Vietnamese).
- Dinçer MT, Aydin İ. Proximate composition and mineral and fatty acid profiles of male and female jinga shrimps (Metapenaeus affinis, H. Milne Edwards, 1837). Turkish Journal of Veterinary and Animal Sciences. 2014;38(4):92–103. https://doi.org/10.3906/vet-1301-15
- Le NT, Huynh NQA, Doan NK, Phan TXU, Nguyen BT, Dam SM, et al. The combination of microbiological, biochemical, and quality index methods in quality evaluation of Pacific white shrimps (Litopenaeus vannamei) preserved at 0°C. Vietnam Journal of Science, Technology and Engineering. 2021;63(2):45–51. https://doi.org/10.31276/VJSTE.63(2).45-51
- Hien BTT, Diem PT, Tung LA, Huong TT, Hoang NH, Bat NK, et al. Optimizing enzymatic hydrolysis for feed production from catfish by-products. Foods and Raw Materials. 2022;10(1):19–26. https://doi.org/10.21603/2308-4057-2022-1-19-26
