

Аннотация
During the processing of sour cherries into different foodstuffs, a large amount of kernels is produced as waste material, which creates a significant disposal problem for the food industry. Sour cherry kernels containing 25.3–35.5% of protein can be used as a functional protein source in food production. Therefore, we aimed to study the effects of hydrolysis degree on the sour cherry kernel protein hydrolysates.Proteins were extracted from the defatted flour by isoelectric precipitation. The resulting protein concentrate was hydrolyzed (5, 10, and 15% hydrolysis) using Alcalase to yield hydrolysates. We determined their oil and water holding, emulsifying, gelation, and foaming properties, as well as apparent molecular weight distribution and proximate compositions.
No protein fractions greater than an apparent molecular weight of about 22 kDa were present in the hydrolysates. The hydrolysis of the protein concentrate mostly led to an increase in protein solubility. As the degree of hydrolysis increased from 5 to 15%, the water holding capacity of the hydrolysates decreased from 2.50 ± 0.03 to 2.03 ± 0.02 g water/g, indicating its deterioration.
The hydrolysates obtained at different degrees of hydrolysis had a better solubility than the intact protein concentrate. The oil holding capacity, the foaming stability, and the least gelation concentration of the protein concentrate could not be considerably improved by hydrolysis. In contrast, its emulsifying activity index and foaming capacity could be increased with a limited degree of hydrolysis (up to 10%).
Ключевые слова
Sour cherry kernel protein, hydrolysis, Alcalase®, proximate composition, functional propertiesВВЕДЕНИЕ
Cherry belongs to the Prunus genus in the Rosaceae family. There are over several hundred species of cherry, but the two most common are sour cherry (Prunus cerasus L.) and sweet cherry (Prunus avium L.). Since sour cherry possesses a lower sugar/acid ratio than sweet cherry, it is commonly used to make fruit juice, puree, jam or marmalade, whereas sweet cherry is mostly eaten fresh [1]. In 2020, worldwide sour cherry production was approximately 1.48 million tons [2]. Roughly 85% of this output is converted into numerous foodstuffs, generating large volumes of seeds as waste material, which creates a significant disposal problem for the food industry [3]. Sour cherry kernels contain 17.0–41.9% of oil, 25.3–35.5% of protein, and 9.5–30.3% of dietary fiber [1, 4, 5].
Functional properties are physicochemical characteristics that govern the behavior of proteins in food systems during processing and storage. Emulsifying, oil and water holding, gelation, and foaming are some examples of functional characteristics. Proteins are included as functional components in foods to create definite textural and sensorial features, and/or enhance a nutritional value [6, 7]. The role of proteins in food systems can be understood through their functionality. Çelik et al. extracted proteins from sour cherry kernels and studied the functional attributes of the protein concentrate [5]. They found that the protein concentrate had lower emulsifying, foaming, and stability indices than sodium caseinate (Na-caseinate).
Therefore, research is needed to improve the functionality of sour cherry protein concentrate by applying various methods. Proteins are frequently modified by enzymatic, chemical, or physical processes that alter their structure and, therefore, physicochemical and functional attributes. Enzymatic hydrolysis is one of such processes that is most frequently used to enhance the functional attributes of proteins such as solubility, emulsifying, gelling, and foaming [8]. Various types of enzymes include Alcalase®, papain, trypsin, pepsin, and chymotrypsin. Partial proteolysis can improve functional characteristics by altering the conformation, molecular mass, and strength of the intra- and intermolecular bonds of the protein molecules while keeping their nutritional value.
Alcalase® is a serine-type protease from Bacillus licheniformis that has a broad specificity. The optimum pH and temperature for catalysis range from 7.0 to 9.0 and from 30 to 65°C, respectively. alcalase has been used to produce hydrolysates with superior nutritional or functional attributes compared to parent protein [9, 10].
To the best of our knowledge, no information is currently available on the functional attributes of hydrolysates prepared from sour cherry kernel proteins.
Therefore, we aimed to (i) prepare protein hydrolysates with a different degree of hydrolysis (5, 10, and 15%) from sour cherry kernel protein concentrate using alcalase and (ii) determine the effects of the degree of hydrolysis on the selected functional
properties, apparent molecular weight distribution, and proximate compositions of the resulting hydrolysates.
ОБЪЕКТЫ И МЕТОДЫ ИССЛЕДОВАНИЯ
Materials. The sour cherry kernels were purchased from a local enterprise in Turkey and kept in plastic pouches at 4°C until use. Na-caseinate containing 13.5–16.0% nitrogen was obtained from Sigma- Aldrich (St. Louis, MO, USA). Alcalase® (2.4L) from Bacillus licheniformis with endopeptidase activity, mainly subtilisin A (2.4 Anson units/g, with one Anson unit (AU) defined as the amount of enzyme that releases 1.0 mmol of L-tyrosine from urea-denatured hemoglobin per min at 25°C and pH 7.5) was obtained from Novozymes A/S (Bagsvaerd, Denmark). All the chemicals and reagents were of analytical grade and used without further purification.
Preparation of protein concentrate. Protein concentrate was produced via alkaline extraction and isoelectric precipitation as outlined by Çelik et al. with some modifications [5]. Briefly, sour cherry kernels were powdered (≤ 1 mm) with a coffee grinder. Then, the kernel powder was defatted 3 times (1 h each) with n-hexane and 2 times (1 h each) with petroleum ether in a 1:5 powder-to-solvent ratio at 25°C. The defatted powder was placed in a glass jar and kept at –18°C until use. The defatted powder was suspended in distilled water (5%, w/v) and the pH of the resulting slurry was set to 10.0 with 2 N NaOH for extraction. The slurry was agitated for 180 min at 25°C while the pH was maintained constant by re-adjusting every 30 min, if necessary. Next, the slurry was filtered through a Whatman Grade 1 filter paper and the filtrate pH was set to 4.5 with 2 N HCl, left for 15 min, and filtered through the same type of filter paper to collect aggregated proteins. The aggregated proteins were mixed with distilled water and the mixture pH was set to 7.0. Then, the mixture was dried in an air flow oven at 50°C for 12–18 h and kept at –18°C until use. The resulting protein-rich product was accepted as a protein concentrate since the protein content in dry matter (85%) was lower than 90%.
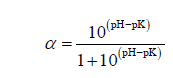
Enzymatic hydrolysis of protein concentrate. Protein concentrate was mixed with distilled water (1:25) and the pH of the mixture was adjusted to 8.0. The mixture was held for at least 30 min at 55°C. Then, the pH and temperature of the suspension were stabilized at 8.0 and 55°C, respectively. alcalase was added at various enzyme/protein ratios (3.6, 7.2, and 10.8 AU/100 g protein) to achieve three different degrees of hydrolysis (5, 10, and 15%) within 40–50 min. The degree of hydrolysis (DH, %) was calculated by the pH-stat method using the following Eq. (1) [11]:
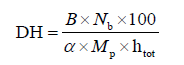
where B is the amount of alkali, mL; Nb is the normality of alkali; Mp is the amount of protein, g; htot is the total peptide linkages in the protein (8.0 mEqv/g protein); α is the average ionization coefficient of the α-NH2 groups (if the pH is 8.0 and the temperature is 55°C, then the pK is 7.1 and the α value is calculated as 0.888 with the Eq. (2)).
When the desired degree of hydrolysis (5, 10 or 15%) was achieved, the hydrolysis process was terminated by heating the slurry in a water bath at 95°C for 10 min. Once the slurry was cooled to 50°C, the pH value was set to 7.0, and the slurry was dried using an air flow oven at 50°C for 12–18 h and kept at –18°C until use.
Proximate composition. Ash and total solid contents of the protein concentrate and its hydrolysates were determined by the gravimetric method [12, 13]. The lipid content was evaluated using an Ankom XT10 extractor (Macedon, NY, USA). The phenol-sulfuric acid method was used for the total carbohydrate and the micro-Kjeldahl method, for the nitrogen content (with 6.25 as the conversion factor) [14, 15].
Sodium dodecyl sulfate polyacrylamide gel electrophoresis. Apparent molecular weight distribution of the peptides/proteins from the protein concentrate and its hydrolysates were analyzed by the method described by Laemmli [16]. A sample containing 5 mg of protein was solubilized in 1 mL of sample buffer and then heated at 95°C for 5 min. After cooling, 10 μL of the sample was loaded onto the gel (1 mm thick, 4% stacking and 12% separating). A combination of standard proteins (6.5–200.0 kDa, catalogue number S8445, Sigma-Aldrich, St. Louis, MO, USA) was loaded as a molecular weight marker. The gel was stained with Coomassie Brilliant Blue G-250 and de-stained with a 10% acetic acid solution. Currents of 25 mA were applied for the stacking gel and 35 mA, for the separating gel.
Color measurements. The CIELAB parameters (L*, a*, b*) of protein concentrate and its hydrolysates were determined from 3 different locations by using a CR-300 Minolta colorimeter (Osaka, Japan). In this system, the a* value ranges from green (–) to red (+), the b* value ranges from blue (–) to yellow (+), and the L* value is an estimation of lightness varying from 0 (black) to 100 (white). In addition, the total color change (ΔE*) of hydrolysates with respect to the protein concentrate was calculated using the following Eq. (3):
![]()
where L0 is the L* value of protein concentrate; L* is the L* value of hydrolysate; a0 is the a* value of protein concentrate; a* is the a* value of hydrolysate; b0 is the b* value of protein concentrate; and b* is the b* value of hydrolysate.
Protein solubility. The solubility of the protein concentrate and its hydrolysates was tested as outlined by Güzel et al. and Du et al. with minor adjustments [7, 17]. Suspensions of 5% (w/v) protein concentrate or hydrolysates were prepared and their pH was set to 1.0–12.0 using 1 N NaOH or 1 N HCl. The suspensions were agitated at 25°C for 90 min. Meanwhile, their pH was checked at 30 and 60 min, and readjusted to the specified values, if necessary. Then, the suspensions were centrifuged at 4000×g for 30 min. Proteins in the supernatant were measured by the micro- Kjeldahl technique, and the protein solubility (%) was determined using the following Eq. (4) [15]:
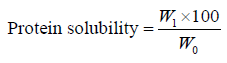
where W0 is the protein mass in the sample, g; and W1 is the protein mass in the supernatant, g.
Water and oil holding capacity. The water and oil holding capacities of the protein concentrate and its hydrolysates were measured by the method of Çelik et al. and Wang et al. with some modifications [5, 18]. The protein concentrate or hydrolysates (1.0 g) were suspended in 8 mL of distilled water for the water holding capacity. The suspension (pH 7.0) was agitated for 30 s every 10 min and allowed standing for 70 min, and then centrifuged at 25°C for 15 min at 2000×g. The liquid phase was allowed draining for 10 min at a 45° angle. The increase in mass was noted as the water holding capacity (g water/g sample).
To determine the oil holding capacity, the protein concentrate or its hydrolysates (1.0 g) were suspended in 6 mL of sunflower oil. The suspension was agitated for 30 s every 5 min and held up for 30 min, and then centrifuged at 25°C for 25 min at 1600×g. The liquid phase was allowed draining for 10 min at a 45° angle. The increase in mass was noted as the oil holding capacity (g oil/g sample) and compared to the reference protein (Na-caseinate).
Emulsifying activity index and emulsifying stability index. The emulsifying activity index (EAI, m2/g) and the emulsifying stability index (ESI, min) of the protein concentrate and its hydrolysates were examined as outlined by Pearce and Kinsella [19]. For emulsion formation, 6.6 mL of commercial sunflower oil was mixed with 20 mL of the protein concentrate or hydrolysate suspensions (pH 7.0, 0.1% protein, w/v) and homogenized (T18 Ultra Turrax, IKA, Staufen, Germany) at 20 000 rpm for 1 min. Fifty milliliters of the emulsion was added to 4.95 mL of 0.1% (w/v) sodium dodecyl sulphate (SDS) solution and instantly vortexed for 10 s, and the absorbance (A0) of the mixture was read against 0.1% SDS solution at 500 nm. After 10 min, another 50 μL of the emulsion was added to 4.95 mL of 0.1% (w/v) SDS solution and promptly vortexed for 10 s, and finally the absorbance (A10) was measured. The EAI and the ESI were calculated by using the Eqs. (5) and (6):
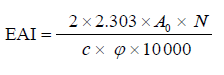
where A0 is the absorbance of the diluted emulsion after homogenization; c is the protein content of suspension (0.001 g/mL); N is the dilution factor (100); φ is the volume fraction of oil (6.6/26.6 = 0.248); A10 is the absorbance at 10 min; and t is the time interval (10 min).
Foaming capacity and stability. The foaming capacity (FC, %) and foaming stability (FS, %) of the protein concentrate and its hydrolysates were measured by the method outlined by Güzel et al. and Cui et al. with some modifications [7, 20]. The protein concentrate or its hydrolysates (0.25 g) were suspended in distilled water. The suspension’s pH was set to 7.0, and the volume was made up to 20 mL (1.25%, w/v) with distilled water. The suspension was homogenized at 20 000 rpm for 2 min at 25°C to incorporate air, and then promptly poured into a 100-mL glass cylinder to record the total volume. The foaming capacity was calculated by using the following Eq. (7):
where V1 is the total volume after homogenization; and V2 is the total volume before homogenization (20 mL).
The foaming stability was determined using the Eq. (8) by recording changes in the foam volume after 0, 10, 30, 60, 90, and 120 min of storage at 25°C.
where Vt is the foam volume at time t (10, 30, 60, 90, and 120 min); and V0 is the foam volume at 0 min.
The least gelation concentration. The least gelation concentration of the protein concentrate and its hydrolysates was analyzed by the method of Güzel et al. and Rahman et al. with minor modifications [7, 21]. 5 mL of the protein concentrate or hydrolysates suspensions (pH 7.0, 2–14% w/v) were left in a boiling water bath for 1 h, followed by quick chilling to 4°C in an ice bath, and then kept for 2 h. Gel formation was assessed by turning the tubes with the suspensions upside down. The least gelation concentration was then recorded as a concentration at which the sample in the inverted tubes showed no signs of slipping or falling.
Statistical analysis. The results of three independent experiments were used to calculate means and standard deviations. Statistical evaluation of the data was performed using one-way analysis of variance, and the Duncan test was used to compare means in the IBM SPSS v. 25.0 statistical software at a significance level of 5% (p < 0.05). All the graphs were prepared with Microsoft Excel 2019.
РЕЗУЛЬТАТЫ И ИХ ОБСУЖДЕНИЕ
Proximate composition. The total solids, protein, lipid, total carbohydrate, and ash contents of the protein concentrate and its hydrolysates are presented in Table 1. The proximate composition of the protein concentrate was similar to that reported by Çelik et al., except for total carbohydrates [5]. The total carbohydrate (9.70 ± 0.61%) content of the protein concentrate was significantly higher than the value (2.94 ± 0.36%) found by Çelik et al. [5].
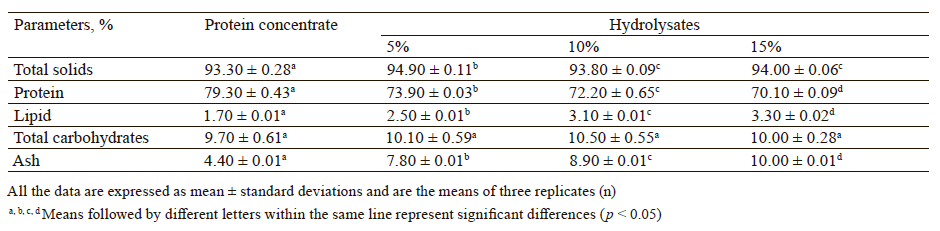
The total solids contents of all the hydrolysates were statistically higher than that of the protein concentrate (p < 0.05). The protein content of the hydrolysates showed a significant (p < 0.05) decrease as the degree of hydrolysis increased. The possible reason for this decline was the increase in the ash content of the hydrolysates, resulting from the neutralization process with NaOH during the hydrolysis reaction. Similarly, Yust et al. found that the protein content of chickpea protein hydrolysates decreased as the degree of hydrolysis increased [22]. Interestingly, the lipid contents of the hydrolysates were significantly higher with the increase in the degree of hydrolysis (p < 0.05). This might be due to the fact that the enzymatic hydrolysis reaction changed the three-dimensional structure of proteins, leading to the release of non-extractable lipids trapped in the protein matrix. Similarly, Dias et al. reported that the amount of extractable lipids increased by the hydrolysis of almond proteins with neutral endoprotease from Bacillus subtilis [23]. The total carbohydrate contents of the protein concentrate and its hydrolysates varied from 9.7 to 10.5%, and no statistical difference was detected between the samples (p > 0.05). The ash content of the hydrolysates was significantly higher with the increase in the degree of hydrolysis (p < 0.05). As mentioned earlier, this increase was due to the addition of NaOH to neutralize the carboxyl groups released during the hydrolysis reaction. Similar findings were obtained for the hydrolysis of chickpea proteins with alcalase [22].
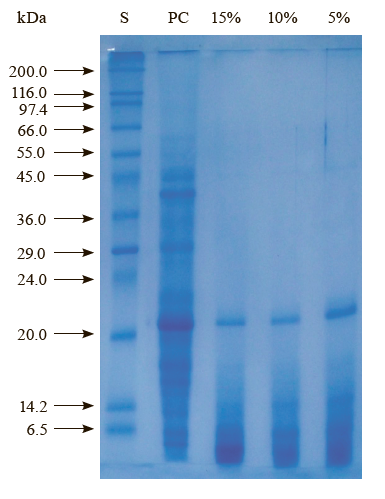
Apparent molecular weight distribution. The sodium dodecyl sulfate polyacrylamide gel electrophoresis analysis was carried out to determine the apparent molecular weight (AMW) distribution of the peptide/ protein fractions in the protein concentrate and its hydrolysates. We found that alcalase was an efficient enzyme for the hydrolysis of sour cherry kernel proteins. As can be seen from Fig. 1, the AMW of proteins in the protein concentrate ranged from 6.5 to 66.0 kDa under denaturing and reducing conditions.
The hydrolysis of the protein concentrate at different levels (5, 10, and 15%) resulted in the protein bands of almost the same number and the AMW, but different concentrations. As can be seen from Fig. 1, no protein fractions greater than an AMW of about 22 kDa are present in the hydrolysates. In other words, the protein fractions greater than an AMW of about 22 kDa were completely broken down into smaller peptides. As the degree of hydrolysis increased from 5 to 15%, the color of the protein fraction with an AMW of 22 kDa became fainter, but the fractions smaller than 6.5 kDa became darker.
Color changes. The color parameters (CIELAB L*, a*, b* and ΔE*) of all the samples are presented in Table 2. The highest L* value (63.90 ± 0.28) was observed in the 5% hydrolysis degree sample, although it was not significantly different from the L* value of the protein concentrate (p > 0.05). The L* values of the hydrolysates showed a significant decline as the degree of hydrolysis increased from 5 to 15% (p < 0.05). This might be due to a combined effect of the hydrolysis reaction (by increasing the number of reactive amino groups participating in the Maillard type browning reactions) and the heat treatment applied to inactivate alcalase (by accelerating the Maillard type browning reactions). The protein concentrate had a redder (higher a*) and yellower (higher b*) color compared to the hydrolysates (p < 0.05). We found that the a* values of the hydrolysates showed a gradual increase, while the b* values decreased or increased irregularly. The 15% degree of hydrolysis sample had the highest redness and yellowness compared to the other hydrolysates, implying that the Maillard type browning reaction was higher in this sample.
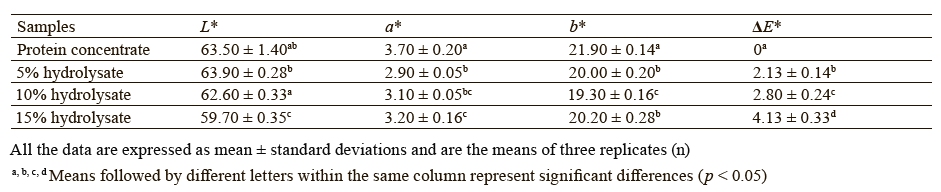
The total color difference (ΔE*) helps identify inconsistencies between the colors of the samples and to control the color more effectively. We observed that the total color difference between the hydrolysates increased significantly with the increase in the hydrolysis degree from 5 to 15% (p < 0.05). The color values of the protein concentrate in our study were comparable to the color values reported by Çelik et al. (L* = 55.43 ± 0.96, a* = 5.67 ± 0.21, and b* = 23.71 ± 0.50) for the sour cherry kernel protein concentrate [5].
Protein solubility at different pH values. Protein solubility is an essential criterion for the food industry because it influences other functional attributes such as viscosity, gelling, and foaming. It is also a beneficial marker of denaturation and interactions between proteins. Protein solubility is affected by factors such as temperature, concentration, ionic strength, pH, and the presence of other molecules [7]. As can be seen from Fig. 2, the solubility of the protein concentrate was obviously pH dependent. The maximum (86.90 ± 0.30%) and minimum (18.80 ± 0.45%) solubility values of the protein concentrate were observed at pH 12.0 and 4.0, respectively. They were consistent with the values reported by Çelik et al. for the sour cherry kernel protein concentrate [5]. In general, the hydrolysis of protein concentrate with alcalase increased protein solubility in broad pH ranges, especially at acidic pH values. Similar to our results, the solubility of the resulting hydrolysates increased depending on the hydrolysis degree in the studies on rice endosperm protein concentrate, oat bran protein concentrate, chickpea protein isolate, and peanut protein isolate [8, 22, 24, 25].
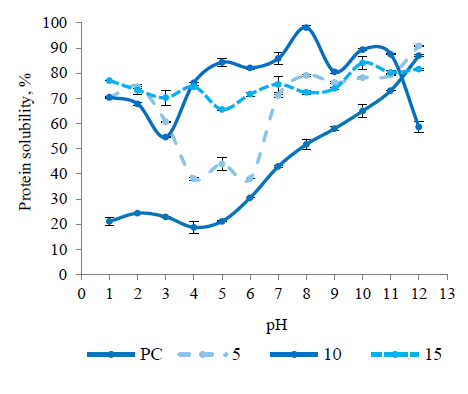
While the 5% hydrolysis degree sample showed higher solubility than the protein concentrate at all pH values (p < 0.05), there was no shift in pH values at which minimum and maximum solubility was observed. The 10% hydrolysis and 15% samples had higher solubility at all pH values (p < 0.05) except pH 12.0 than the protein concentrate. In addition, the 10% sample showed higher solubility at pH 4.0–11.0 than the 15% hydrolysis degree sample. These results were inconsistent with the theoretical knowledge that the higher the hydrolysis degree, the higher the solubility. They might be due to the heat treatment applied to the hydrolysates at 95°C to destroy alcalase activity. Depending on the peptides and proteins present in the environment, insoluble complexes can be formed as a result of peptide-peptide, proteinprotein, and/or peptide-protein hydrophobic interactions promoted by high temperatures [26].
Effects of enzymatic hydrolysis on water holding capacity. The water holding capacity (WHC) reflects a protein’s ability to physically hold water against gravity. It is a functional attribute critical for high viscosity foods such as bakery products, sauces, soups, and gravies. The water holding capability of a protein molecule is a function of its size and shape, as well as the hydrophobic and hydrophilic interactions it participates in [6, 7].
The WHC of the protein concentrate (2.84 ± 0.01 g water/g sample) in our study was higher than that of the sour cherry kernel protein concentrate (2.42 ± 0.09 g water/g) reported by Çelik et al. [5]. We found that the WHC values of the 5, 10, and 15% samples were 2.50 ± 0.03, 2.18 ± 0.03, and 2.03 ± 0.02 g water/g, respectively. As the degree of hydrolysis increased from 5 to 15%, the WHC of the hydrolysates decreased from 2.50 ± 0.03 to 2.03 ± 0.02 g water/g. This indicated that the WHC of the protein concentrate could not be improved by hydrolysis. This result was not unexpected since hydrolysis causes proteins to dissolve in water instead of holding it. The 5% hydrolysis degree sample showed the highest WHC among the hydrolysates (p < 0.05). The 15% sample had the lowest WHC and differed significantly from the other samples (p < 0.05). Similar to our results, Nisov et al. found that the WHC of rice endosperm protein hydrolysates decreased with an increase in the hydrolysis degree [24]. Guo et al. also reported lower WHC in Elaeagnus mollis protein hydrolysates with an increase in the hydrolysis degree [27]. Contrary to our results, however, Vioque et al. reported higher WHC with an increase in the hydrolysis degree [28].
Effects of enzymatic hydrolysis on oil holding capacity. The interaction between lipids and proteins controls the sensorial properties of many foods. These interactions can be driven by ionic strength, pH, temperature, and other variables in the system. High oil holding capacity is critical for certain food systems, such as cake batters, sausages, salad dressings, and mayonnaise [7].
In our study, the oil holding capacity (OHC) of the protein concentrate was 1.76 ± 0.03 g oil/g sample. It was significantly lower than the OHC of Na-caseinate (1.93 ± 0.04 g oil/g) used as a reference protein (p < 0.05). This value was higher than the OHC of the protein concentrate (1.73 ± 0.17 g oil/g) reported by Çelik et al. [5]. The OHCs of 5, 10, and 15% hydrolysis degree samples were 1.71 ± 0.04, 1.64 ± 0.02, and 1.72 ± 0.01 g oil/g, respectively, with no differences among the OHC values of the hydrolysates (p > 0.05). While the 10% sample showed a significantly lower OHC than the protein concentrate (p < 0.05), the 5 and 15% samples had an OHC similar to the protein concentrate (p > 0.05). This indicated that the OHC of the hydrolysates did not depend solely on the hydrolysis degree. On the one hand, this inconsistent result was possibly due to the fact that the hydrolysis process increased the OHC by revealing nonpolar groups, while on the other hand, it decreased the OHC by reducing the oil-trapping surfaces [25, 28]. These results showed that the OHC of the protein concentrate could not be improved by hydrolysis. Similar to our results, the hydrolysis of oat bran protein concentrate with trypsin enzyme produced hydrolysates with a lower OHC [25]. On the contrary, Vioque et al. reported that the hydrolysis of rapeseed protein isolate with alcalase produces hydrolysates with a higher OHC [28].
Effects of enzymatic hydrolysis on emulsifying activity and stability indices. Surface hydrophobicity and concentration are the most significant features affecting the emulsifying capability of a protein [7, 29]. The emulsifying activity index (EAI) is an indicator of how quickly a protein can adsorb to the water/lipid interface during emulsion formation. In our study, the EAI values of the protein concentrate, Na-caseinate (a reference protein), as well as the 5, 10, and 15% hydrolysis degree samples at pH 7.0 were 22.7 ± 0.3, 176.4 ± 2.6, 24.2 ± 0.4, 26.8 ± 0.9, and 29.6 ± 1.2 m2/g, respectively. The EAI values of the protein concentrate, as well as the hydrolysates were significantly lower than that of Na-caseinate (p < 0.05). This suggested that the proteins in the protein concentrate and its hydrolysates probably could not adsorb to the water/lipid interface as quickly as Na-caseinate. The EAI values of the hydrolysates increased depending on the degree of hydrolysis. We found that the 15% sample had the highest EAI value among the samples. In addition, the 10 and 15% samples had significantly higher EAI values than the protein concentrate (p < 0.05). This increase in the EAI might be due to increased solubility and the exposure of hydrophobic groups by hydrolysis. These results showed that the EAI of the protein concentrate could be improved by enzymatic hydrolysis, albeit to a certain limit. Similar to our findings, Guan et al. reported that the hydrolysates had higher EAI values than the intact oat bran protein concentrate [25]. On the contrary, Zhao et al. found that the hydrolysates showed lower EAI values when they hydrolyzed peanut protein isolate with alcalase [8].
The emulsifying stability index (ESI) reflects a protein’s capacity to form a stable emulsion over a period of time [29]. The emulsifying attributes of protein isolates and concentrates are mostly parallel to their water solubility profile [7]. In our study, the ESI values of Na-caseinate, protein concentrate, as well as the 5, 10, and 15% samples were 1,187.5 ± 17.7, 116.4 ± 6.5, 63.7 ± 3.2, 62.9 ± 1.7, and 177.2 ± 7.1 min, respectively. It was obvious that the protein concentrate and its hydrolysates had considerably lower ESI values than Na-caseinate (p < 0.05). Therefore, we assumed that the proteins in the protein concentrate and its hydrolysates had a limited capability to diminish the interfacial tension and to form a protective film around the oil droplets. The ESI values of the hydrolysates decreased significantly compared to the protein concentrate at up to 10% hydrolysis (p < 0.05). However, when the hydrolysis degree reached 15%, the ESI value grew significantly compared to the protein concentrate (p < 0.05). This result showed that the ESI of the protein concentrate could be improved by about 1.5 times with 15% hydrolysis. Similarly, higher ESI values were produced by the hydrolysis of oat bran protein concentrate with trypsin and the hydrolysis of peanut protein isolate with alcalase [25, 30].
Effects of enzymatic hydrolysis on foaming capacity and stability. Foam formation is determined by the type of protein, its concentration, preparation method, solubility, composition, pH, the presence of salts, as well as hydrophobic interactions. Important factors for the foaming capacity include the diffusion rate of protein molecules towards the air-water interface, rapid conformational changes, and the rearrangement of protein molecules at the interface (molecular flexibility) [6, 7].
In our study, the foaming capacity of the protein concentrate (21.3 ± 1.8%) at pH 7.0 was considerably lower than that of Na-caseinate (46.3 ± 8.8%) used as a reference protein (p < 0.05) (Table 3). This result showed that the proteins in the protein concentrate were possibly less flexible than those in Na-caseinate. In addition, the foaming capacity of the protein concentrate was lower than that of sour cherry kernel protein concentrate (21.3 ± 1.8 vs 35.0 ± 3.5%) reported by Çelik et al. [5]. Although not statistically significant (p > 0.05), the protein concentrate exhibited a lower foaming capacity than the 5% (25.0 ± 0.1%) and 10% (23.8 ± 1.8%) samples, but higher than the 15% sample (17.5 ± 0.1%). These results showed that the foaming capacity of the protein concentrate could be improved with a limited degree of hydrolysis (up to 10%). Similarly, an increase in the foaming capacity resulted from the hydrolysis of the rapeseed protein isolate with alcalase, the oat bran protein concentrate with trypsin, and the chickpea protein isolate with Alcalase [22, 25, 28]. However, contrary to our findings, the hydrolysis of the peanut protein isolate with alcalase led to a decrease in the foaming capacity [30].
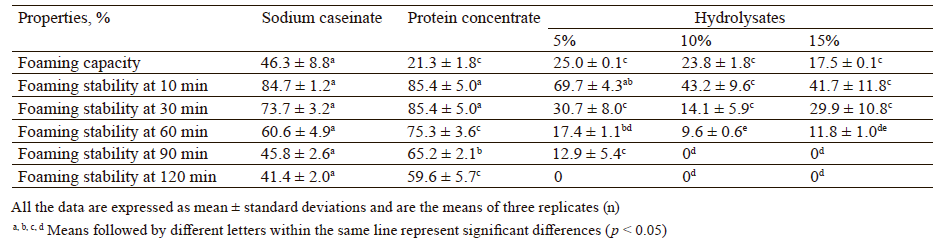
The foaming stability is a critical feature as the effectiveness of a foam-forming agent depends on its ability to retain gas bubbles for as long as possible. The formation of an adhesive multilayer protein film around each gas bubble makes the foam resistant to liquid drainage and coalescence [6]. Time-dependent (0–120 min) variations in the foaming stability of the protein concentrate, Na-caseinate, and the hydrolysates are shown in Table 3. Although not statistically significant (p > 0.05), the protein concentrate had a higher foaming stability than Na-caseinate after storage at 25°C for 10 and 30 min. Furthermore, the protein concentrate had a significantly higher foaming stability than Nacaseinate after 60, 90, and 120 min of storage (p < 0.05). All the hydrolysates (5, 10, and 15% hydrolysis degree) showed lower foaming stability values than both the protein concentrate and Na-caseinate over 120 min. The foaming stability of the 10 and 15% samples even decreased to zero after 90 min. These results showed that the foaming stability of the protein concentrate could not be improved by enzymatic hydrolysis. Similar to our findings, Guan et al. and Jamdar et al. also found a decrease in the foaming stability as a result of hydrolysis [25, 30].
Effects of enzymatic hydrolysis on the least gelation concentration. The gelling features of proteins are especially crucial in emulsion meat products such as sausage and salami. The gelling capacity is determined by the protein type and concentration, by pH, ionic strength, temperature, and the quantity of sulfhydryl and hydrophobic groups. Gels are stabilized by hydrogen bonds, ionic interactions, and disulfide linkages [6, 7].
The least gelation concentration (LGC) reflects the gel forming capacity of a protein: the lesser the LGC, the better the gelling capacity. In our study, the LGCs of the protein concentrate, as well as the 5, 10, and 15% samples at pH 7.0 were 10, 11, 11, and 11%, respectively. The LGC of the protein concentrate was higher than the value (10 vs. 8%) found by Çelik et al. [5]. The LGCs of the hydrolyzed samples were higher than that of the protein concentrate. This showed that the LGC of the protein concentrate could not be improved by hydrolysis. A possible reason might be that the reduction in peptide size caused by hydrolysis resulted in aggregation rather than gelation due to excessive peptide-peptide interactions. Similarly, Severin and Xia reported the LGCs of the samples as 8, 6, 12, 14, and > 20% when the whey protein concentrate was hydrolyzed with alcalase at 0, 5, 10, 15, and 20%, respectively [26].
ВЫВОДЫ
We prepared protein hydrolysates from the protein concentrate with varying degrees of hydrolysis (5, 10, and 15%) using alcalase and determined the effects of the hydrolysis degree on their functional properties, apparent molecular weight distribution, and chemical compositions. According to our results, the solubility of the hydrolysates improved compared to the intact protein concentrate. However, the oil holding capacity, the foaming stability, and the least gelation concentration of the protein concentrate could not be considerably improved by hydrolysis. In contrast, the emulsifying activity index and the foaming capacity of the protein concentrate could be increased with a limited degree of hydrolysis (up to 10%). Further studies are needed to investigate the effect of different proteolytic enzymes, as well as various drying and separation methods on the functional properties of sour cherry kernel protein concentrate.Вклад авторов
M. Yildirim contributed to the study conception and design. A. Cingöz performed material preparation, data collection, and analysis. A. Cingöz wrote the first draft of the manuscript and M. Yildirim commented on its previous versions. Both authors read and approved the final manuscript.КОНФЛИКТ ИНТЕРЕСОВ
The authors declare that there is no conflict of interest.СПИСОК ЛИТЕРАТУРЫ
- Yılmaz FM, Görgüç A, Karaaslan M, Vardin H, Ersus Bilek S, Uygun Ö, et al. Sour cherry by-products: Compositions, functional properties and recovery potentials – a review. Critical Reviews in Food Science and Nutrition. 2019;59(22):3549–3563. https://doi.org/10.1080/10408398.2018.1496901
- FAOSTAT. Crops and livestock products [Internet]. [cited 2022 Aug 15]. Available from: https://www.fao.org/faostat/en/#data/QC
- Toydemir G, Capanoglu E, Kamiloglu S, Boyacioglu D, de Vos RCH, Hall RD, et al. Changes in sour cherry (Prunus cerasus L.) antioxidants during nectar processing and in vitro gastrointestinal digestion. Journal of Functional Foods. 2013;5(3):1402–1413. https://doi.org/10.1016/j.jff.2013.05.008
- Kasapoğlu KN, Demircan E, Eryılmaz HS, Can Karaça A, Özçelik B. Sour cherry kernel as an unexploited processing waste: Optimisation of extraction conditions for protein recovery, functional properties and in vitro digestibility. Waste and Biomass Valorization. 2021;12:6685–6698. https://doi.org/10.1007/s12649-021-01417-x
- Çelik M, Güzel M, Yildirim M. Effect of pH on protein extraction from sour cherry kernels and functional properties of resulting protein concentrate. Journal of Food Science and Technology. 2019;56(6):3023–3032. https://doi.org/10.1007/s13197-019-03785-8
- López DN, Galante M, Raimundo G, Spelzini D, Boeris V. Functional properties of amaranth, quinoa and chia proteins and the biological activities of their hydrolyzates. Food Research International. 2019;116:419–429. https://doi.org/10.1016/j.foodres.2018.08.056
- Güzel M, Çelik M, Yildirim M. Effect of pH on protein extraction from mahaleb kernels and functional properties of resulting protein concentrate. International Journal of Food Engineering. 2019;15(7). https://doi.org/10.1515/ijfe-2018-0388
- Zhao G, Liu Y, Zhao M, Ren J, Yang B. Enzymatic hydrolysis and their effects on conformational and functional properties of peanut protein isolate. Food Chemistry. 2011;127(4):1438–1443. https://doi.org/10.1016/j.foodchem.2011.01.046
- Xu Y, Galanopoulos M, Sismour E, Ren S, Mersha Z, Lynch P, et al. Effect of enzymatic hydrolysis using endo-and exo-proteases on secondary structure, functional, and antioxidant properties of chickpea protein hydrolysates. Journal of Food Measurement and Characterization. 2020;14:343–352. https://doi.org/10.1007/s11694-019-00296-0
- Liang X, Cheng J, Sun J, Yang M, Luo X, Yang H, et al. Reduction of immunoreactivity and improvement of the nutritional qualities in cow milk products by enzymatic hydrolysis. LWT. 2021;150. https://doi.org/10.1016/j.lwt.2021.111994
- Adler-Nissen J. Enzymic hydrolysis of food proteins. London, New York,: Elsevier Applied Science; 1986. 427 p.
- AOAC Official Method 942.05. Ash of animal feed. Rockville: AOAC International; 2013.
- AOAC Official Method 925.10-1925. Solids (total) and moisture in flour. Rockville: AOAC International; 2005.
- Zhang W-H, Wu J, Weng L, Zhang H, Zhang J, Wu A. An improved phenol-sulfuric acid method for the determination of carbohydrates in the presence of persulfate. Carbohydrate Polymers. 2020;227. https://doi.org/10.1016/j.carbpol.2019.115332
- AOAC Official Method 984.13-1994. Protein in animal feed and pet food. Copper catalyst Kjeldahl method – Official first action. Rockville: AOAC International; 2019.
- Laemmli UK. Cleavage of structural proteins during the assembly of the head of bacteriophage-T4. Nature. 1970;227(5259):680–685. https://doi.org/10.1038/227680a0
- Du M, Xie J, Gong B, Xu X, Tang W, Li X, et al. Extraction, physicochemical characteristics and functional properties of Mung bean protein. Food Hydrocolloids. 2018;76:131–140. https://doi.org/10.1016/j.foodhyd.2017.01.003
- Wang J-S, Wang A-B, Zang X-P, Tan L, Xu B-Y, Chen H-H, et al. Physicochemical, functional and emulsion properties of edible protein from avocado (Persea americana Mill.) oil processing by-products. Food Chemistry. 2019;288:146–153. https://doi.org/10.1016/j.foodchem.2019.02.098
- Pearce KN, Kinsella JE. Emulsifying properties of proteins: Evaluation of a turbidimetric technique. Journal of Agricultural and Food Chemistry. 1978;26(3):716–723. https://doi.org/10.1021/jf60217a041
- Cui L, Bandillo N, Wang Y, Ohm J-B, Chen B, Rao J. Functionality and structure of yellow pea protein isolate as affected by cultivars and extraction pH. Food Hydrocolloids. 2020;108. https://doi.org/10.1016/j.foodhyd.2020.106008
- Rahman MS, Go G, Seo J-K, Gul K, Choi S-G, Yang H-S. Thiol concentration, structural characteristics and gelling properties of bovine heart protein concentrates. LWT. 2019;111:175–181. https://doi.org/10.1016/j.lwt.2019.05.030
- Yust MM, Pedroche J, Millán-Linares MC, Alcaide-Hidalgo JM, Millán F. Improvement of functional properties of chickpea proteins by hydrolysis with immobilised Alcalase. Food Chemistry. 2010;122(4):1212–1217. https://doi.org/10.1016/j.foodchem.2010.03.121
- Dias FFG, Taha AY, de Moura Bell LN. Effects of enzymatic extraction on the simultaneous extraction of oil and protein from full-fat almond flour, insoluble microstructure, emulsion stability and functionality. Future Foods. 2022;5. https://doi.org/10.1016/j.fufo.2022.100151
- Nisov A, Ercili-Cura D, Nordlund E. Limited hydrolysis of rice endosperm protein for improved techno-functional properties. Food Chemistry. 2020;302. https://doi.org/10.1016/j.foodchem.2019.125274
- Guan X, Yao H, Chen Z, Shan L, Zhang M. Some functional properties of oat bran protein concentrate modified by trypsin. Food Chemistry. 2007;101(1):163–170. https://doi.org/10.1016/j.foodchem.2006.01.011
- Severin S, Xia WS. Enzymatic hydrolysis of whey proteins by two different proteases and their effect on the functional properties of resulting protein hydrolysates. Journal of Food Biochemistry. 2006;30(1):77–97. https://doi.org/10.1111/j.1745-4514.2005.00048.x
- Guo C, Zhao X, Yang Y, Li M, Yu L. Effect of limited enzymatic hydrolysis on structural and functional properties of Elaeagnus mollis oil meal protein. Foods. 2022;11(21). https://doi.org/10.3390/foods11213393
- Vioque J, Sánchez-Vioque R, Clemente A, Pedroche J, Millán F. Partially hydrolyzed rapeseed protein isolates with improved functional properties. Journal of the American Oil Chemists' Society. 2000;77(4):447–450. https://doi.org/10.1007/s11746-000-0072-y
- Sun X, Zhang W, Zhang L, Tian S, Chen F. Effect of ultrasound-assisted extraction on the structure and emulsifying properties of peanut protein isolate. Journal of the Science of Food and Agriculture. 2021;101(3):1150–1160. https://doi.org/10.1002/jsfa.10726
- Jamdar SN, Rajalakshmi V, Pednekar MD, Juan F, Yardi V, Sharma A. Influence of degree of hydrolysis on functional properties, antioxidant activity and ACE inhibitory activity of peanut protein hydrolysate. Food Chemistry. 2010;121(1):178–184. https://doi.org/10.1016/j.foodchem.2009.12.027
