

Аннотация
The present study aimed to evaluate the effect of various bran sources, including wheat, barley, and rice, on the quality and volatile compounds of Egyptian ‘balady’ bread (Fino). The protein, fat, and total carbohydrates content of the studied brans ranged from 8.49 to 14.16%, 2.16 to 8.12%, and 34.38 to 85.06%, respectively. The mi- neral composition and colour parameters of the brans were also evaluated. The substitution of wheat flour with 10%, 20%, and 30% of different brans resulted in decreased loaf volume and specific volume, and increased loaf weight. A significant decrease in colour parameters (L, a, and b) of the bread crust and crumb were observed in all the sam- ples. The addition of bran at three concentrations showed a remarkable increase in the total phenolic content of the bread samples, compared to the control. The antioxidant activity of the bread samples fortified with brans showed the following order: RB (rice bran) > BB (barley bran) > WB (wheat bran), as determined by the DPPH and β-carotene assays. Thirty-six volatile compounds identified in the bread samples using GC-MS included 5 alcohols, 6 pyrazines, 2 acids, 9 aldehydes, 5 ketones, 3 esters, and 6 sulphur-containing compounds. Alcohols were the predominant volatile constituents accounting for 58.3; 61.57; 59.08; and 56.15% in the control and in the bread samples prepared with bran from rice, barley, and wheat, respectively.ВВЕДЕНИЕ
Bread is one of the most important sources of dietary fibres, micronutrients, proteins, and vitamins. Therefore, it is considered effective, when fortified with suitable fibre fractions, in treating various diseases, such as obesity, cardiovascular disease, type 2 diabetes, etc [1]. There is a growing demand for bread in the whole world, especially in developing countries such as Egypt. At the same time, consumers increasingly prefer functional foods that contain ingredients providing health benefits beyond basic nutrition [2, 3].
The whole grain of wheat consists of germ, endosperm, and bran. Milling results in a dramatic loss of healthy biochemical molecules, such as antiradical constituents, fibre, vitamins, and minerals, causing cardiovascular and other types of disease [4]. Only endosperm, which contains a significant amount of carbohydrates, remains after milling. However, cereal products prepared from whole grain are not as popular as those from refined flour due to reduced quality and degraded sensory properties caused by the presence of bran. The detrimental effects of bran can be decreased by various methods such as hydration, fermentation, and size reduction [5–7]. Bran is the main by-product of milling. It is a valuable and inexpensive source of dietary fibre that contains approximately 27% of total carbohydrates, 14% of protein, and 5% of minerals [8, 9]. The chemical composition of wheat bran depends on wheat variety, environmental conditions, etc. Therefore, the source of bran is a critical factor for the quality of wheat grain products [10].
The world production of rice bran reaches 29.3 million tons annually [11]. Introducing defatted rice bran in wheat flour is a useful method of increasing lysine, protein, and fibre contents [12]. A high protein content (11–17%), excellent nutritional value, and a considerable amount of fibre (20–27%) make rice bran a good source of bread fortification [13, 14]. The addition of rice bran at a concentration of 15–30% did not change the physicochemical properties of bread [15].
According to the Food and Agriculture Organisation (FAO), Egypt produces 117,113 tons of barley grains per annum on an area of about 87,752 ha [16]. It was reported by Anderson et al. that barley contains a significant amount of β-glucan which helps to reduce low density lipoprotein (LDL) and total cholesterol in serum of both humans and animals [17–19]. A study into the effect of barley bran on bread quality found that 15% was the best amount of barley bran for bread fortification that ensured high quality and health benefits [20].
Texture, volume, and appearance of bread are important quality criteria for consumers. However, taste and aroma play a dramatic role for both producers and consumers. Approximately 300 volatile compounds are identified in bread that fall into several classes such as alcohols, esters, aldehydes, etc. They result from various interactions between the type and concentration of ingredients during processing, yeast activity during fermentation, and fermentation conditions (time, temperature, etc.) [21, 22].
The current study aims to compare the effects of substituting wheat flour with various brans on the chemical composition, as well as antioxidant and volatile compounds of Egyptian Fino bread.
ОБЪЕКТЫ И МЕТОДЫ ИССЛЕДОВАНИЯ
Materials. Wheat flour (WF) (72% extraction) and wheat bran (WB) were obtained from the North Cairo Flour Mills Company (Egypt). Rice bran (RB) was obtained from a local milling factory (Zifta, Egypt). Barley bran (BB) was obtained from a pilot plant at the National Research Centre (Dokki, Egypt). All chemicals used in this study are of analytical grade.
Methods.
Milling. Barley grains (Giza, 136) were manually cleaned, tempered to 14% moisture content, milled using a Quadrumat Junior flour mill (Model MLV-202, Switzerland), and sieved to obtain flour and bran.
Stabilizing rice bran. The bran was immediately stabilized using oven heating (at 110°C for 10 minutes). Immediately subsequent to heating, the sample was removed from the oven and cooled to room temperature (25°C). The stabilized rice bran was milled into flour. The flour was screened through a 30-mesh sieve, supplemented with wheat flour, and stored under freezing conditions.
Making Fino bread. Different Fino bread blends were prepared by using WF (72% extraction) and the studied bran at a concentration of 10%, 20%, and 30%. Active dry yeast (1.5%), NaCl (1.5%), sugar (2%), shortening (1%), bread improver (1%), and water (an amount required to reach 500 Brabender Units of consistency) were added to each sample in the pilot plant at the National Research Centre (NRC) in Dokki, Egypt. Fino bread was made according to Hussein et al. in an electric oven (Mondial Formi, 4T 40/60, Italy) [23]. Firstly, yeast was dissolved in warm water (35°C) and added to the dry ingredients and the shortening; then the mixture was kneaded. The dough was fermented at 30°C for 30 min in a fermentation cabinet under 80–85% relative humidity. Then it was divided into 80 g pieces that were placed in the trays and proofed under the same conditions for 45 min. The dough loaves were baked at 325°C for 10–15 min after steaming for 10 sec. To enhance the browning process of protein bread, the dough pieces were brushed with melted margarine prior to baking. The baked loaves were cooled down at room temperature for 60 min. Weight, volume, and specific volume of the bread samples were determined as described by [24].
Analytical methods. Moisture, protein, fat, ash, and fibre of raw materials and Fino bread were determined according to AOAC Official Methods of Analysis International, while carbohydrates were calculated by difference as in Tadrus’s study [25, 26]. Individual elements (Ca, P, K, Na, Fe, Mn, and Cu) in all the samples were determined according to Chapman and Pratt [27]. Changes in Hunter colour parameters (L, a & b) of raw materials and Fino bread were followed up using a Tristimulus Colour Analyzer (Hunter, Lab Scan XE, Reston, Virginia) with a standard white tile.
Bread freshness. The freshness of the bread samples was tested at day 0, 3 and 7 of storage at room temperature by alkaline water retention capacity (AWRC) according to the method described by Hussein et al. [28].
Sensory properties. The Fino bread samples were evaluated for taste (20), aroma (20), mouth feel (10), crumb texture (15), crumb colour (10), break & shred (10), crust colour (10), and symmetry shape (5) according to the method described in [24].
Total phenolics extraction. Ten grams of powderedbread was extracted with 75 ml 100% methanol at 25°C for 24 hours along with stirring followed by filtration using Whatman no.1 filter paper. The residues were re-extracted twice as described above. The combined methanolic extracts were evaporated at 40°C under vacuum until dry.
Total phenolics determination. The concentration of phenolic compounds in the bread samples was estimated with the Folin–Ciocalteu reagent according to the method described by Singleton and Rossi [29]. One millilitre of a sample (5 mg) was mixed with 1 ml of the Folin-Ciocalteu’s phenol reagent. After 3 min, 1 ml of saturated sodium carbonate (20%) solution was added to the mixture and adjusted to 10 ml with distilled water. The reaction was kept in the dark for 90 min, after which the absorbance was read at 765 nm. Gallic acid was used to construct the standard curve (8–80 μg/ml). The results were expressed as mg of GAEs (gallic acid equivalents/g).
Determination of free radical scavenging activity. The antioxidant activity of the methanol extracts was determined by the DPPH radical scavenging method as described by Woldegiorgis et al. [30]. A 0.004% solution of the DPPH radical solution in methanol was prepared and then 2 ml of the DPPH solution was mixed with 1 ml of various concentrations (0.1–0.5 mg/ml) of the extracts in methanol. Finally, the samples were incubated for 30 min in the dark at room temperature. The scavenging capacity was read spectrophotometrically by monitoring the decrease in absorbance at 517 nm. The inhibition of free radical DPPH in percent (I %) was then calculated.
The scavenging activity, %, was calculated using the following formula:
![]()
β-Carotene-linoleate bleaching assay. The antioxidant activity of the methanol extract with various concentrations (0.1–0.5 mg/ml) was assayed according to the β-Carotene-linoleate bleaching method developed by Velioglu et al. [31]. 0.2 mg of β-Carotene (in 1 ml chloroform), 0.02 ml of linoleic acid, and 0.2 ml of Tween were transferred into a round bottom flask. The mixture was then added to 0.2 mg of methanolic extract prepared for the β-carotene-linoleate bleaching assay or 0.2 ml of standard methanol (as a control). Chloroform was removed at room temperature under vacuum at reduced pressure using a rotary evaporator. Following evaporation, 50 ml of distilled water was added to the mixture and then shaken vigorously to form an emulsion. Two millilitres aliquots of the emulsion was taken in test tubes and immediately placed in a water bath at 50°C. The absorbance was measured at 470 nm by a UV-Vis Shimadzu (UV-1601, PC) spectrophotometer. Readings of all the samples were performed immediately (t = 0 min) and after 120 minutes of incubation. The antioxidant activity (%) was evaluated in terms of β-carotene bleaching inhibition using as follows:
![]()
where At and Ct are the absorbance values measured for the test sample and control, respectively, after 120 min incubation, and C0 is the absorbance values for the control measured at zero time during incubation. All the experiments were carried out in triplicate.
Ascorbic acid was used as a standard, and the extract-free mixture was used as a control.
Volatile compounds analysis. Flavour compounds were identified by GC/MS analyses. The instruments included a static headspace (Agilent 7890 GC coupled to a 5977 MS detector) with a column (DB-5; J&W Scientific Inc.) of 60 m in length, 0.25 mm in inside diameter, and 0.25 μm in membrane thickness. We also used a mass spectrometer (Automass SUN-200S; JEOL Ltd.) with a mass spectral search programme (Version 2.0; National Institute of Standards & Technology) for library search and identification, as well as software (EZChrom Elite; GL Sciences Inc.) for the quantification of identified total ion peak areas. For the static headspace, 3 grams of the whole bread samples were encapsulated in a glass vial container (22 ml). The analytical conditions of the headspace included a sample weight of 3 g, a sample temperature of 80°C, an injection temperature of 160°C, an injection duration of 36 sec, a needle temperature of 80°C, and a transferring temperature of 160°C. High-purity helium carrier gas (1.2 ml/min) was employed for gas chromatography. The column was held at 50°C for 3 min, with the temperature programmed to 220°C at a heating rate of 4°C/min, and then held at 220°C for 15 min. The analytical conditions of the mass spectrometer included an interface temperature of 220°C, a transferring temperature of 160°C, and an ion source temperature of 230°C. The ionization energy of the mass spectrometer was 70 eV and a scan cycle time was 0.5 ms (33–40 m/z).
Compounds identification. The linear retention index (RI) values for unknowns were determined based on retention time data obtained by analyzing a series of normal alkanes (C6–C22). Volatile components were positively identified by matching their RI values and mass spectra with those of standards, also run under identical chromatographic conditions in the laboratory (Adams, 2007).
Statistical analysis. The obtained results were evaluated statistically using analysis of variance as reported by Mc-Clave and Benson [32].
РЕЗУЛЬТАТЫ И ИХ ОБСУЖДЕНИЕ
Chemical composition of wheat flour and bran. The proximate composition of the brans under study is presented in Table 1. The protein content of different brans ranged from 8.49 to 14.16%. The fat content varied from 2.16 to 8.12% in BB and RB, respectively. Rice bran exhibited the most concentrated source of dietary fibre (36.18%) among all cereal brans. Barley bran had the maximum value for total carbohydrates (67.35%). Maximum ash content (14.59%) was observed in wheat bran. Wheat flour (72%) contained 85.06% of carbohydrates. Similar results were reported by O. Ozdestan et al. [33, 34].
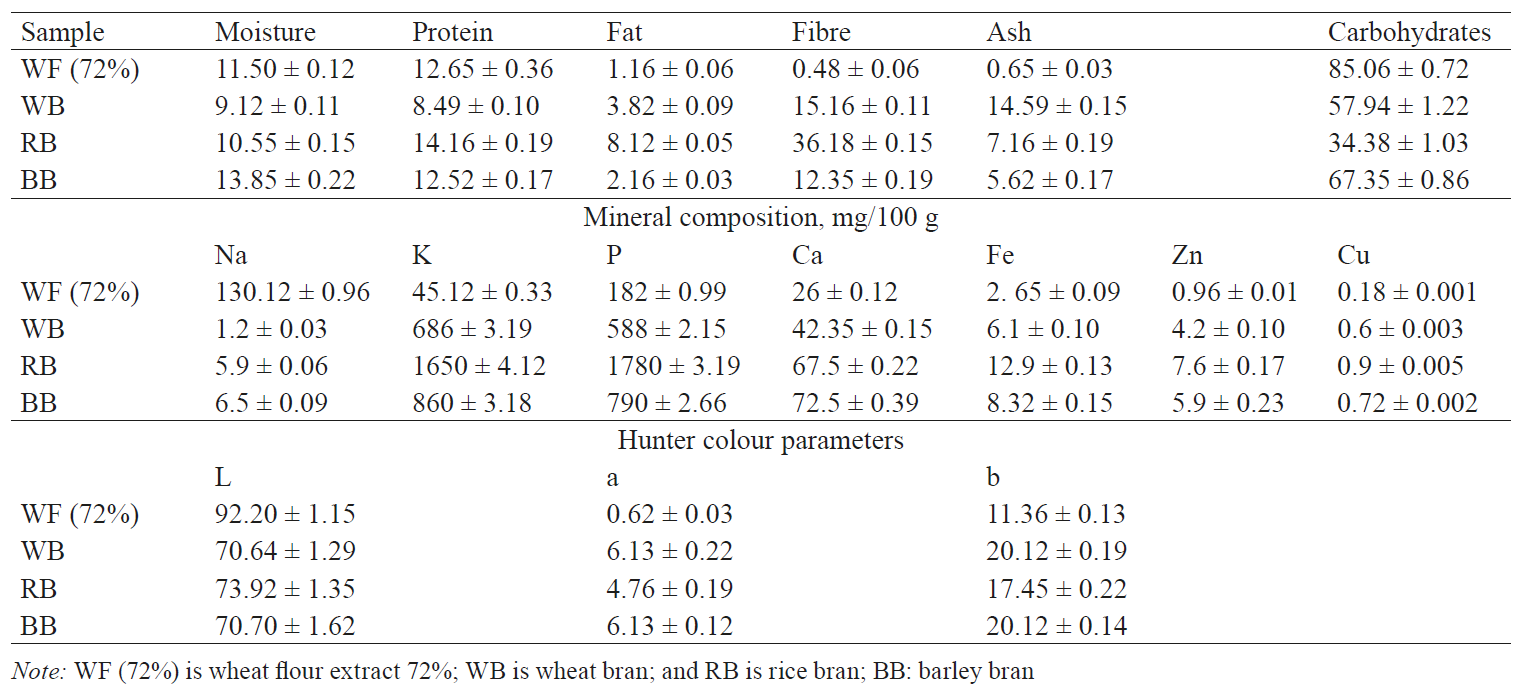
Mineral content. According to Table 1, the brans under study were superior in sodium, potassium, phosphorus, calcium, iron, zinc, and copper, compared to wheat flour. These data agree with those found by Faria et al. who reported that Ca and P contents were 63.3 and 979 mg/100 g in rice bran and 65 and 979 mg/100 g in stabilized rice bran, respectively [35]. Also, the results in Table 1 showed an increased amount of K and P in rice bran, compared to the other raw materials.
Colour attributes. Colour plays an important role in the consumer’s choice of foods, especially bakery products. The colour parameters of the brans, as well as wheat flour 72%, were evaluated using a Hunter laboratory colourimeter (Table 1). The bran samples were darker than WF. The same trend was observed with yellowness (a*): it was higher for different brans, compared to wheat flour. The obtained results are in good agreement with Kim et al. And Ramy et al.: the presence of bran produces darker bakery products [36, 37]. Therefore, we should control its concentration or use suitable additives to reduce this browning.
Bran effects on physical properties. The physical characteristics of the Fino bread produced with different concentrations of brans are presented in Table 2. The results revealed an increase in the loaf weight and a decrease in the loaf volume as the bran level increased, which was true for all types of bran. A significant volume decrease was observed in the bread supplemented with rice bran, compared to the other brans. We believe that this effect was caused by a high fibre content in rice bran (Table 1) and its higher water holding capacity. Another explanation of the reduced loaf volume could be the dilution effect of bran on gluten and a lower retention of CO2. The specific loaf volume of bread containing 20 or 30% of bran had lower values compared to that of the control sample (Table 2). The volume parameters are critical for consumer acceptance [38]. The loaf volume gradually decreased in all the bread samples, compared to the control, with its values ranging from 220 (for 30% of BB) to 280 cm3 (for 10% of WB).
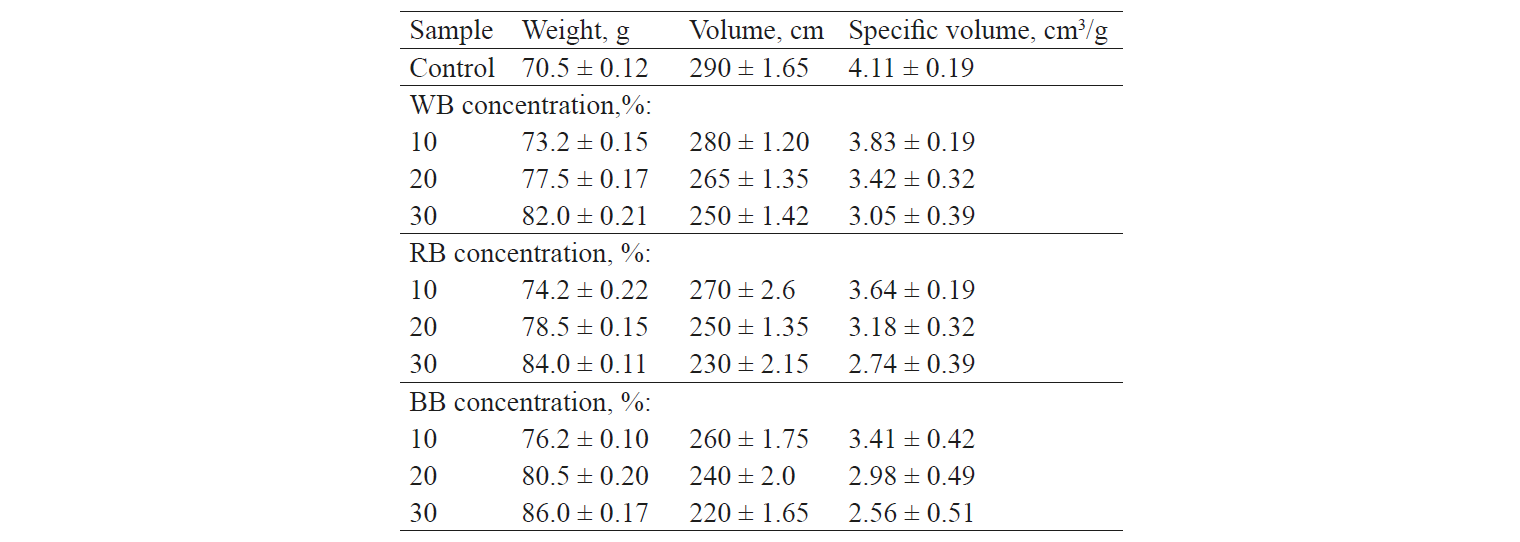
These results were in agreement with [39] that substituted wheat flour with high concentrations of rice bran (20 and 30%), which decreased the loaf volume.
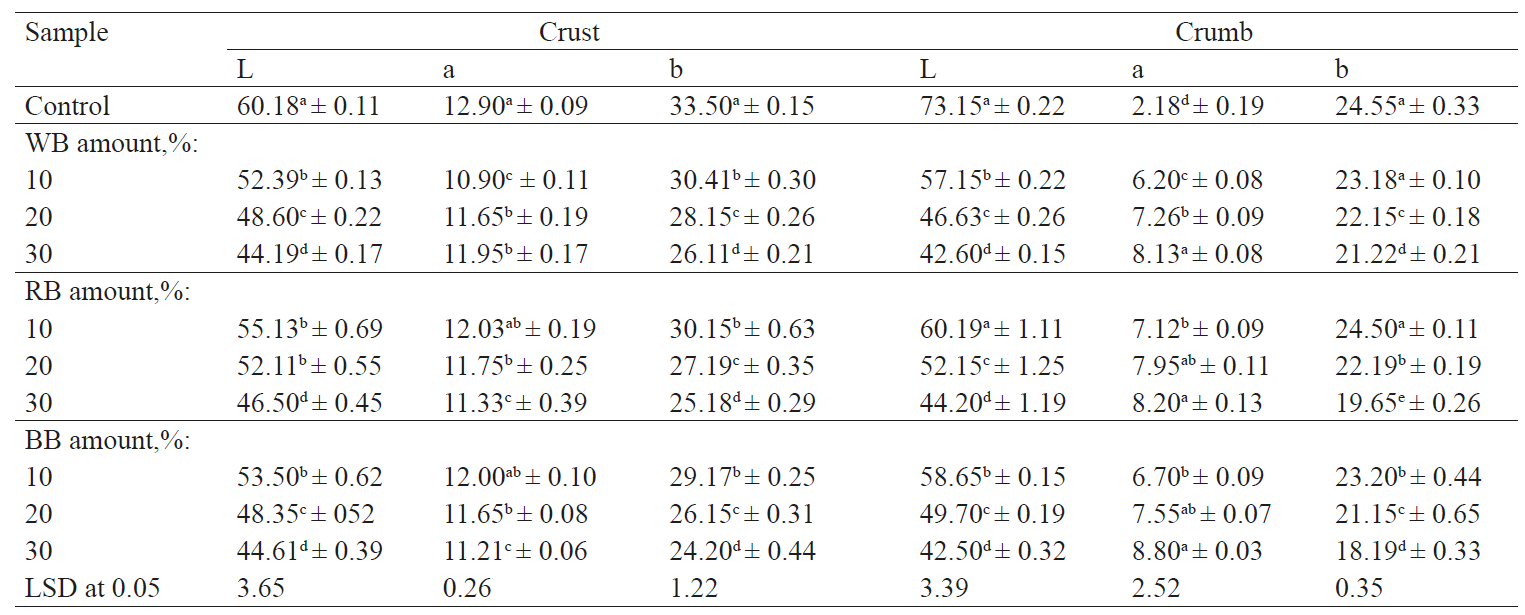
Bran effects on colour attributes. The colour measurements of different bread samples are shown in Table 3. The bread samples containing different proportions of bran had lower values of L, b, and a; moreover, the values decreased as the concentration of bran increased. All the fortified samples had slightly lower L values for crust than the control and therefore a slightly darker crumb colour was noticed.
Bran effects on sensory evaluation. The sensory characteristics of the Fino bread samples with different amounts of WB, RB, and BB are shown in Table 4. The results indicated that the addition of bran did not have a clear effect on the crust and crumb colour, whereas its effect on taste and smoothness was quite remarkable. All the changes, however, were in the acceptable range. The colour changes may be due a higher content of reducing sugars in bran, compared to wheat flour, and the Maillard reaction during the baking process. We can also notice that increased concentrations of bran lead to a gradual decrease in hardness and smoothness, especially in the bread samples containing 30% of WB, RB, and BB. The results also showed a significant effect of WB, RB, and BB on the aroma of bread, primarily due to the flavour compounds.
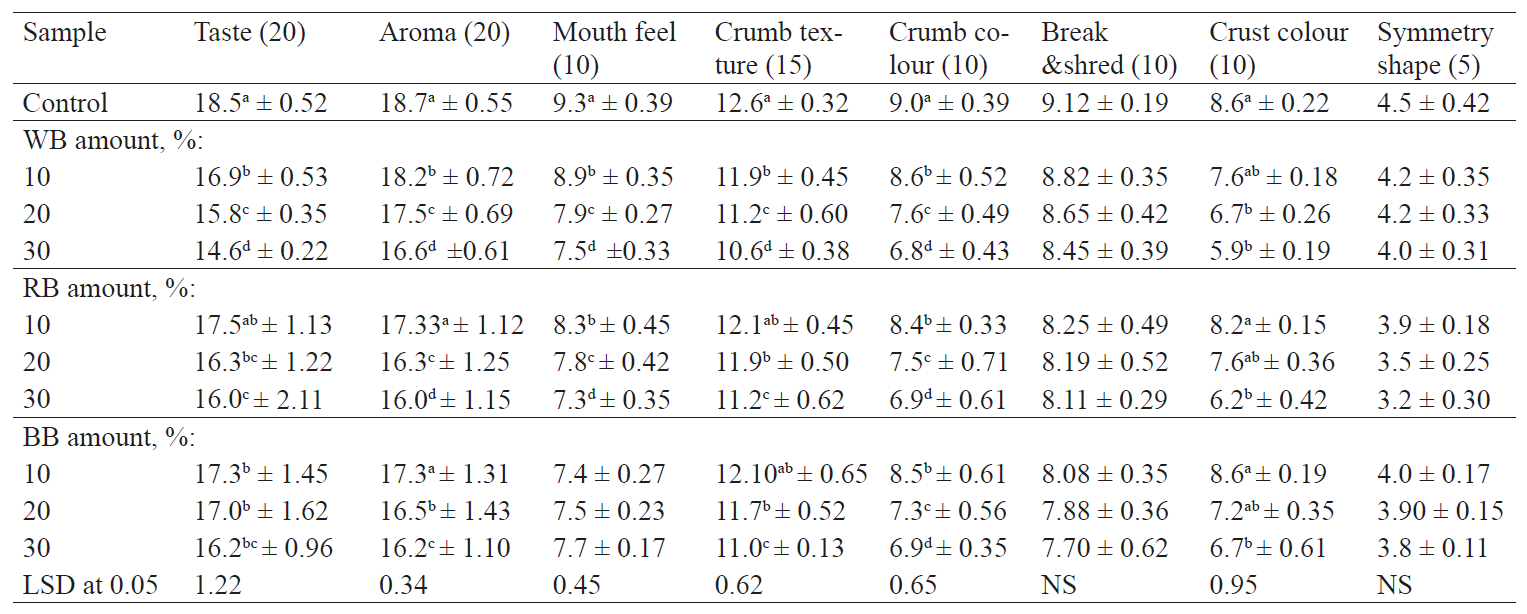
The bread samples with 30% of WB, RB, and BB were significantly harder than the others. This may be due to the dilution of gluten and the thickening of the walls surrounding air bubbles in the crumb [40, 41]. All the Fino bread samples containing WB, RB, and BB showed an observed acceptability. Also, the addition of the brans changed the bread colour slightly and reduced the size of the holes, as confirmed by Sharma and Chauhan [39]. As can be noticed, there were no significant differences in break and shred and symmetry shape between the Fino bread from WF (control) and the samples with 10% of WB. However, the samples fortified with bran manifested significant differences in taste, aroma, mouth feel, crumb texture and colour, and crust colour. As the bran level increased, the crust colour score decreased.
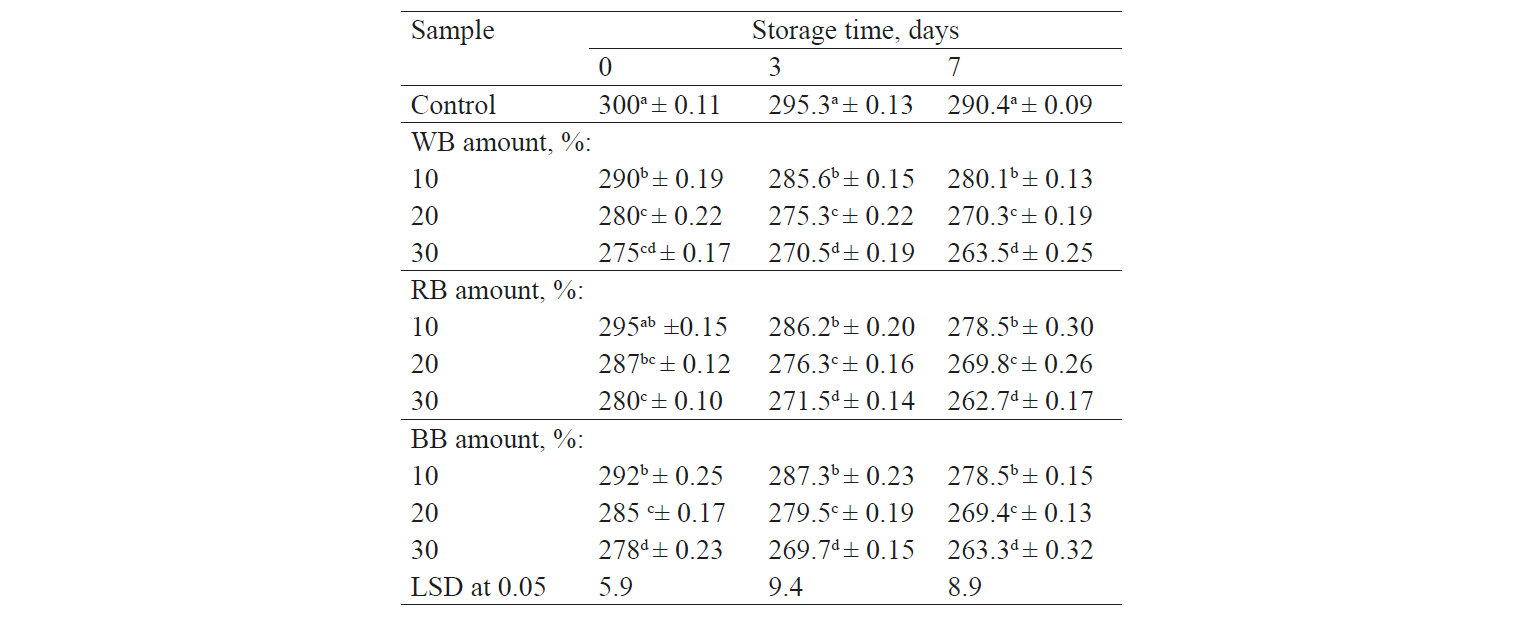
Bran effects on staling. The changes that occur after baking can be defined as staling. They can be measured by the alkaline water retention capacity (AWRC) test. Increases in the AWRC showed the freshness of baked products [42]. Our results revealed a gradual increase in the staling rate for all the Fino bread samples during a prolonged storage time of about 7 days (Table 5). No differences were observed in the first 3 days, while 7 days of storage caused an increase in the staling rate for all the bread samples. It is clear that the Fino bread with WB, RB, and BB at concentrations of 10, 20, and 30% was fresher than the control under the same conditions due to its higher water retention capacity and a consequent improvement of its staling rate. This might be due to a higher content of fibres in bran-fortified bread compared to the control. The Fino bread samples with 10 or 20% of bran had a higher water retention capacity, compared to the control. Such an increase can be related to a higher hydrophilic nature of proteins. It was noticed that the bread fortified with 10 or 20% of bran showed a better consistency or high texture characteristics.
Bran effects on total phenolic content and antioxidant activity. The total phenolic content (TFC) of the brans under study, as well as the bread samples fortified with different concentrations of bran, was determined by the Folin-Ciocalteu method (Fig. 1). It was clear that the addition of all the brans showed a remarkable increase in the total phenolic content of the bread samples, compared to the control. The highest increase was found in the rice bran treatment, followed by barley bran and wheat bran, respectively.

The data obtained agree well with M. Irakli et al. who found an increase in both free and bound phenolic content in bread prepared with rice bran [43]. Also, a significant increase in the total phenolic content was reported by Laokuldilok et al. for the bread baked with red and black rice bran, compared to the control samples [44]. The surveys show no clear trend regarding the effect of thermal treatment on the total phenolic content of bread after baking. The degradation or damage of antioxidant components in flour during heating or baking may increase the total phenolic content, as reported by Holtekjolen et al. [45]. Another explanation, offered by Dordevic et al., is that fermentation increases the concentration of various bioactive components in cereals, as well as the Maillard reaction, which may increase the total phenolic content during evaluation [46].
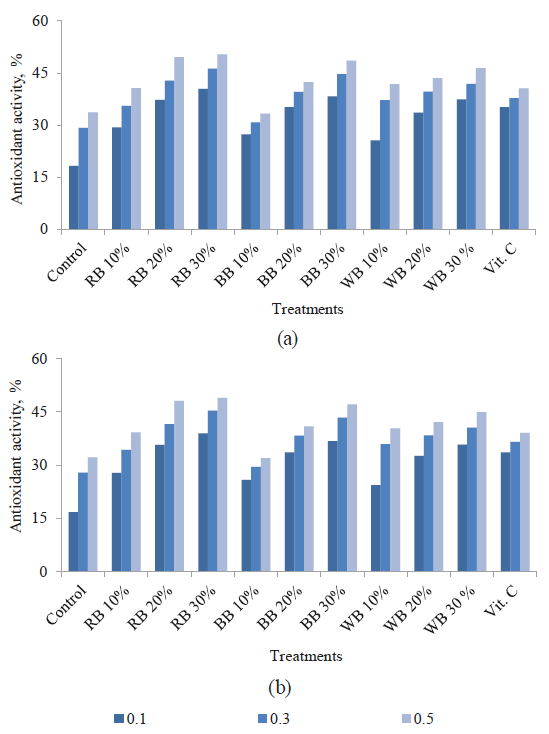
The antioxidant activity of the control and the bread samples with different concentrations of brans were determined by the DPPH and β-carotene assays. Fig. 2 shows a significant increase in the antioxidant activity of the bread samples, compared to the control, especially in the 30% amount of the brains. According to Fig. 2, the order of the antioxidant activity for the bread samples fortified with bran was as follows: RB ˃ BB ˃ WB. The correlation between the total phenolic content of bran and the antioxidant activity is in good agreement with Stratil et al. [47]. It was found that increased amounts of bran led to an increased antioxidant activity (Fig. 2).
Bran effects on volatile compounds. The sensory evaluation of the control and the bread samples made with various brans showed that in increased amounts of substitution had a negative effect on the sensory properties, especially on taste and aroma. Therefore, we selected the samples with 10% of the brans for volatile analysis using HS-GC/MS (Table 6).
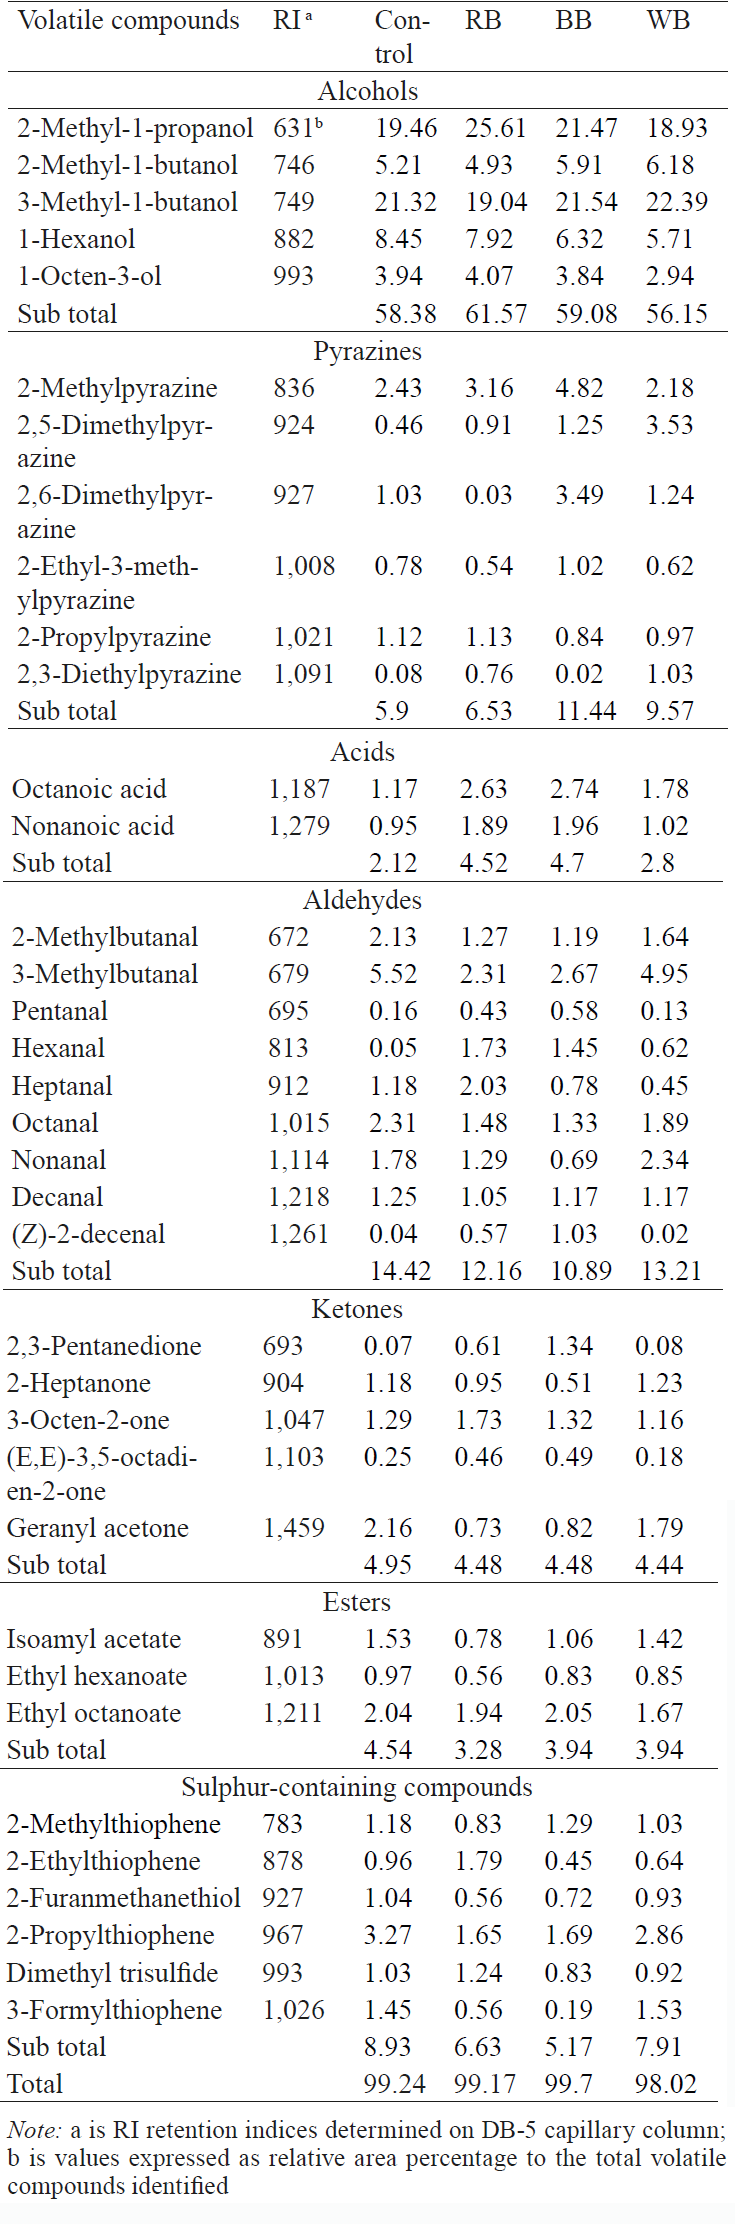
The volatile compounds identified in bread (thirty-six) belonged to major chemical compounds: 5 alcohols, 6 pyrazines, 2 acids, 9 aldehydes, 5 ketones, 3 esters, and 6 sulphur-containing compounds [48, 49]. The volatile compounds identified as relative peak areas are listed in Table 6.
The analysis of volatile compounds using GC-MS showed that alcohols were the predominant volatile constituents accounting for 58.38; 61.57; 59.08; and 56.15% in the control and in the breads with bran from rice, barley, and wheat, respectively (Table 6). The main alcohols were 3-methyl-1-butanol and 2-methyl-1-propanol in the control sample at concentrations of 21.32 % and 19.46%, respectively. The high concentration of alcohols (61.57%) in the bread with rice bran may explain the low scores of sensory evaluation in this treatment. Some alcohols, such as 1-Octen-3-ol and hexanol, have a negative effect on the aroma of bread [50]. Our results revealed that these alcohols had higher concentrations in RB-containing bread, compared to the control and the other bread samples (Table 6). The second major volatile compound was aldehydes: 14.42% in the control sample and 13.21; 12.16; and 10.89% in the breads with brans from wheat, rice, and barley, respectively (Table 6). Among the most important aldehydes are octanal and nonanal, which have a positive effect on the flavour of bread [51]. These aldehydes were higher in the bread with wheat bran, compared to the other samples (Table 6), which can explain its higher acceptability according to the sensory evaluation (Table 4). Generally, the most common compounds of alcohols and aldehydes produce a positive effect on the bread flavour together with low levels of acids, and they could be used to explain the sensory analysis, as reported by Quilez et al. [52]. The contribution of an aroma compound to the flavour of food depends on its odour threshold, concentration, and food matrix, as well as the release of this volatile during mastication [53].
ВЫВОДЫ
The present study emphasizes the importance of substituting wheat flour with bran to improve the nutritional value and fibre content of bread. While no significant changes in sensory evaluation were observed at a substitution amount of 10%, higher concentrations of bran significantly increased the total phenolic content and the antioxidant activity, and led to a negative sensory evaluation, compared to the control sample. However, all the changes were in the range of acceptability. Therefore, the study will extend to evaluate the changes during storage under various conditions to valorise the use of these cheap and nutraceutical ingredients in bread-making to produce highly acceptable functional foods with health benefits.
СПИСОК ЛИТЕРАТУРЫ
- Ragaee S., Guzar I., Abdel-Aal E., and Seetharaman K. Bioactive components and antioxidant capacity of Ontar- io hard and soft wheat varieties. Canadian Journal of Plant Science, 2012, vol. 92 pp. 19–30. DOI: https://doi. org/10.4141/cjps2011-100.
- Maneju H., UdobI C.E., and Joel N. Effect of added brewers dry grain on the physico-chemical, microbial and sen- sory quality of wheat bread. American Journal of Food Nutrition, 2011, vol. 1, no. 1, pp. 39–43. DOI: https://doi. org/10.5251/ajfn.2011.1.1.39.43.
- Taylor J. and Rosell C. Foreword to special issue on Cereal Based Non-gluten Dough Systems. Journal of Cereal Science, 2016, vol. 67, pp. 1. DOI: https://doi.org/10.1016/j.jcs.2015.10.001.
- Mellen P.B., Walsh T.F., and Herrington D.M. Whole grain intake and cardiovascular disease: a meta-analysis Nu- trition, Metabolism & Cardiovascular Diseases, 2008, vol. 18, no. 4, pp. 283–290. DOI: https://doi.org/10.1016/j. numecd.2006.12.008.
- Cai L.M., Choi I., Park C.S., and Baik B.K. Bran hydration and physical treatments improve the bread-baking qual- ity of whole grain wheat flour. Cereal Chemistry, 2015, vol. 92, no. 6, pp. 557–564. DOI: https://doi.org/10.1094/ CCHEM-04-15-0064-R.
- Messia M.C., Reale A., Maiuro L., et al. Effects of pre-fermented wheat bran on dough and bread characteristics.Journal of Cereal Science, 2016, vol. 69, pp. 138–144. DOI: https://doi.org/10.1016/j.jcs.2016.03.004.
- Wang N.F., Hou G.G., and Dubat A. Effects of flour particle size on the quality attributes of reconstituted whole-wheat flour and Chinese southern-type steamed bread. LWT – Food Science and Technology, 2017, vol. 82, pp. 147–153. DOI: https://doi.org/10.1016/j.lwt.2017.04.025.
- Anwarul H., Shams U., and Anwarul A. The effect of aqueous extracted wheat bran on the baking quality of biscuit. International Journal of Food Science & Technology, 2002, vol. 37, no. 4, pp. 453–462. DOI: https://doi.org/10.1046/ j.1365-2621.2002.00583.x.
- Kumar P., Yadava R., Gollen B., et al. Nutritional contents and me dicinal properties of wheat: a Review. Life Sciences and Medicine Research, 2011, vol. 22, pp. 1–10.
- Cai L.M., Choi I., Lee C.K., Park K.K. and Baik B.K. Bran characteristics and bread-baking quality of whole grainwheat flour. Cereal Chemistry, 2014, vol. 91, no. 4, pp. 398–405. DOI: https://doi.org/10.1094/CCHEM-09-13-0198-R.
- Sharif M.K., Butt M.S., Anjum F.M., and Khan S.H. Rice Bran: A Novel Functional Ingredient. Critical Reviews in Food Science and Nutrition, 2014, vol. 54 no. 6, pp. 807–816. DOI: https://doi.org/10.1080/10408398.2011.608586.
- Sekhon K.S., Dhillon S.S., Singh N., and Singh B. Functional Suitability of Commercially Milled Rice Bran in India for Use in Different Food Products. Plant Foods for Human Nutrition, 1997, vol. 50, no. 2, pp. 127–140. DOI: https:// doi.org/10.1007/BF02436032.
- Saunders R.M. The Properties of Rice Bran as a Food Stuff. Cereal Foods World, 1990, vol. 35, no. 7, pp. 632–639.
- Deep N., Yadav-Krishna K., and Singh-Jagbir R. Studies on fortification of wheat flour with defatted rice bran for chapati making. Journal of Food Science and Technology, 2012, vol. 49, no. 1, pp. 96–102. DOI: https://doi. org/10.1007/s13197-011-0264-9.
- Sharp C.Q. and Kitchen K.J. Using rice bran in yeast bread in a home baker. Cereal Foods World, 1990, vol. 35, pp. 1021–1028.
- Food and Agriculture Organization. FAOSTAT, 2010. Available at: https://faostat.fao.org. (accessed 18 December 2018).
- Anderson M.A., Cook J.A., and Stone B.A. Enzymatic determination of (1-3) (1-4) B-glucans in barley grain and other cereal. Journal of the Institute of Brewing, 1978, vol. 84, no. 4, pp. 233–239. DOI: https://doi. org/10.1002/j.2050-0416.1978.tb03880.x.
- Ranhotra G.S., Gelroth J.A., and Eisenbroun G.J. High fiber white flour and its use in cookie products. Cereal chem- istry, 1991, vol. 68, no. 4, pp. 432–434.
- Braaten J.T., Wood P.D., Scott F.W., et al. Oat B-glucan reduces blood cholesterol concentration in hypercholesterol- emia subjects. European Journal of Clinical Nutrition, 1994, vol. 48, pp. 465–474.
- Abou-Raya M.A., Rabiae M.M., El-Shazly A.S., and E1-Fadaly E.S. Effect of adding barley and oat flour on the rhe- ological properties of bread dough. Journal of Food and Dairy Science, Mansoura Univirsty, 2014, vol. 5, no. 8, pp. 641–652.
- Birch A.N., Petersen M.A., and Hansen A.S. The aroma profile of wheat bread crumb influenced by yeast con- centration and fermentation temperature. LWT – Food Science and Technology, 2012, vol. 50, no. 2, pp. 480–488. DOI: https://doi.org/10.1016/j.lwt.2012.08.019.
- Birch A.N., Petersen M.A., Arneborg N., and Hansen A.S. Influence of commercial baker’s yeasts on bread aro- ma profiles. Food Research International, 2013, vol. 52, no. 1, pp. 160–166. DOI: https://doi.org/10.1016/j. foodres.2013.03.011.
- Hussein A.M.S., Helmy I.M.F., and Shalaby A.R. Effect of replacing wheat flour and corn flour using sweet potato flour on quality of bread. Modelling Measurement and Control C, 2010, vol. 71, no. 1–2, pp. 1–23.
- American Association of Cereal Chemists. Approved Method of the AACC. 10th ed. USA, St. Paul: American Associa- tion of Cereal Chemists Publ., 2000.
- Horwitz W. AOAC Official Methods of Analysis International, 17th ed. USA, Maryland, 2000.
- Tadrus M.D. Chemical and biological studies on some baby food. Egypt: Cairo University Publ., 1989.
- Chapman H.D. and Pratt P.F. Methods of Analysis for Soils, Plant and Water. California: University of California Division of Agriculture Science Publ., 1978. 309 p.
- Hussein A.M.S, Kamil M.M., Hegazy N.A., and Abo El-Nor S.A.H. Effect of wheat flour supplemented with bare- ly and/or corn flour on balady bread quality. Polish Journal of Food and Nutrition Sciences, 2013, vol. 63, no. 1, pp. 11–18. DOI: https://doi.org/10.2478/v10222-012-0064-6.
- Singleton V.L. and Rossi J.A. Colorimetry of Total Phenolics with Phospho Molybdic Phosphotungstic Acid Re- agents. American Journal of Enology and Viticulture, 1965, vol. 37, pp. 144–158. Available at: http://www.ajevonline. org/content/16/3/144.full.pdf+html. (accessed 18 December 2018).
- Woldegiorgis A., Abate D., Haki G.D., and Ziegler G.R. Antioxidant property of edible mushrooms collected from Ethiopia. Food Chemistry, 2014, vol. 157, pp. 30–36. DOI: https://doi.org/10.1016/j.foodchem.2014.02.014.
- Velioglu Y.S., Mazza G., Gao L., and Oomah B.D. Antioxidant Activity and Total Phenolics in Selected Fruits, Veg- etables, and Grain Products. Journal of Agricultural and Food Chemistry, 1998, vol. 46, no. 10, pp. 4113–4117. DOI: https://doi.org/10.1021/jf9801973.
- McClave J.T. and Benson P.G. Statistics for Business and Economics. USA, San Francisco: Dellen Publ., 1991.
- Ozdestan O., Erol T., and Acar B. Phytosterols in rice bran and usage of rice bran in food industry. Foodbalt, 2014, pp. 24–27.
- Abbas H.M., Ahmed M.H., and Ibrahim G. E. Changes in antioxidant activity and volatile compounds of functional yoghurt fortified with rice bran during storage. Journal of Chemical and Pharmaceutical Research, 2016, vol. 8, no. 7, pp. 761–766.
- Faria C., Zaczuk P., and Camargo-Penteado M. Nutritional composition of rice bran submitted to different stabiliza- tion procedures. Brazilian Journal of Pharmaceutical Sciences, 2012, vol. 48, no. 4, pp. 651–657. DOI: https://doi. org/10.1590/S1984-82502012000400008.
- Kim Y.S., Ha T.Y., Lee S.H., and Lee H.Y. Effect of rice bran dietary fiber on flour rheology and quality of wet noodles.Korean Journal of Food Science and Technology, 1997, vol. 20, pp. 90–95.
- Ramy A., Salama M.F., and Shouk A.A. Pollards a potential source of dietary fiber for pasta manufacture. Egyptian Journal of Food Science, 2002, vol. 30, pp. 313–330.
- Masoodi F., Bhawana S., and Chauhan G. Use of apple pomace as a source of dietary fiber in cakes. Plant Foods for human Nutrition, 2002, vol. 57, no. 2, pp. 121–128. DOI: https://doi.org/10.1023/A:1015264032164.
- Sharma H. and Chauhan G. Effect of stabilized rice-fenugreek blends on the quality of bread and cookies. Journal of Food Science and Nutrition, 2002, vol. 39, no. 3, pp. 223–333.
- Wang J., Rossel M., and De-Barber C.B. Effect of the addition different fibers on wheat dough performance and breadquality. Food Chemistry, 2002, vol. 79, no. 2, pp. 221–226. DOI: https://doi.org/10.1016/S0308-8146(02)00135-8.
- Sivam A.S, Sun-Waterhouse D., Quek S.K., and Perera C.O. Properties of Bread Dough with Added Fiber Polysac- charides and Phenolic Antioxidants: A Review. Journal Food Science, 2010, vol. 75, no. 8, pp. 163–174. DOI: https:// doi.org/10.1111/j.1750-3841.2010.01815.x.
- Gray J.A. and Bemiller J.N. Bread Staling: Molecular Basis and Control. Comprehensive Reviews in Food Science and Food Safety, 2003, vol. 2, no. 1, pp. 1–21. DOI: https://doi.org/10.1111/j.1541-4337.2003.tb00011.x.
- Irakli M., Dimitris K., and Fotis K. Evaluation of quality attributes, nutraceutical components and antioxidant poten- tial of wheat bread substituted with rice bran. Journal of Cereal Science, 2015, vol. 65, pp. 74–80. DOI: https://doi. org/10.1016/j.jcs.2015.06.010.
- Laokuldilok T., Shoemake C.F., Jomgkaewwattana S., and Tulyathan V. Antioxidants and Antioxidant Activity of Several Pigmented Rice Brans. Journal of Agricultural and Food Chemistry, 2011, vol. 59, no. 1, pp. 193–199. DOI: https://doi.org/10.1021/jf103649q.
- Holtekjolen A.K., Baevre A.B., Rodbotten M., Berg H., and Knutsen S.H. Antioxidant properties and sensory profiles of breads containing barley flour. Food Chemistry, 2008, vol. 110, no. 2, pp. 414–421. DOI: https://doi.org/10.1016/j. foodchem.2008.02.054.
- Dordevic T.M., Siler-Marinkovi S.S., and Dimitrijevi-Brankovic S.I. Effect of fermentation on antioxidant prop- erties of some cereals and pseudo cereals. Food Chemistry, 2010, vol. 119, no. 3, pp. 957–963. DOI: https://doi. org/10.1016/j.foodchem.2009.07.049.
- Stratil P., Klejdus B., and Kuban V. Determination of phenolic compounds and their antioxidant activity in fruits andcereals. Talanta, 2007, vol. 71, no. 4, pp. 1741–1751. DOI: https://doi.org/10.1016/j.talanta.2006.08.012.
- Birch A.N., Petersen M.A., and Hansen A.S. Aroma of Wheat Bread Crumb. Cereal Chemistry, 2014, vol. 91, no. 2, pp. 105–114. DOI: https://doi.org/10.1094/CCHEM-06-13-0121-RW.
- Pico J., Bernal J., and Gomez M. Wheat bread aroma compounds in crumb and crust: A review. Food Research Inter- national, 2015, vol. 75, pp. 200–215. DOI: https://doi.org/10.1016/j.foodres.2015.05.051.
- Paraskevopoulou A., Chrysanthou A., and Koutidou M. Characterisation of volatile compounds of lupin protein iso- late-enriched wheat flour bread. Food Research International, 2012, vol. 48, no. 2, pp. 568–577. DOI: https://doi. org/10.1016/j.foodres.2012.05.028.
- Rehman S., Paterson A., and Piggott J.R. Flavour in sourdough bread: a review. Trends in Food Science and Technol- ogy, 2006, vol. 17, no. 10, pp. 557–566. DOI: https://doi.org/10.1016/j.tifs.2006.03.006.
- Quilez J., Ruiz J.A., and Romero M.P. Relationships Between Sensory Flavor Evaluation and Volatile and Nonvolatile Compounds in Commercial Wheat Bread Type Baguette. Journal of Food Science, 2006, vol. 71, no. 6, pp. S423– S427. DOI: https://doi.org/10.1111/j.1750-3841.2006.00053.x.
- Ktenioudaki A., Crofton E., Scannell G.M., et al. Sensory properties and aromatic composition of baked snacks containing brewer’s spent grain. Journal of Cereal Science, 2013, vol. 57, no. 3, pp. 384–390. DOI: https://doi. org/10.1016/j.jcs.2013.01.009.
- Adams, R. (2007). Identification of essential oil components by gas chromatography/mass spectrometry, 4th Ed. Al- lured Publishing Corporation, Carol Stream, Illinois, USA.
