

Abstract
Synbiotic compositions have a great potential for curing microbial intestinal infections. Novel targeted synbiotics are a promising field of the modern functional food industry. The present research assessed the effect of various fructan fractions, initial probiotic counts, and test strains on the antagonistic properties of synbiotics.The research involved powdered roots of Arctium lappa L. and strains of Bifidobacterium bifidum, Bacillus cereus, and Salmonella enterica. The experiment was based on the central composite rotatable design. A water extract of A. lappa roots was purified and concentrated. Fructan fractions were precipitated at various concentrations of ethanol, dried, and sub jected to carbon-13 nuclear magnetic resonance (13C-NMR) spectrometry. The bifidobacteria and the test strains were co-cultivated in the same medium that contained one of the fractions. Co-cultivation lasted during 10 h under the same conditions. The acid concentrations were determined by high-performance liquid chromatography to define the synbiotic factor.
The obtained fructans were closer to commercial oligofructose in terms of the number and location of NMR peaks. However, they were between oligofructose and inulin in terms of signal intensity. The response surface analysis for bacilli showed that the minimal synbiotic factor value corresponded to the initial probiotic count of 7.69 log(CFU/mL) and the fructan fraction precipitated by 20% ethanol. The metabolites produced by the bacilli also affected their growth. The synbiotic factor response surface for the experiments with Salmonella transformed from parabolic to saddle shape as the initial test strain count increased. The minimal synbiotic factor value corresponded to the lowest precipitant concentration and the highest probiotic count.
The research established a quantitative relationship between the fractional composition of fructans and the antagonistic activity of the synbiotic composition with bifidobacteria. It also revealed how the ratio of probiotic and pathogen counts affects the antagonism. The proposed approach can be extrapolated on other prebiotics and microbial strains in vivo.
Keywords
Bifidobacteria, Bacillus cereus, Salmonella enterica, Arctium lappa L. fructans, synbiotics, antagonism, co-culture, rotatable central composite design, response surface methodologyINTRODUCTION
Intestinal microbiota affects human health and vitality. Microbial community is a powerful and multifunctional metabolic system that modulates immunity, suppresses pathogens, and produces various vitamins [1, 2]. A disturbed qualitative and quantitative microbial composition leads to various alimentary and chronic diseases. For instance, low counts of Bacteroides and Firmicutes, if accompanied by excessive proteobacteria, fusobacteria, and the mucindecomposing Ruminococcus gnavus, can trigger Crohn’s disease, ulcerative colitis, obesity, and diabetes [3].
However, some intestinal microbes inhibit pathogens and food contaminants by producing such antimicrobial substances as organic acids and bacteriocins or competing for nutrients and adhesion sites [4–7]. If it were not for them, unwanted microorganisms would cause constant harm to human health by producing various toxins or enzymes. For instance, Bacillus cereus is a common food contaminant that produces two types of toxins and causes vomiting and diarrhea intoxication [8]. B. cereus spores are resistant to heat treatment and chemical preservation [9].
Non-typhoid Salmonella is another wide-spread cause of foodborne diseases [10]. Salmonella enterica s. Typhimurium is often resistant to antibiotics and can develop biofilms, thus causing gastroenteritis, vomiting, and diarrhea [11]. Antibiotic-resistant bacteria are the most dangerous causes of intestinal infections [12]. Therefore, novel non-antibiotic ways to suppress these pathogens and food contaminants for therapy and prevention are one of the most urgent tasks of the modern medicine. Synbiotic compositions offer a potential solution to this problem because they are extremely effective in inhibiting the growth, activity, and pathogenesis of specific undesirable microorganisms.
Probiotics, prebiotics, and synbiotics are parts of functional foods that inhibit unwanted members of intestinal microbiota [13]. These food additives are known to increase α-diversity, combat obesity, improve immunity, and counteract pathogens [13–16]. Synbiotics are the most effective type because they possess synergistically enhanced beneficial properties of probiotics and prebiotics [17].
For synbiotics, the most important criteria are their inhibiting properties, adhesion to intestinal epithelial cells, and pathogen toxicity. Antagonistic research of synbiotic combinations is a promising strategy for developing new synbiotics. Ruiz et al. studied the combined antimicrobial activity of a synbiotic based on Bifidobacterium longum subsp. infantis and galactooligosaccharides against such enteric pathogens as Escherichia coli, Cronobacter sakazakii, Listeria monocytogenes, and Clostridium difficile. C. sakazakii and C. difficile proved to be the most effective pathogen inhibitors [18]. Co-cultivation of B. longum or Bifidobacterium breve with C. difficile in a medium with commercial fructooligosaccharides reduced the pathogen growth, as well as the toxicity of its metabolites [19].
Śliżewska and Chlebicz-Wójcik focused on the effect of various prebiotics co-cultivated with lactobacilli on pathogenic S. enterica of various serovars and L. monocytogenes. Inulin demonstrated the greatest antagonistic activity, although the effect depended on the test strain [20]. Obviously, the effectiveness of one and the same composition depends on the pathogen. The inhibitory effect can be measured by the inhibitory metabolites produced by probiotics. This effect can be expressed in terms of inhibition constants (Ki) or minimal inhibitory concentrations. The synbiotic factor is another quantitative criterion for evaluating the effectiveness of synbiotic compositions. It shows how many times the specific growth rate of a pathogen or microbial contaminant decreases under the action of acids produced by a probiotic when they are cocultivated in the same medium with this prebiotic [21].
Plant extracts are common sources of prebiotic substances. In addition to polysaccharides of various molecular weights, they may contain non-carbohydrate substances with a potential beneficial effect, e.g., polyphenols [22, 23]. Precipitation with different concentrations of ethanol can separate plant carbohydrates into fractions with different degrees of polymerization. Polysaccharides with a higher degree of polymerization require a lower concentration of ethanol. As the alcohol concentration increases, the average degree of polymerization of the precipitated fraction decreases [24, 25]. Polysaccharides with a high degree of polymerization are not metabolized by pathogens without extracellular hydrolases. However, they can be metabolized by many types of probiotics, e.g., bifidobacteria and some lactobacilli, which determines their significant prebiotic potential [26]. In our previous research, we evaluated the effectiveness of a synbiotic composition in vitro by the degree of its antagonism against staphylococci. It depended on the fractional composition of Arctium lappa fructans, as well as on the ratio of the initial probiotic and pathogen counts [27].
The response surface methodology was developed by Box and Wilson [28]. It is a powerful tool for establishing quantitative relationships between various factors and the response function, also by taking into account the mutual effect of factors in multiparameter equations. Shuhaimi et al. used this method to optimize the composition of a synbiotic that consisted of Bifidobacterium pseudocatenulatum and several prebiotics, while Pandey and Mishra tested this method on a soy drink with lactic acid bacteria and organophosphates [29, 30].
Few researchers venture beyond simple optimization to look for the patterns between various factors and the response function. This approach proved quite effective in studying the change patterns in microbial communities under various environmental factors [31, 32]. Antagonism is a type of relationships in microbial communities. Our research objective was to use the response surface method to evaluate the effect of fructan fractional composition, the initial counts of probiotics and the pathogen test strain on the antagonism of the synbiotic against B. cereus and S. enterica.
STUDY OBJECTS AND METHODS
Plant raw materials and obtaining fructan fractions. To isolate fructans, we used burdock root powder (Arctium lappa L.) in accordance with pharmacopeial monograph 2.5.0025.15 of the Russian Pharmacopoeia. The powder was diluted with distilled water in a ratio of 1:12 (g dry solids per 1 mL extractant) and extracted twice at 75°C and pH 6.5 for 30 min with constant stirring. The pulp was separated by vacuum filtration. To separate high-molecular impurities, the extract was ultrafiltered at 45°C through a hollow fiber module (AR-0.5-20PS, NPO Biotest, Kirishi, Russia) with a retention threshold of 20 kDa. The permeate was stirred with active clarifying carbon at a rate of 15 g/L for 30 min until the extract became colorless. The activated charcoal was separated by vacuum filtration [33].
The extract was evaporated using a rotary film evaporator (model 561-01110-00 with glass set G1, Heidolph, Germany) at 45°C until the carbohydrate concentration reached 170–200 g/L. To separate the carbohydrates into fractions with different degrees of polymerization, the extract was precipitated with varying ethanol concentrations (20.0, 32.2, 50.0, 67.8, and 80.0%) at 4°C for 4 days [24].
The precipitates were separated by centrifugation at 5000 rpm for 15 min and dried in a ScanVac Coolsafe 100-9 freeze-dryer under the following temperature and time conditions: 0°С – 8 h, 5°С – 8 h, 10°С – 6 h, 15°С – 6 h, and 20°С – 6 h. The samples were diluted 1:1 with a 10% solution of trichloroacetic acid and hydrolized for 40 min in a boiling water bath. After that, the content of fructans was determined by the modified Bertrand method.
Microbial objects and cultivation conditions. All the bacterial cultures were obtained from the National Bioresource Center of the All-Russian Collection of Industrial Microorganisms in the National Research Center of Kurchatov Institute (VKPM). Bifidobacterium bifidum (AS-1666, ATCC 29521T) served as a probiotic culture. Bacillus cereus (B-8076, ATCC 9634) was used as a model food contaminant. Salmonella enterica (B-5300) was a model intestinal pathogen. The medium described in [34] was modified to obtain inoculums and co-cultivate the probiotic and test strains.
The composition of the carbohydrate-free medium was as follows (g/L): casein trypton (Difco Laboratories) – 10; yeast extract (Springer) – 7.6; meat extract (Panreac) – 5; ascorbic acid (AppliChem) – 1; sodium acetate – 1; (NH4)2SO4, – 5; urea – 2; MgSO4·7H2O – 0.2; FeSO4·7H2O – 0.01; MnSO4·7H2O – 0.007; NaCl – 0.01; Tween-80 – 1, and L-cysteine – 0.5 (pH 7.0). All the components were dissolved in 80% of the required amount of distilled water and autoclaved at 115°C for 30 min. The fructan precipitates were dissolved in distilled water (20% of the required medium volume) and sterilized separately under the same conditions. Prior to inoculation, carbohydrates were added to the medium aseptically until their concentration was 8 g/L.
Inoculums were cultivated at 37°C and stirred at 180 rpm under anaerobic conditions (2% CO2, 98% N2) in a CB-210 CO2 incubator (Binder, Germany) for 12 h without maintaining a constant pH. After that, the inoculums were centrifuged at 6000 rpm and 4°C for 2 min and washed twice in sterile saline (9 g/L NaCl). Then the precipitate was resuspended in a carbohydratefree medium to obtain suspensions with an optical density depending on the bacterial count. To achieve the selected initial count of the probiotic and the test strain, 0.5 mL of the obtained solution was added to the media with pre-added fructans. To determine the synbiotic factor, co-cultivation lasted during 10 h under the same conditions. Sampling took place at the beginning and end of fermentation.
Microbial count. Microbial count was conducted in triplicate by seeding tenfold dilutions in Petri dishes with the media. Colonies of B. cereus and S. enterica were counted after 24 h of aerobic growth at 37°C in MRS medium [35]. B. bifidum colonies were counted after 48 h of growth in BFM medium with the following composition (g/L): peptone – 10, NaCl – 5.0, lactulose – 5.0, L-cysteine – 0.5, riboflavin – 0.01, yeast extract – 7, meat extract – 5, starch – 2, thiamine chloride – 0.01, and lithium citrate – 3.3 [36]. The pH was adjusted to 5.5 by adding propionic acid (5 mL/L). The dishes were incubated under anaerobic conditions at 37°C using a BD GasPak™ Anaerobic Container System.
Determining the content of organic acids. The concentration of organic lactic and acetic acids was determined by high-performance liquid chromatography (HPLC) according to a slightly modified standard procedure by the refractometric signal [37]. The experiment involved an Agilent 1220 Infinity chromatograph (Santa Clara, CA, USA) with an Agilent Hi- Plex H column (250×4.6 mm). The supernatant was centrifuged at 12 000 rpm for 15 min, then filtered through 0.45-μm cellulose acetate membranes (HAWP, MF-Millipore, St. Louis, MO, USA). Other parameters included: sample volume – 3 μL, temperature – 50°C, mobile phase flow rate (0.002 M H2SO4) – 0.3 mL/min. To prepare calibration solutions, the concentrated organic acids were diluted in their mobile phase to concentrations of 1, 5, and 10 g/L.
Determining the structure of fructans. The structure of the isolated fructans was analyzed using carbon-13 nuclear magnetic resonance (13C-NMR) spectrometry following the procedure described by Mariano et al. [38]. One-dimensional spectra were obtained at 298 K on a BRUKER CXP-200 NMR spectrometer (50.3 MHz) (Bruker, Germany) in an aqueous solution of D2O. Inulin (Orafti ® HSI, BENEOORAFTI, Belgium) and oligofructose (Orafti ® P95, BENEO-ORAFTI, Belgium) served as standard.
Calculating the synbiotic factor. The synbiotic factor was calculated in accordance with the previously approach proposed by Karetkin et al. and Evdokimiova et al. [21, 27]. The microbial count, pH, and the concentration of organic acids were determined at the initial and final stages of co-cultivation. Based on the data obtained, the synbiotic factor was calculated as follows:
![]()
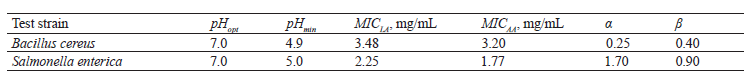
where SF is the synbiotic factor; pHopt is pH optimal for test strain growth; pHmin is pH the minimal for test strain growth; [LA] is the concentration of undissociated lactic acid, (mg/mL); [AA] is the concentration of undissociated acetic acid, mg/mL; MICLA is the minimal inhibiting concentration of lactic acid, mg/mL; MICAA is the minimal inhibiting concentration of acetic acid, mg/mL; α and β are constants for B. cereus or S. enterica, which we defined in [39] (Table 1).
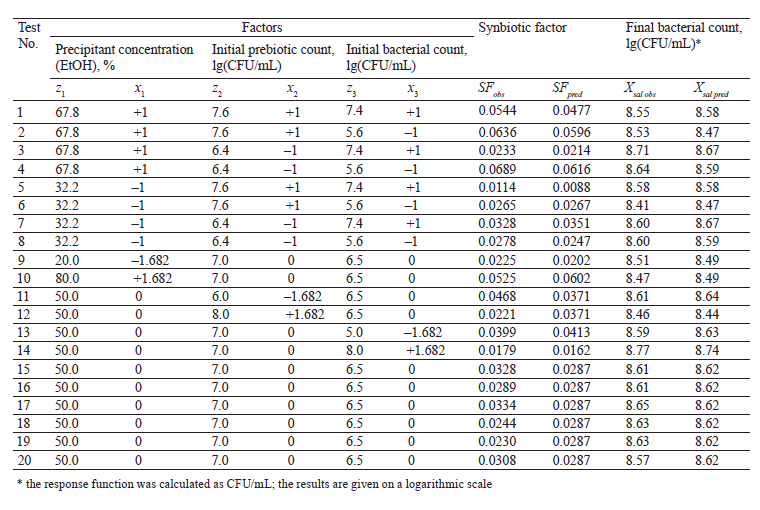
Design of experiment and statistical analysis. The central composition rotatable design was applied to study the effect of the following parameters on the co-cultivation: the precipitant concentration x1, the fractional composition of A. lappa fructans, the initial count (decimal logarithm) of bifidobacteria (x2), and test strain cells (x3). Synbiotic factor (Y1) and final test strain count (Y2) were chosen as response functions. The variation levels were determined based on data obtained from [21, 27] (Tables 3 and 4). The response function was presented as follows:
![]()
The significance test of the coefficients for Eq. (2) was based on the t-test. The adequacy of the equation was assessed by the Fisher criterion at P = 0.05. Response surfaces were calculated and constructed using the MathLab software. The scanning method with a variable step as in [40] was applied to determine the extreme values of the factors. The method consists in a sequential search for points in the parametric space using the GeoGebra Classic software 6.0.694.0 (University of Salzburg, Salzburg, Salzburg state, Austria).
RESULTS AND DISCUSSION
13C-NMR specters of Arctium lappa L. root fructan fractions. Figure 1 illustrates 13C-NMR specters of standard inulin and oligofructose, purified from A. lappa L. fructan fractions and precipitated by different concentrations of ethanol.

The analysis was based on the difference between the chemical shifts of the carbon atoms of the monomers located inside the chain of oligo- and polysaccharides and the atoms of the terminal monomers [24]. The chemical shifts of carbon atoms in the standard and test samples are typical of inulin-type fructans (Table 2).
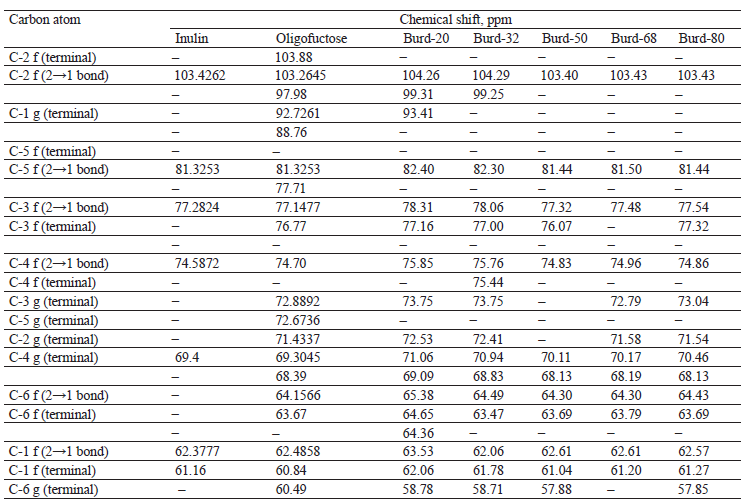
The obtained spectra of fructan fractions were closer to those of commercial oligofructose in terms of the number and location of peaks. In terms of signal intensity, they were between standard oligofructose and highly purified inulin. None of the test samples demonstrated peaks at the terminal C-2 atom of D-fructofuranose. However, the test samples showed an increase in the relative areas of the peaks, as well as an increase in the precipitant concentration for all carbon atoms of the D-fructofuranose residues within the chain (forming a 2→1 bond).
All the peak areas for the corresponding carbon atoms were smaller than for inulin, and the values obtained for Burd-50 and Burd-68 were closest to oligofructose. The differences in the relative proportions of peak areas for Burd-20 and Burd-32 were small and manifested as unidentified peaks in the Burd-20. Probably, carbohydrates of similar molecular weight were precipitated at these ethanol concentrations. No correlation was observed between the relative proportions of the peak areas for the terminal atoms of glucopyranose and fructofuranose.
Synbiotic antagonism to Bacillus cereus and response surface analysis. To assess the effect of various factors on the anti-B. cereus activity of the synbiotic composition, the experiment was carried out according to a central composition rotatable design. The limiting values of ethanol concentration were chosen as 20 and 80% as in [27]. The average polymerization degree of the precipitated carbohydrate fraction was at its highest at 20% of ethanol.
Zeaiter et al. used 33% ethanol to obtain a fraction of inulin-type artichoke fructans with an average degree of 32–42 [26]. Table 3 demonstrates the planning matrix, as well as the experimental and calculated values of response functions, i.e., the synbiotic factor and the final test strain cell count.
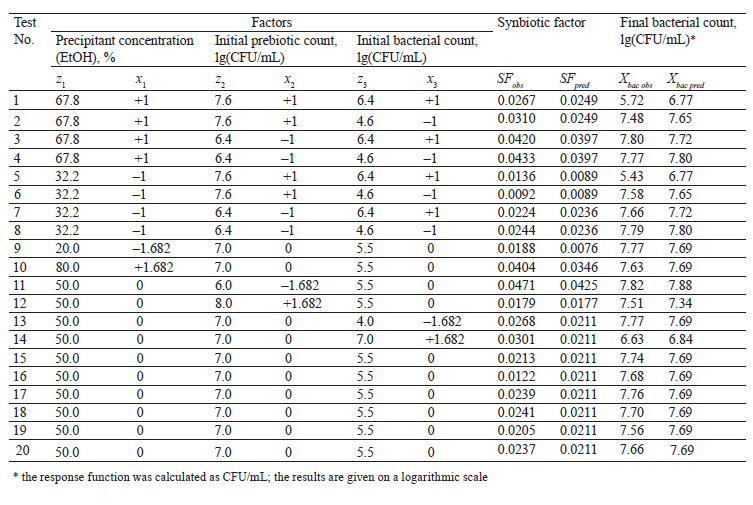
The coefficients of the response function equation were determined from the values of the synbiotic factor and the final bacterial count. The response surface was constructed according to Eq. (2) (Fig. 2). The adequacy of the equations was confirmed by Fisher’s criterion F = 1.681 and 1.66: it was below the tabulated F = 4.704 at P = 0.05.

![]()
![]()
The synbiotic factor reduced of the specific growth rate of the test strain. It showed how many times the specific growth rate decreased relative to the optimal value under the effect of inhibitors produced by the probiotic and the prebiotic. The maximal inhibition corresponded to the lowest value of the synbiotic factor [21]. The synbiotic factor of the composition of Bifidobacterium bifidum and A. lappa root fructans had a positive linear dependence on the precipitant concentration (x1). Therefore, the composition with fructans precipitated by the lowest alcohol concentration had the greatest inhibitory effect on B. cereus because it had the highest average degree of polymerization. This result confirms the data obtained by us before [27]. The dependence of the synbiotic factor on the initial probiotic count (x2) was parabolic and reached its minimum at +1.156, which corresponded to 7.69 lg(CFU/mL). As x2 rose (> +1.156), the synbiotic factor also increased.
All experimental values appeared to be much higher than those obtained by calculation, both at the minimal point and at high values of x2. Apparently, the observed decrease in the antagonistic activity could be ignored. All the coefficients at x3 proved insignificant, and the initial test strain count did not affect the synbiotic factor. Within the range of the variables, the minimal value of the synbiotic factor (maximal suppression of the test strain) was 0.0033 and lied at the point with coordinates –1.682 and 1.156, which corresponded to the initial probiotic count of 7.69 lg(CFU/ml) and the A. lappa fructan fraction precipitated with 20% ethanol.
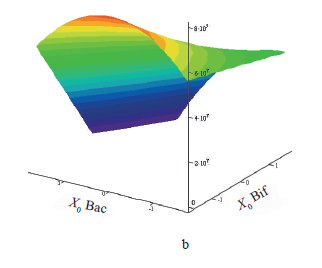
As the initial bifidobacterial count (x2) increased, the final bacterial count decreased (Fig. 2b). The dependence of the final test strain count (Y2) on the initial one (x3) was parabolic. The maximal value of the response function was reached when the bifidobacterial count was minimal, i.e., 6.0 lg(CFU/mL), and the initial test strain count in the design center was 5.5 lg(CFU/mL). At these values, the inhibition was least effective. The minimal final test strain count was around the highest seed doses of both the probiotic and the test strain. As the initial probiotic and test strain concentrations increased, the final bacterial count plummeted. Probably, bacilli inhibited their own growth by their own metabolites, i.e., lactic acid.
Antagonism of synbiotic compositions against Salmonella enterica and response surface analysis. Table 4 shows the design matrix with experimental and calculated values of the response functions for S. enterica. The variation range of variables in natural coordinates did not differ from that of bacilli, except for the shift in the initial test strain count by +1 lg(CFU/mL).
The response surface analysis for synbiotic factor (Y1) was represented as the following equation confirmed by Fisher’s criterion (F = 3.99 < 4.87, P = 0.05):
![]()
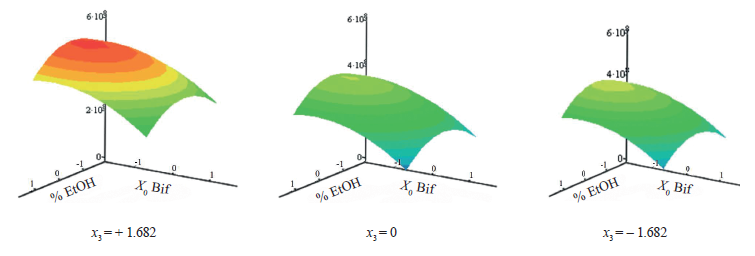
The coefficients for all factors and their pairwise interactions turned out to be significant. The response surfaces were calculated for fixed (Fig. 3). For all the surfaces obtained, the smallest value of the response function within the variation range was obtained when the precipitant concentration was minimal. When was below 0.46, which corresponded to the initial Salmonella count (6.91 lg(CFU/mL)), the respon surface was parabolic, and its analytical minimum was outside the variation range. These surfaces demonstrated an increase in the initial bifidobacterial count, which followed the increase in the initial Salmonella count.

The larger bifidobacterial count resulted in the greatest suppression, which varied from x3 = – 1.682 to x3 = 0. Thus, the response surface method made it possible to define the critical value of the Salmonella count (6.5 lg(CFU/mL)). When this value was exceeded, only the maximal count of viable bifidobacterial cells could inhibit the pathogen. If the initial pathogen count exceeded 6.91 lg(CFU/mL), the response surfaces had a saddle shape.
The global minimum of the response function within the variation range was determined by the variable step scanning method. Initially, all variables for each coordinate had an interval with two equal subintervals. The values of the function were calculated at the nodes of the resulting grid to select the optimal point with the lowest synbiotic factor. Subsequently, the interval was cut in two. The calculation cycles continued until the interval along one of the coordinates fell below 0.001. The minimum was determined at the border of the region in coordinates –1.682, +1.682, and +1.682. Therefore, the greatest antagonistic effect was expected at the lowest alcohol concentration of 20% and the highest initial bifidobacterial count of 8.0 lg(CFU/mL). Unlike the bacilli, the metabolism of the test strain affected the synbiotic factor and reduced its value. Probably, the reduction happened because of extra acid production.
The final Salmonella count equation (F = 2.20 < 4.74, Р = 0.05) looked as follows:
![]()
As for the synbiotic factor, all factors had a significant impact on target function Y2. The response surfaces were calculated for fixed x3 values (Fig. 4). The surface was parabolic in coordinates x1 and x2. The maximal value of the final test strain count was 8.68 lg(CFU/mL) in coordinates 0, –1.101, and +1.685. Thus, the synbiotic composition of fructans precipitated by 50% ethanol and bifidobacteria with the initial count of 6.34 lg(CFU/mL) had the lowest antagonistic effect against Salmonella. As the initial Salmonella count increased, the efficiency weakened.
The effect of the initial test strain count on the response function was not symmetrical to the design center because the minimum of the function for this variable was at the point – 0.749, 5.83 lg(CFU/mL). The dependence had a quadratic nature. As a result, the final Salmonella count remained almost the same when the initial count was below 6.5 lg(CFU/mL). When the values were large, the value of the response function rose sharply. Therefore, the initial Salmonella count of 6.5 lg(CFU/mL) was critical from the standpoint of microbiology.
The response paraboloid was symmetrical to the design center of variable. Thus, both fructan fractions precipitated by the highest and the lowest alcohol concentrations possessed the same inhibition effects. However, as the initial probiotic count exceeded 6.34 lg(CFU/mL), the inhibition of the pathogen increased. The lowest values of the final S. enterica count (and the greatest antagonistic effect) within the variation range were achieved at the maximal initial bifidobacterial count of 8.0 lg(CFU/mL) in the medium with A. lappa root fructan fractions precipitated with 20 or 80% ethanol.
Previously, we considered Staphylococcus aureus as the test strain and also found out that the effect of A. lappa fructans precipitated with 40 and 60% ethanol was weaker than those precipitated with 20 or 80% ethanol [27]. Apparently, the highest average degree of polymerization was effective because the carbohydrate substrate was less available. The lowest degree of polymerization was effective because the bifidobacteria consumed the substrate faster and thus produced more metabolites. This issue, however, requires further research.
In this study, we considered lactic and acetic acids as inhibitors. As proved by Prosekov et al., many bifidobacteria can produce antimicrobial peptides (bacteriocins), and some representatives of B. bifidum are among them [41]. However, their synthesis usually becomes active at the stationary phase, and by that time the bifidobacterial count in the co-culture of bacilli and Salmonella stop growing. Therefore, the synbiotic factor calculations did not take into account the effect of bacteriocins. Further research is required to study these inhibitors under conditions close to real, e.g., intestinal simulators with a continuous slow medium flow.
The approach proposed in this paper can also be applied to non-plant prebiotics. Lactulose is one of the best prebiotics [42]. It is often combined with other prebiotics, such as fructooligosaccharides, to make up functional foods. Scientists also turn to oligosaccharides of goat’s milk, which are a mix of triand tetrasaccharides that consist of glucose, fructose, galactose, and their acylated derivatives [43]. Obviously, the qualitative and quantitative composition affects the action of the prebiotic both separately and as part of a synbiotic composition. Our approach can be applied to similar studies in vitro.
CONCLUSION
In this research, the highest synbiotic efficiency belonged to the fraction of fructans with a higher degree of polymerization precipitated by the lowest ethanol concentration and the highest bifidobacterial count. The study established a quantitative relationship between the bifidobacteria and the parameters of fructan production and the antagonistic activity of their synbiotic composition. We also determined the effect of the ratio of probiotic and pathogen counts on antagonism. The proposed approach can substantiate the composition of new synbiotics. In the future, we plan to study other compositions of probiotics and prebiotics in vivo to find their optimal ratio.Contribution
S. Evdokimova and B. Karetkin developed the research concept. E. Guseva and I. Shakir were responsible for data curation and formal analysis. B. Karetkin acquired the funding. S. Evdokimova and N. Khabibulina performed the experiments. B. Karetkin and E. Guseva developed the methodology. B. Karetkin supervised the project. E. Guseva and M. Zhurikov worked with the Software. I. Shakir validated the obtained data. S. Evdokimova and M. Zhurikov developed the infographics. S. Evdokimova wrote the original draft. B. Karetkin and V. Panfilov edited the manuscript. All the authors discussed the results and contributed to the final manuscript. All the authors have read and agreed to the published version of the manuscript.CONFLICTS OF INTEREST
The authors declare that there is no conflict of interests regarding the publication of this article.ACKNOWLEDGEMENTS
NMR spectrometry was performed on the equipment of the Mendeleev Center for Collective Use. The authors would like to express their gratitude to Andrey B. Polyakov.FUNDING
The research was sponsored by the Russian Science Foundation (RSF) (Project 17-79-20365).REFERENCES
- Heintz-Buschart A, Wilmes P. Human gut microbiome: Function matters. Trends in Microbiology. 2018;26(7):563–574. https://doi.org/10.1016/j.tim.2017.11.002
- Martín MÁ, Ramos S. Impact of dietary flavanols on microbiota, immunity and inflammation in metabolic diseases. Nutrients. 2021;13(3). https://doi.org/10.3390/nu13030850
- von Martels JZH, Sadaghian Sadabad M, Bourgonje AR, Blokzijl T, Dijkstra G, Faber KN, et al. The role of gut microbiota in health and disease: In vitro modeling of host-microbe interactions at the aerobe-anaerobe interphase of the human gut. Anaerobe. 2017;44:3–12. https://doi.org/10.1016/j.anaerobe.2017.01.001
- Kamada N, Kim Y-G, Sham HP, Vallance BA, Puente JL, Martens EC, et al. Regulated virulence controls the ability of a pathogen to compete with the gut microbiota. Science. 2012;336(6086):1325–1329. https://doi.org/10.1126/science.1222195
- Rolhion N, Chassaing B. When pathogenic bacteria meet the intestinal microbiota. Philosophical Transactions of the Royal Society B: Biological Sciences. 2016;371(1707). https://doi.org/10.1098/rstb.2015.0504
- Peluzio MCG, Martinez JA, Milagro FI. Postbiotics: Metabolites and mechanisms involved in microbiota-host interactions. Trends in Food Science and Technology. 2020;108:11–26. https://doi.org/10.1016/j.tifs.2020.12.004
- Markowiak-Kopeć P, Śliżewska K. The effect of probiotics on the production of short-chain fatty acids by human intestinal microbiome. Nutrients. 2020;12(4). https://doi.org/10.3390/nu12041107
- Ramarao N, Tran S-L, Marin M, Vidic J. Advanced methods for detection of Bacillus cereus and its pathogenic factors. Sensors. 2020;20(9). https://doi.org/10.3390/s20092667
- Jessberger N, Dietrich R, Granum PE, Märtlbauer E. The Bacillus cereus food infection as multifactorial process. Toxins. 2020;12(11). https://doi.org/10.3390/toxins12110701
- Eastwood LC, Taylor TM, Savell JW, Gehring KB, Arnold AN. Efficacy of antimicrobial interventions in reducing Salmonella enterica, Shiga toxin-producing Escherichia coli, Campylobacter, and Escherichia coli biotype I surrogates on non-chilled and chilled, skin-on and skinless pork. Meat Science. 2021;172. https://doi.org/10.1016/j.meatsci.2020.108309
- Castro VS, Mutz YS, Rosario DKA, Cunha-Neto A, Figueiredo EES, Conte-Junior CA. Inactivation of multi-drug resistant non-typhoidal Salmonella and wild-type Escherichia coli STEC using organic acids: A potential alternative to the food industry. Pathogens. 2020;9(10). https://doi.org/10.3390/pathogens9100849
- Beloborodova NV. Integration of metabolism in man and his microbiome in critical conditions. General Reanimatology. 2012;8(4):42–54. (In Russ.). https://doi.org/10.15360/1813-9779-2012-4-42
- Green M, Arora K, Prakash S. Microbial medicine: Prebiotic and probiotic functional foods to target obesity and metabolic syndrome. International Journal of Molecular Sciences. 2020;21(8). https://doi.org/10.3390/ijms21082890
- Medina-Vera I, Sanchez-Tapia M, Noriega-López L, Granados-Portillo O, Guevara-Cruz M, Flores-López A, et al. A dietary intervention with functional foods reduces metabolic endotoxaemia and attenuates biochemical abnormalities by modifying faecal microbiota in people with type 2 diabetes. Diabetes and Metabolism. 2019;45(2):122–131. https://doi.org/10.1016/j.diabet.2018.09.004
- Ashaolu TJ. Immune boosting functional foods and their mechanisms: A critical evaluation of probiotics and prebiotics. Biomedicine and Pharmacotherapy. 2020;130. https://doi.org/10.1016/j.biopha.2020.110625
- Alkhatib A. Antiviral functional foods and exercise lifestyle prevention of coronavirus. Nutrients. 2020;12(9). https://doi.org/10.3390/nu12092633
- Swanson KS, Gibson GR, Hutkins R, Reimer RA, Reid G, Verbeke K, et al. The International Scientific Association for Probiotics and Prebiotics (ISAPP) consensus statement on the definition and scope of synbiotics. Nature Reviews Gastroenterology and Hepatology. 2020;17(11):687–701. https://doi.org/10.1038/s41575-020-0344-2
- Ruiz L, Flórez AB, Sánchez B, Moreno-Muñoz JA, Rodriguez-Palmero M, Jiménez J, et al. Bifidobacterium longum subsp. infantis CECT7210 (B. infantis IM-1®) displays in vitro activity against some intestinal pathogens. Nutrients. 2020;12(11). https://doi.org/10.3390/nu12113259
- Valdés-Varela L, Hernández-Barranco AM, Ruas-Madiedo P, Gueimonde M. Effect of Bifidobacterium upon Clostridium difficile growth and toxicity when co-cultured in different prebiotic substrates. Frontiers in Microbiology. 2016;7. https://doi.org/10.3389/fmicb.2016.00738
- Śliżewska K, Chlebicz-Wójcik A. The in vitro analysis of prebiotics to be used as a component of a synbiotic preparation. Nutrients. 2020;12(5). https://doi.org/10.3390/nu12051272
- Karetkin BA, Guseva EV, Evdokimova SA, Mishchenko AS, Khabibulina NV, Grosheva VD, et al. A quantitative model of Bacillus cereus ATCC 9634 growth inhibition by bifidobacteria for synbiotic effect evaluation. World Journal Microbiology and Biotechnology. 2019;35(6). https://doi.org/10.1007/s11274-019-2665-2
- Rashmi HB, Negi PS. Phenolic acids from vegetables: A review on processing stability and health benefits. Food Research International. 2020;136. https://doi.org/10.1016/j.foodres.2020.109298
- Babich O, Sukhikh S, Prosekov A, Asyakina L, Ivanova S. Medicinal plants to strengthen immunity during a pandemic. Pharmaceuticals. 2020;13(10). https://doi.org/10.3390/ph13100313
- Wack M, Blaschek W. Determination of the structure and degree of polymerisation of fructans from Echinacea purpurea roots. Carbohydrate Research. 2006;341(9):1147–1153. https://doi.org/10.1016/j.carres.2006.03.034
- Li J, Du J. Molecular characterization of arabinoxylan from wheat beer, beer foam and defoamed beer. Molecules. 2019;24(7). https://doi.org/10.3390/molecules24071230
- Zeaiter Z, Regonesi ME, Cavini S, Labra M, Sello G, Di Gennaro P. Extraction and characterization of inulin-type fructans from artichoke wastes and their effect on the growth of intestinal bacteria associated with health. BioMed Research International. 2019;2019. https://doi.org/10.1155/2019/1083952
- Evdokimova SA, Nokhaeva VS, Karetkin BA, Guseva EV, Khabibulina NV, Kornienko MA, et al. A study on the synbiotic composition of Bifidobacterium bifidum and fructans from Arctium lappa roots and Helianthus tuberosus tubers against Staphylococcus aureus. Microorganisms. 2021;9(5). https://doi.org/10.3390/microorganisms9050930
- Box GEP, Wilson KB. On the experimental attainment of optimum conditions. Journal of the Royal Statistical Society. 1951;13(1):1–45.
- Shuhaimi M, Kabeir BM, Yazid AM, Nazrul Somchit M. Synbiotics growth optimization of Bifidobacterium pseudocatenulatum G4 with prebiotics using a statistical methodology. Journal of Applied Microbiology. 2009;106(1):191–198. https://doi.org/10.1111/j.1365-2672.2008.03991.x
- Mishra Pandey S, Mishra HN. Optimization of the prebiotic & probiotic concentration and incubation temperature for the preparation of synbiotic soy yoghurt using response surface methodology. LWT. 2015;62(1):458–467. https://doi.org/10.1016/j.lwt.2014.12.003
- Wang C, Wang Z, Wang P, Zhang S. Multiple effects of environmental factors on algal growth and nutrient thresholds for harmful algal blooms: Application of response surface methodology. Environmental Modeling and Assessment. 2016;21(2):247–259. https://doi.org/10.1007/s10666-015-9481-3
- Shi Y, Fang H, Li Y-Y, Wu H, Liu R, Niu Q. Single and simultaneous effects of naphthalene and salinity on anaerobic digestion: Response surface methodology, microbial community analysis and potential functions prediction. Environmental Pollution. 2021;291. https://doi.org/10.1016/j.envpol.2021.118188
- Karetkin BA, Panfilov VI, Baurin DV, Shakir IV. Ultrasonic extraction of fructans from the tubers of jerusalem artichoke: Optimization of conditions, purification methods, C-13 NMR spectroscopy of the product. International Multidisciplinary Scientific GeoConference Surveying Geology and Mining Ecology Management. 2015;1(6):641–648.
- Rossi M, Corradini C, Amaretti A, Nicolini M, Pompei A, Zanoni S, et al. Fermentation of fructooligosaccharides and inulin by bifidobacteria: A comparative study of pure and fecal cultures. Applied and Environmental Microbiology. 2005;71(10):6150–6158. https://doi.org/10.1128/AEM.71.10.6150-6158.2005
- De Man JC, Rogosa M, Sharpe ME. A medium for the cultivation of Lactobacilli. Journal of Applied Bacteriology. 1960;23(1):130–135. https://doi.org/10.1111/j.1365-2672.1960.tb00188.x
- Nebra Y, Blanch A. A new selective medium for Bifidobacterium spp. Applied and Environmental Microbiology. 1999;65(11):5173–5176. https://doi.org/10.1128/AEM.65.11.5173-5176.1999
- Scherer R, Rybka ACP, Ballus CA, Meinhart AD, Filho JT, Godoy HT. Validation of a HPLC method for simultaneous determination of main organic acids in fruits and juices. Food Chemistry. 2012;135(1):150–154. https://doi.org/10.1016/j.foodchem.2012.03.111
- Mariano TB, Higashi B, Sanches Lopes SM, Pedroza Carneiro JW, de Almeida RTR, Pilau EJ, et al. Prebiotic fructooligosaccharides obtained from escarole (Cichorium endivia L.) roots. Bioactive Carbohydrates and Dietary Fibre. 2020;24. https://doi.org/10.1016/j.bcdf.2020.100233
- Evdokimova S, Karetkin B, Nokhaeva V, Guseva E, Shakir I. Minimum inhibitory concentrations of organic acids against foodborne opportunistic microbial pathogens. SGEM International Multidisciplinary Scientific GeoConference. 2021;21(92):193–200. https://doi.org/10.5593/sgem2021/6.1/s25.25
- Pachkin SG, Kotlyarov RV. Implementation of the methods of identification of static control objects. Science Evolution. 2017;2(2):72–78. https://doi.org/10.21603/2500-1418-2017-2-2-72-78
- Prosekov AYu, Dyshlyuk LS, Milentieva IS, Sykhikh SA, Babich OO, Ivanova SA, et al. Antioxidant and antimicrobial activity of bacteriocin-producing strains of lactic acid bacteria isolated from the human gastrointestinal tract. Progress in Nutrition. 2017;19(1):67–80.
- Khramtsov AG. New technological paradigm of the Russian dairy industry: formation principles under globalisation. Foods and Raw Materials. 2019;7(2):291–300. https://doi.org/10.21603/2308-4057-2019-2-291-300
- van Leeuwen SS, Te Poele EM, Chatziioannou AC, Benjamins E, Haandrikman A, Dijkhuizen L. Goat milk oligosaccharides: Their diversity, quantity, and functional properties in comparison to human milk oligosaccharides. Journal of Agricultural and Food Chemistry. 2020;68(47):13469–13485. https://doi.org/10.1021/acs.jafc.0c03766
