

Abstract
Wet chemistry methods are traditionally used to evaluate the quality of a coffee beverage and its chemical characteristics. These old methods need to be replaced with more rapid, objective, and simple analytical methods for routine analysis. Near-infrared spectroscopy is an increasingly popular technique for nondestructive quality evaluation called a green technology.Our study aimed to apply near-infrared spectroscopy to evaluate the quality of coffee samples of different origin (Brazil, Guatemala, Peru, and Kongo). Particularly, we analyzed the roasting time and its effect on the quality of coffee. The colorimetric method determined a relation between the coffee color and the time of roasting. Partial least squares regression analysis assessed a possibility of predicting the roasting conditions from the near-infrared spectra.
The regression results confirmed the possibility of applying near-infrared spectra to estimate the roasting conditions. The correlation between the spectra and the roasting time had R2 values of 0.96 and 0.95 for calibration and validation, respectively. The root mean square errors of prediction were low – 0.92 and 1.05 for calibration and validation, respectively. We also found a linear relation between the spectra and the roasting power. The quality of the models differed depending on the coffee origin and sub-region. All the coffee samples showed a good correlation between the spectra and the brightness (L* parameter), with R2 values of 0.96 and 0.95 for the calibration and validation curves, respectively.
According to the results, near-infrared spectroscopy can be used together with the chemometric analysis as a green technology to assess the quality of coffee.
Keywords
Spectroscopy, near-infrared spectroscopy, coffee, roasting, partial least squares analysisINTRODUCTION
Near-infrared spectroscopy (NIRS) is an increasingly popular technique used for non-destructive quality evaluation in a variety of industries, including the food, agricultural, pharmaceutical, and wood industries [1–3]. It ensures rapid and easy measurements without the need for multiple chemical reagents. Recent NIRS methods include online measurement, portable measurement, and imaging analysis [4–6]. NIRS is continuously expanding its uses in food analysis and becoming an important tool for food quality control.
The quality of coffee as a beverage is determined by multiple factors such as the production system, geographical origin, chemical composition of roasted beans, and final beverage characteristics. Raw coffee beans contain a wide range of chemical compounds which interact amongst themselves at all stages of coffee roasting, resulting in greatly diverse final products [7–9]. For instance, the caffeine content, which has a significant effect on the final quality of coffee products, needs to be determined fast and reliably by analytical techniques.
Wet chemistry methods are traditionally used to evaluate coffee quality and chemical characteristics, but these methods are destructive and time-consuming. Therefore, it is in scientific interests to find rapid, more objective, and simpler analytical methods for routine coffee analysis to replace the old methods.
Recent research has shown that spectroscopy in nearinfrared (NIR) and mid-infrared (MIR) radiation is useful in coffee analysis [10–20]. Infrared spectroscopy (especially NIRS) coupled with chemometrics has been proposed as an analytical method to determine the degree of coffee roasting, adulterants in ground coffee, and sensory attributes [17, 18, 21]. It is also used to distinguish between robusta and arabica varieties, discriminate coffee based on origin, and predict its chemical composition [15, 20, 22–24].
The growing global demand for specialty coffee increases the need for improved coffee quality assessment. For this reason, Tolessa et al. proposed NIR spectroscopy to predict specialty coffee quality [13]. They examined the NIR spectra of 86 green Arabica bean samples of various quality. To create a model that correlates spectral data to cupping score data, they applied the partial least squares (PLS) regression method. The high correlation coefficient between the measured and predicted cupping scores (R2-values of 90, 90,78, 72 and 72) indicate that NIR spectroscopy coupled with chemometric analysis could be a promising tool for fast and accurate prediction of coffee quality and for classifying green coffee beans into different specialty grades.
The sensory analysis of espresso coffee with the attenuated total reflectance-Fourier transform infrared spectroscopy (ATR-FTIR) was proposed by Belchior et al. [10]. The authors evaluated the potential of ATR-FTIR and chemometrics in discriminating espresso coffees with different sensory characteristics reported by a panel of coffee tasters. They performed partial least-squares discriminant analysis (PLS-DA) based on spectroscopic data to classify the coffee samples according to their sensory qualities, demonstrating the potential of FTIR and chemometric analysis in assessing coffee quality.
In another study, Magalhaes et al. proposed FT-NIR spectroscopy and PLS regression as a non-destructive and rapid tool to assess the content of three main phenolics (caffeic acid, (+)-catechin, and chlorogenic acid) and methylxanthines (caffeine, theobromine, and theophylline) in spent coffee grounds [11]. The best PLS model was obtained for caffeine content (0.95) followed by caffeic acid (0.92), (+)-catechin (0.88), theophylline (0.84), and chlorogenic acid (0.71), indicating FT-NIR spectroscopy as a suitable technique to screen spent coffee grounds.
Mees et al. identified coffee leaves using FT-NIR spectroscopy and soft independent modelling by class analogy (SIMCA) [12]. In particular, they investigated nine taxa of Coffea leaves harvested over nine years in a tropical greenhouse of the Meise Botanic Garden (Belgium). The FT-NIR coupled with SIMCA allowed the authors to discriminate the spectral profile by taxon, aging stage, and harvest period with a correct classification rate of 90, 100, and 90%, respectively. NIRS, PLS, and variable selection were used by Ribeiro et al. to predict concentrations of a wide range of compounds in raw coffee beans [15]. The authors proposed NIR spectroscopy coupled with chemometrics as a low-cost, rapid, and eco-friendly method in both off-line and on-line analyses of coffee beans and coffee beverages. The obtained values of root mean square error of prediction (RMSEP) (0.08, 0.07 and 0.27) and rcv (0.98, 0.96, and 0.96) showed linear relations of PLS models for quantifying caffeine, trigonelline, and 5-caffeoylquinic acid, respectively.
Near-infrared spectroscopy was used by Macedo et al. to evaluate the chemical properties of intact green coffee beans based on PLS regression models [25]. The highest determination coefficients obtained for the samples in the validation set were 0.810, 0.516, 0.694, and 0.781 for moisture, soluble solids, total sugar, and reducing sugars, respectively. These results indicate that the NIR technology can be applied routinely to predict the chemical properties of green coffee.
In another study, Baqueta et al. investigated the use of NIR spectroscopy in conjunction with the PLS approach to identify the sensory properties of coffee [21]. The coffee samples varied in species, production region, variety, drying conditions, transit, postharvest procedure, storage times, coffee blend, coffee composition, and roasting process. The performance of PLS models was verified with the following merit parameters: sensitivity, accuracy, linearity, residual prediction deviation, fit, quantification, and detection limits. Since all the sensory qualities were predicted with acceptable values compatible with the merit criteria, the created models were suitable for quantifying, detecting, differentiating, and predicting the sensory features of coffee samples.
Kyaw et al. reported encouraging findings about utilizing NIR spectroscopy to forecast the moisture content of ground unroasted coffee beans [26]. The spectral data processed with second derivative and Kubelka-Munk (K/S) data yielded good accuracy for moisture prediction (r = 0.87 and accuracy = 99%).
In view of the above, we aimed to develop a simple, rapid, and accurate method for evaluating the quality of coffee samples by NIR spectroscopy, especially to investigate changes in the coffee spectra during roasting.
STUDY OBJECTS AND METHODS
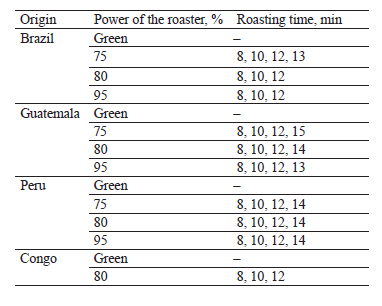
Samples. Our study objects were arabica coffee samples roasted by the Cafe Creator in Poznań, Poland. The coffee samples were divided into four groups based on their origin, namely Brazil, Guatemala, Peru, and Congo. Their roasting parameters included the roaster power and roasting time (Table 1).
Color measurements. The color of 41 samples of coffee beans was measured by the L* a* b* method using a Konica Minolta Chroma Meter CR-310 trichromatic colorimeter. Each sample was measured 10 times. Before the measurements, the device was calibrated against a white standard with the following parameters: Y = 93.00, x = 0.3170, y = 0.3330. The entire analysis was carried out using a D65 light source, i.e. the daylight phase and the CIE L* a* b* color system.
Near-infrared (NIR) measurements. NIR spectra were performed on a MPA/FT-NIR spectrometer (Bruker). Single beam spectra of the coffee samples were collected and rationed against the background of air. For each sample, the NIR spectra were recorded from 12500 to 400 cm–1 by co-adding 16 interferograms at a resolution of 4 cm–1. Each sample was measured five times. The coffee was ground in an electric grinder for measurements. Between the measurements, the samples were mixed in order to obtain reliable results. The measurements were registered in the OPUS software (Bruker, USA).
Partial Least Squares (PLS) regression. The PLS regression method was used to determine relations between the spectra and the roasting time. Independent variables (X) were the NIR spectra and dependent variables (Y) were the color parameter or the roasting time. Full cross-validation was applied to the regression model. The regression models were evaluated using the adjusted R2 and the root mean-square error of crossvalidation. The quality models were evaluated by the ratio of the standard deviation of reference data to the root mean-square error of prediction, or the ratio of performance to deviation. The PLS analysis was carried out using the Unscrambler X software (CAMO, Oslo, Norway).
RESULTS AND DISCUSSION
Color measurements. Table 2 shows the color measurements of coffee beans in the L*, a*, b* system. The L* parameter is responsible for the brightness of color in the tristimulus model. The higher it is, the greater the brightness of the tested sample. Among the coffees under study, the green coffee beans from Peru had the highest L* value, i.e., the highest brightness. The Congo coffee, which was roasted at the power of 80% for 12 min, had the lowest L* parameter, i.e., the lowest brightness. All the samples had positive a* and b* values, with their shades varying between red and yellow.
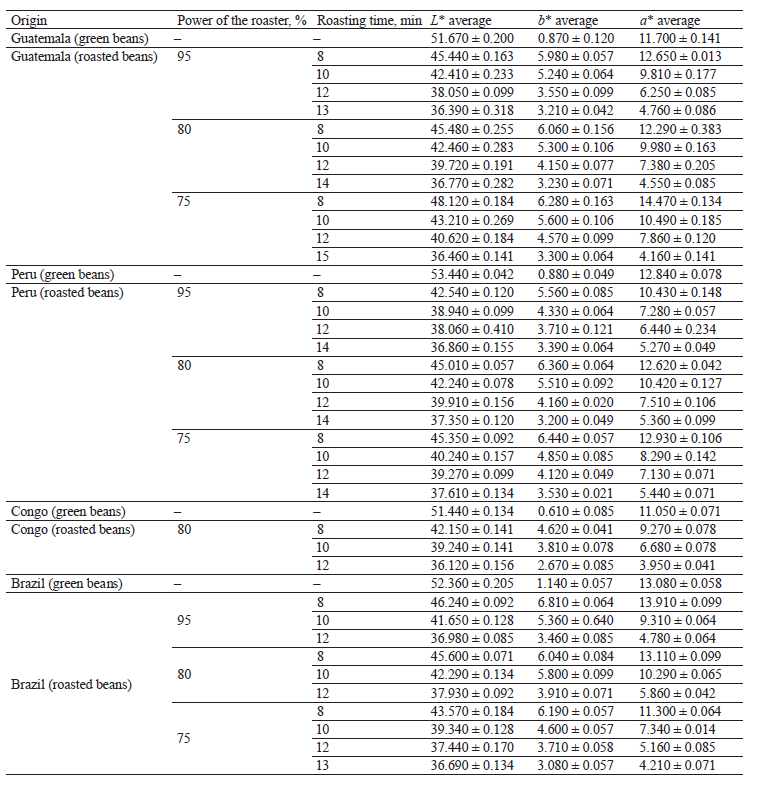
As we can see in Table 2, the green coffee beans showed the greatest brightness, followed by the samples roasted for 8 min. With the increasing degree of roasting, the color of coffee beans became darker, which is consistent with literature [27, 28].
Spectral characteristics of coffee samples. Figure 1 shows the absorption spectra of the coffees from Brazil, Congo, Guatemala, and Peru roasted for 12 min (80% roasting power).
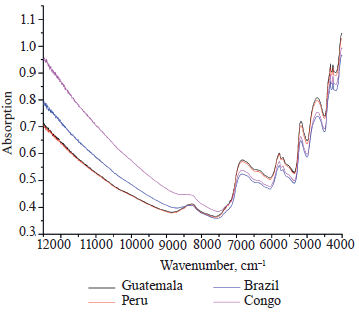
The spectral range was recorded throughout the region of 12 500–4000 cm–1. The most intense absorption bands were recorded in the range of 8230–4440 cm–1. The spectra were characterized by seven bands with maximum absorption at 8238, 6819, 5800, 5700, 5100, 4700, and 4440 cm–1. These bands corresponded to the C-H, N-H, and O-H vibrations [29]. The spectral range of 4545–4000 cm–1 corresponded to the C-H stretching vibrations. The bands in the region of 5000–4545 cm–1 were assigned to the combination of the N-H and O-H stretching vibrations. The range of 6060–5555 cm–1 corresponded to the first tone of the C-H stretching vibration. In the 7142–6666 cm–1 region, it was associated with the first shade of the N-H and O-H stretching vibrations, while the absorption band in the 7692–7142 cm–1 range was derived from the C-H stretching vibrations. The band in the region of 9090– 8163 cm–1 originated from the second tone of the C-H stretching vibrations [30]. Specific chemical compounds can be described with the following wavenumbers: caffeine (8865, 7704, 5981, 5794, and 5171 cm–1), trigonelline (8865 cm–1), chlorogenic acid (6770, 5794, 5171, and 4699 cm–1), lipids (6770, 5794, 5171, and 4699 cm–1), hydrocarbons (6770, 5171, and 4699 cm–1), sucrose (5794, 5405, and 5171 cm–1), proteins and amino acids (5171 cm–1), and water (5171 cm–1) [9, 14, 31]. Table 3 presents the origin of the bonds occurring at the given wavenumbers for the tested coffee beans.

Coffee roasting. Many physical and chemical changes take place during coffee roasting. The method of roasting depends on the origin of coffee beans and consumer preferences. Heavily roasted coffee has a lower nutritional value than light coffee [32].
Numerous efforts have already been made to use NIR spectroscopy as an alternative technique to determine coffee quality during roasting and analyze its chemical composition. According to Ribeiro et al., NIR spectroscopy can be used to determine the relationship between the quality of a coffee cup and the chemical composition of roasted coffee beans [9]. In addition, the authors created a model from roasted beans to predict the quality attributes of a coffee cup (e.g. acidity, body, and flavor).
The relationship between some coffee roasting variables (weight loss, density, and moisture) and near-infrared spectra of original green and differently roasted coffee samples was investigated by Alessandrini et al. [14]. They developed separate calibration and validation models based on partial least square (PLS) regression, correlating NIR spectral data of 168 representatives and suitable green and roasted coffee samples with each roasting variable. As a result, the authors constructed robust and reliable models to predict roasting variables for unknown roasted coffee samples, considering that measured vs. predicted values showed high correlation coefficients (0.92–0.98).
Pires et al. used multivariate calibration and NIR spectroscopy to correctly predict roasting degrees in ground coffee and coffee beans as a substitute for the Agtron method [18]. The mathematical models for predicting Agtron values of new coffee samples using the PLS approach were based on the association between NIR spectra data and Agtron reference results. All Agtron roasting characteristics were investigated in order to create representative models. With RMSEP values of 4.48 and 3.67, respectively, the proposed models showed promising results in predicting roasting characteristics in roasted whole coffee beans and ground coffees.
Yergenson and Aston investigated the use of in situ NIR spectroscopy in the prediction of cracking events (start and end) during coffee roasting in order to develop a more robust method of roasting based on cracks [33]. Two sets of popping sounds (first and second cracks) that occur during coffee roasting are essential indicators for establishing the roasting endpoint. The coffee samples were roasted using various time-temperature profiles. In situ NIR spectroscopy proved to be a reliable tool in forecasting the start and finish times of first and second crack occurrences based on the PLS regression (PLSR) with audio recordings from coffee roasting.
The NIR spectra of coffees (beans and ground) roasted under different conditions are shown in Fig. 2.
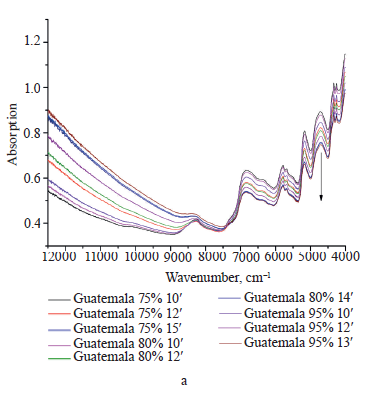
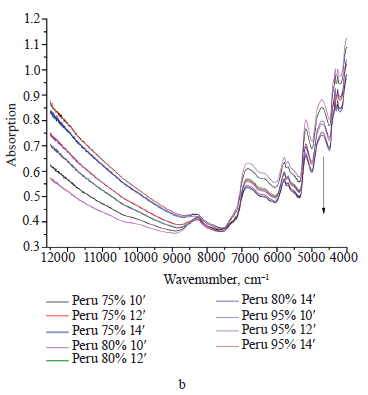
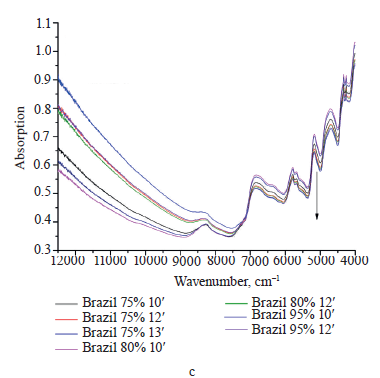
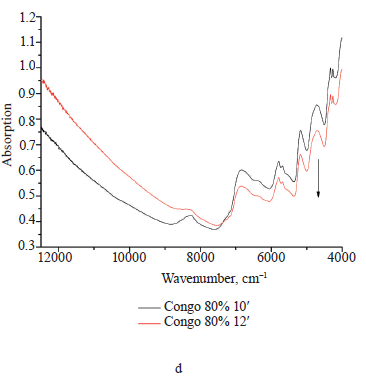
The obtained spectra were similar to each other, although varying in intensity. Longer roasting time lowered the intensity of the bands in all the ranges. This was due to decreased values of coffee components, as well as their volume and weight [34–36]. We found that the samples with the shortest roasting time (8 min) showed the highest absorbance, while those with the longest roasting time (12 min) showed the lowest absorbance at the same wavelength. We also noticed that the intensity of the spectrum bands decreased with increasing roasting time. The NIR spectra obtained during the roasting assays were similar to the spectra reported in other studies [37, 38]. According to the authors, the main changes in the spectra of the roasting process were an absorbance decrease in the water band region (5200–5000 cm–1), which was due to moisture loss, and an absorbance increase in the combination band region (5000–4000 cm–1). A more detailed discussion of the main wavelength intervals and their relationships to chemical and physical changes in coffee during roasting can be found in the work by Santos et al. [37]. Our results were also consistent with those reported by Catelani et al. [38]. The roasting process degraded coffee compounds, namely chlorogenic acid, coffee sugar, fat, and water. Literature data shows that the roasting time also affects the caffeine content in coffee [39]. The longer the coffee is roasted, the lower its caffeine content. All the samples showed a lower intensity with an increase in the roasting time. We concluded that regardless of the origin, the roasting time caused a decrease in the coffee components. The most intense bands occurred in the coffees roasted for the shortest time, which means that they lost the least of their components and nutritional value.
The partial least squares (PLS) analysis was performed to determine the time of roasting. The PLS models were obtained for the entire spectral range (12500–4000 cm–1) and sub-regions without mathematical transformations (Table 4).

We found good correlations between the spectra and the roasting time for all the coffee samples. The R2 values for the calibration and validation curves were 0.94 and 0.78, respectively. The root mean-square errors (RMSE) were low – 0.39 and 0.76 for calibration and validation, respectively. The obtained models were improved when analyzing each type of coffee samples separately. Also, the sub-regions were used to improve the model quality.
There was a weak correlation between the spectra and the roasting power for all the coffee samples. For this reason, we analyzed the samples separately. The most accurate model for Guatemala coffee was obtained in the spectral region of 6813–5332 cm–1. The R2 was 0.97 for calibration and 0.64 for validation. For Peru coffee, the spectral range of 5374–4954 cm–1 gave the best quality model, with R2 values of 0.97 and 0.84 for calibration and validation, respectively. There was no correlation between the spectra and the roasting power for Brazil coffee. The coffee from Congo was not analyzed (only one power condition – 80%).
The degree of coffee roasting can be assessed by the color: the longer the roasting, the darker the beans. We studied a possibility of estimating the roasting time on the basis of the NIR spectra by using the PLS analysis to correlate the NIR spectra (coffee beans) with the L* parameter (Table 4). By analyzing the values of the calibration (R2 = 0.96) and validation (R2 = 0.95) curves, as well as the RMSE values (0.92 for calibration and 1.05 for validation), we assumed that the coffee roasting time could be determined based on the PLS regression analysis and the brightness parameter (L*).
Our study indicates the potentiality of NIR spectroscopy in evaluating coffee quality. Based on the changes of spectra, it is possible to monitor changes during roasting. Chemometric analysis also delivered very promising results. The PLS models (for roasting time and power conditions) hold potential as a rapid and reliable method which could be helpful in coffee manufacturing. Our next step will be to determine the chemical composition of the coffee samples and identify the potential of NIR spectroscopy in correlating roasting conditions (time and power) with the chemical changes in order to select optimal roasting conditions for the final product.
CONCLUSION
Our study aimed to apply near-infrared spectroscopy to evaluate the quality of the coffee samples from Brazil, Guatemala, Peru, and Congo. We investigated their composition based on the spectral bands and vibrations.
The regression results confirmed the possibility of applying the NIR spectra to predict the roasting conditions. There was a correlation between the spectra and the roasting time, with the R2 of 0.94 and 0.78 for calibration and validation, respectively. The RMSEs were low – 0.39 and 0.76 for calibration and validation, respectively. We also obtained a linear relation between the spectra and the roasting power. The quality of the models differed based on the coffee’s origin and subregion. All the coffee samples showed a good correlation between the spectra and the brightness (L* parameter). The R2 values were 0.96 and 0.95 for the calibration and validation curves, respectively.
The results proved that NIR spectroscopy coupled with chemometrics could be a promising tool to predict the roasting conditions of coffee samples. However, the models developed in this study need to be further tested on independent data sets from other coffee varieties to assess their stability and accuracy. Because of its characteristics, NIR spectroscopy has been applied in different production stages in the coffee industry: from green coffee beans to the end product. The growing interest in NIR spectroscopy is primarily due to the technique’s numerous advantages over other analytical techniques. In addition, this technique is nondestructive and noninvasive, with a minimal or non-sample preparation. NIR spectroscopy is also fast, low-cost, and robust, so it can be used in different environments such as laboratories and industrial plants. In the future, the availability of portable instruments will also allow its use in the field. For these reasons, NIR spectroscopy could be named a “green technology”.
CONFLICTS OF INTEREST
The author declares that there is no conflict of interest.REFERENCES
- Andrés S, Murray I, Navajas EA, Fisher AV, Lambe NR. Bünger L. Prediction of sensory characteristics of lamb meat samples by near infrared reflectance spectroscopy. Meat Science. 2007;76(3):509–516. https://doi.org/10.1016/j.meatsci.2007.01.011
- Cozzolino D, Murray I, Chree A, Scaife JR. Multivariate determination of free fatty acids and moisture in fish oils by partial least-squares regression and near-infrared spectroscopy. LWT – Food Science and Technology. 2005;38(8):821–828. https://doi.org/10.1016/j.lwt.2004.10.007
- Woodcock T, Fagan CC, O'Donnell CP, Downey G. Application of near and mid-infrared spectroscopy to determine cheese quality and authenticity. Food and Bioprocess Technology. 2008;1(2):117–129. https://doi.org/10.1007/s11947-007-0033-y
- Dixit Y, Casado-Gavalda MP, Cama-Moncunill R, Cama-Moncunill X, Markiewicz-Keszycka M, Cullen PJ, et al. Developments and challenges in online NIR spectroscopy for meat processing. Comprehensive Reviews in Food Science and Food Safety. 2017;16(6):1172–1187. https://doi.org/10.1111/1541-4337.12295
- Basri KN, Hussain MN, Bakar J, Sharif Z, Khir MFA, Zoolfakar AS. Classification and quantification of palm oil adulteration via portable NIR spectroscopy. Spectrochimica Acta Part A: Molecular and Biomolecular Spectroscopy. 2017;173:335–342. https://doi.org/10.1016/j.saa.2016.09.028
- Mahesh S, Jayas DS, Paliwal J, White NDG. Comparison of partial least squares regression (PLSR) and principal components regression (PCR) methods for protein and hardness predictions using the near-infrared (NIR) hyperspectral images of bulk samples of Canadian wheat. Food and Bioprocess Technology. 2014;8(1):31–40. https://doi.org/10.1007/s11947-014-1381-z
- Baqueta MR, Caporaso N, Coqueiro A, Valderrama P. A review of coffee quality assessment based on sensory evaluation and advanced analytical techniques. In: Kalschne DL, Corso MP, Dias RCE, editors. Innovations in coffee quality. New York: Nova Science Publishers; 2020. pp. 15–31.
- Ribeiro JS, Augusto F, Salva TJG, Ferreira MMC. Prediction models for Arabica coffee beverage quality based on aroma analyses and chemometrics. Talanta. 2012;101:253–260. https://doi.org/10.1016/j.talanta.2012.09.022
- Ribeiro JS, Ferreira MMC, Salva TJG. Chemometric models for the quantitative descriptive sensory analysis of Arabica coffee beverages using near infrared spectroscopy. Talanta. 2011;83(5):1352–1358. https://doi.org/10.1016/j.talanta.2010.11.001
- Belchior V, Botelho BG, Oliveira LS, Franca AS. Attenuated Total Reflectance Fourier Transform Spectroscopy (ATR-FTIR) and chemometrics for discrimination of espresso coffees with different sensory characteristics. Food Chemistry. 2019;273:178–185. https://doi.org/10.1016/j.foodchem.2017.12.026
- Magalhães LM, Machado S, Segundo MA, Lopes JA, Páscoa RNMJ. Rapid assessment of bioactive phenolics and methylxanthines in spent coffee grounds by FT-NIR spectroscopy. Talanta. 2016;147:460–467. https://doi.org/10.1016/j.talanta.2015.10.022
- Mees C, Souard F, Delporte C, Deconinck E, Stoffelen P, Stévigny C, et al. Identification of coffee leaves using FT-NIR spectroscopy and SIMCA. Talanta. 2018;177:4–11. https://doi.org/10.1016/j.talanta.2017.09.056
- Tolessa K, Rademaker M, De Baets B, Boeckx P. Prediction of specialty coffee cup quality based on near infrared spectra of green coffee beans. Talanta. 2016;150:367–374. https://doi.org/10.1016/j.talanta.2015.12.039
- Alessandrini L, Romani S, Pinnavaia G, Rosa MD. Near infrared spectroscopy: An analytical tool to predict coffee roasting degree. Analytica Chimica Acta. 2008;625(1):95–102. https://doi.org/10.1016/j.aca.2008.07.013
- Ribeiro JS, Salva TJG, Silvarolla MB. Prediction of a wide range of compounds concentration in raw coffee beans using NIRS, PLS and variable selection. Food Control. 2021;125. https://doi.org/10.1016/j.foodcont.2021.107967
- Fioresi DB, Pereira LL, Catarina da Silva Oliveira E, Moreira TR, Ramos AC. Mid infrared spectroscopy for comparative analysis of fermented arabica and robusta coffee. Food Control. 2021;121. https://doi.org/10.1016/j.foodcont.2020.107625
- Flores-Valdez M, Meza-Márquez OG, Osorio-Revilla G, Gallardo-Velázquez T. Identification and quantification of adulterants in coffee (Coffea arabica L.) using FT-MIR spectroscopy coupled with chemometrics. Foods. 2020;9(7). https://doi.org/10.3390/foods9070851
- Pires FC, Pereira RGFA, Baqueta MR, Valderrama P, Alves da Rocha R. Near-infrared spectroscopy and multivariate calibration as an alternative to the Agtron to predict roasting degrees in coffee beans and ground coffees. Food Chemistry. 2021;365. https://doi.org/10.1016/j.foodchem.2021.130471
- Chang Y-T, Hsueh M-C, Hung S-P, Lu J-M, Peng J-H, Chen S-F. Prediction of specialty coffee flavors based on near-infrared spectra using machine- and deep-learning methods. Journal of the Science of Food and Agriculture. 2021;101(11):4705–4714. https://doi.org/10.1002/jsfa.11116
- Munyendo L, Njoroge D, Hitzmann B. The potential of spectroscopic techniques in coffee analysis – A review. Processes. 2022;10(1). https://doi.org/10.3390/pr10010071
- Baqueta MR, Coqueiro A, Valderrama P. Brazilian coffee blends: A simple and fast method by near-infrared spectroscopy for the determination of the sensory attributes elicited in professional coffee cupping. Journal of Food Science. 2019;84(6):1247–1255. https://doi.org/10.1111/1750-3841.14617
- Medina J, Caro Rodríguez D, Arana VA, Bernal A, Esseiva P, Wist J. Comparison of attenuated total reflectance mid-infrared, near infrared, and 1H-nuclear magnetic resonance spectroscopies for the determination of coffee's geographical origin. International Journal of Analytical Chemistry. 2017;2017. https://doi.org/10.1155/2017/7210463
- Okubo N, Kurata Y. Nondestructive classification analysis of green coffee beans by using near-infrared spectroscopy. Foods. 2019;8(2). https://doi.org/10.3390/foods8020082
- Zhu M, Long Y, Chen Y, Huang Y, Tang L, Gan B, et al. Fast determination of lipid and protein content in green coffee beans from different origins using NIR spectroscopy and chemometrics. Journal of Food Composition and Analysis. 2021;102. https://doi.org/10.1016/j.jfca.2021.104055
- Levate Macedo L, da Silva Araújo C, Costa Vimercati W, Gherardi Hein PR, Pimenta CJ, Henriques Saraiva S. Evaluation of chemical properties of intact green coffee beans using near-infrared spectroscopy. Journal of the Science of Food and Agriculture. 2021;101(8):3500–3507. https://doi.org/10.1002/jsfa.10981
- Kyaw EM, Budiastra IW, Sutrisnoa, Samsudin. Estimation of moisture content in Liberica coffee by using near infrared spectroscopy. IOP Conference Series: Earth and Environmental Science. 2020;542(1). https://doi.org/10.1088/1755-1315/542/1/012013
- Bicho NC, Leitão AE, Ramalho JC, de Alvarenga NB, Lidon FC. Impact of roasting time on the sensory profile of arabica and robusta coffee. Ecology of Food and Nutrition. 2013;52(2):163–177. https://doi.org/10.1080/03670244.2012.706061
- Hernández JA, Heyd B, Irles C, Valdovinos B, Trystram G. Analysis of the heat and mass transfer during coffee batch roasting. Journal of Food Engineering. 2007;78(4):1141–1148. https://doi.org/10.1016/j.jfoodeng.2005.12.041
- Buratti S, Sinelli N, Bertone E, Venturello A, Casiraghi E, Geobaldo F. Discrimination between washed Arabica, natural Arabica and Robusta coffees by using near infrared spectroscopy, electronic nose and electronic tongue analysis. Journal of the Science of Food and Agriculture. 2015;95(11):2192–2200. https://doi.org/10.1002/jsfa.6933
- Cen H, He Y. Theory and application of near infrared reflectance spectroscopy in determination of food quality. Trends in Food Science and Technology. 2007;18(2):72–83. https://doi.org/10.1016/j.tifs.2006.09.003
- Adnan A, von Hörsten D, Pawelzik E, Mörlein D. Rapid prediction of moisture content in intact green coffee beans using near infrared spectroscopy. Foods. 2017;6(5). https://doi.org/10.3390/foods6050038
- Chindapan N, Soydok S, Devahastin S. Roasting kinetics and chemical composition changes of robusta coffee beans during hot air and superheated steam roasting. Journal of Food Science. 2019;84(2):292–302. https://doi.org/10.1111/1750-3841.14422
- Yergenso A preliminary study on the feasibility of using composition of coffee roasting exhaust gas for the determination of the degree of roast n N, Aston DE. Monitoring coffee roasting cracks and predicting with in situ near-infrared spectroscopy. Journal of Food Process Engineering. 2020;43(2). https://doi.org/10.1111/jfpe.13305
- Noor Aliah AM, Fareez Edzuan AM, Noor Diana AM. A review of quality coffee roasting degree evaluation. Journal of Applied Science and Agriculture. 2015;10(7):18–23.
- Dutra ER, Oliveira LS, Franca AS, Ferraz VP, Afonso RJCF. Preliminary study on the feasibility of using the composition of coffee roasting exhaust gas for the determination of the degree of roast. Journal of Food Engineering. 2001;47(3):241–246. https://doi.org/10.1016/S0260-8774(00)00116-3
- Franca AS, Mendonça JCF, Oliveira SD. Composition of green and roasted coffees of different cup qualities. LWT – Food Science and Technology. 2005;38(7):709–715. https://doi.org/10.1016/j.lwt.2004.08.014
- Santos JR, Lopo M, Rangel AOSS, Lopes JA. Exploiting near infrared spectroscopy as an analytical tool for on-line monitoring of acidity during coffee roasting. Food Control. 2016;60:408–415. https://doi.org/10.1016/j.foodcont.2015.08.007
- Catelani TA, Páscoa RNMJ, Santos JR, Pezza L, Pezza HR, Lima JLFC, et al. A non-invasive real-time methodology for the quantification of antioxidant properties in coffee during the roasting process based on near-infrared spectroscopy. Food and Bioprocess Technology. 2017;10(4):630–638. https://doi.org/10.1007/s11947-016-1843-6
- Alqarni MH, Alam P, Salkini MA, Abdel-Kader MS. Roasting effect on the caffeine contents and antioxidant potential of different coffee grades available in the saudi market. Indo American Journal of Pharmaceutical Sciences. 2018;5(12):16738–16745.
