

Аннотация
Introduction. This study aimed to evaluate the quality of milk produced by six cattlemen’s associations in small, isolated farming communities of Carchi, Ecuador. It involved a herd of 814 cows and lasted eight consecutive months. Another aim was to propose a suitable methodology for milk quality evaluation.Study objects and methods. All milk samples were analyzed for total solids, protein, fat, acidity, density, total bacterial count (TBC) and somatic cell count (SCC). Each sample was subjected to an extended qualitative methylene blue reduction test (MBRTe) for which 10 mL of milk, with 0.5 mL of methylene blue, was incubated at 37°C for 24 h.
Results and discussion. As a result, we obtained the following types of clots: MBRTe-I (homogeneous solid/liquid clot), MBRTe-II (lumpy clot), MBRTe-III (gaseous clot) and MBRTe-IV (lumpy + gaseous clot). The study showed significant differences in the quality of milk between different associations, suggesting that some of them did not comply with good practices of milking, handling and storage of fresh milk. The quality of milk was classified as good in one association, as regular in another association, and as low in four associations. The MBRTe classified 37% of the samples as MBRTe-I, 18% as MBRTe-II, 14% as MBRTe-III and 12% as MBRTe-IV. Of the MBRTe-I samples, 95% showed the TBC and SCC values of first quality milk. The MBRTe-II had the TBC values of first quality milk, but exceeded the SCC, while the MBRTe-III had good SCC values, but exceeded the TBC. Finally, the MBRTe-IV samples exceeded the permissible levels of both TBC and SCC.
Conclusion. It was proved that the MBRTe can help milk producers evaluate the quality of milk and alert them to the possible presence of mastitis in the herd. The MBRTe is a reliable and cheap method that is quick and easy to perform.
Ключевые слова
Dairy industry, raw milk, dairy cattle, microorganisms, somatic cellsВВЕДЕНИЕ
Ecuador produces between 5.5 to 5.8 million liters of milk on a daily basis and this production has been steadily growing in recent years [1]. About 75% of milk is produced in the Andean region, mostly by small associations of farmers, far from large urban centers [2]. The quality of milk determines the quality of dairy products. It refers to the content of microorganisms (pathogenic or not) and somatic cells, as well as the presence of antibiotics and medicines [3]. Milk quality is guaranteed by the health of the herd, as well as good management and milking practices (GMMP). To check the microbiological quality of raw milk, dairy producers commonly use the counts of total bacteria (TBC), somatic cell counts (SCC), and the methylene blue reduction test (MBRT) [4].
The presence of somatic cells in milk has been mainly related to the increase of white cells (leukocytes) as a result of an immune system’s response to mastitis. It is a livestock disease caused by the inflammation of the udder due to the action of pathogenic microorganisms such as Staphilococcus aureaus, Streptococcus dysgalactiae and Streptococcus agalactiae. Mastitis alters the chemical composition of milk and decreases its yield [5, 6].
However, the TBC and SCC are usually carried out in accredited laboratories located in urban areas, far from small farmers and their associations. They are expensive for milk producers and, moreover, the latter have to wait quite long for the results before they can improve the microbiological quality of their milk.
The MBRT, on the other hand, is an old but effective method which has been correlated, with some success, with the total microbial load and, therefore, with the microbiological quality of milk [7–9]I. It is a simple and fast method, although sometimes it lacks the expected precision.
The goals of this work were to evaluate the quality of milk produced by a group of cattlemen’s associations in the province of Carchi, Ecuador, and to suggest a cheap, fast, and reliable alternative methodology that would allow the associations to evaluate the quality of their milk in situ.
ОБЪЕКТЫ И МЕТОДЫ ИССЛЕДОВАНИЯ
Herd size and geographic location. The study involved six cattlemen’s associations (A–F) located in the Andean province of Carchi in Ecuador. There were 11 small farmers in Association A, 27 in Association B, 16 in Association C, 20 in Association D, 15 in Association E and 19 in Association F. Their milk was sampled for eight months, from October 2016 to May 2017. As a result, 709 samples were taken from a herd of 814 milking cows (34 from Association A, 235 from Association B, 50 from Association C, 120 from Association D, 230 from Association E, and 145 from Association F). All the samples were analyzed for total solids, total protein, fat, acidity and density. The total bacteria and somatic cells were also counted.
Physicochemical and microbiological properties of the samples. The determinations of total solids, total protein, fat, acidity and density, as well as somatic cells (SC) and total bacteria counts (TBC) were performed in an accredited laboratory of the Phyto- and Zoo-Sanitary Regulation and Control Agency of Ecuador (AgroCalidad (www.agrocalidad.gob.ec) located in Tumbaco (Quito, Pichincha, Ecuador) [10]. The somatic cell count (SCC, SC/mL) was performed in a Foosmatic™7 (Foss, Hilleroed DK-3400, Denmark) according to the standard procedureVI. The total bacterial count (TBC, CFU/mL) was performed in a BactoScan™FC+ (Foss, Hilleroed DK-3400, Denmark), obtaining values equivalent to those that would be obtained from a standard plate count (SPC).
Standard and extended methylene blue reduction test. The standard methylene blue reduction test (MBRT) and the 24 h extended methylene blue reduction test (MBRTe) were carried out in the associations’ own laboratories. For the quantitative MBRT, 10 mL of a sample was incubated at 37°C with 0.5 mL of methylene blue and the time (in hours) for the blue coloration to disappear was measured according to the technique described in ISO 4833-2:2013. We used the methylene blue reagent produced by Merck KGaA (Darmstadt, Germany). The samples were incubated at 37°C in a conventional water bath (Thermo Scientific™ TSGP10, Waltham, Massachusetts, USA).
The procedure of the qualitative MBRTe was similar to that of the MBRT, but the samples were incubated for 24 h. As a result, we obtained clots of the following four types (Table 1, Fig. 1): a homogeneous solid or liquid clot (MBRTe-I); a heterogeneous lumpy clot (MBRTe-II); a heterogeneous gaseous clot (MBRTe-III), and a heterogeneous lumpy + gaseous clot (MBRTe-IV).
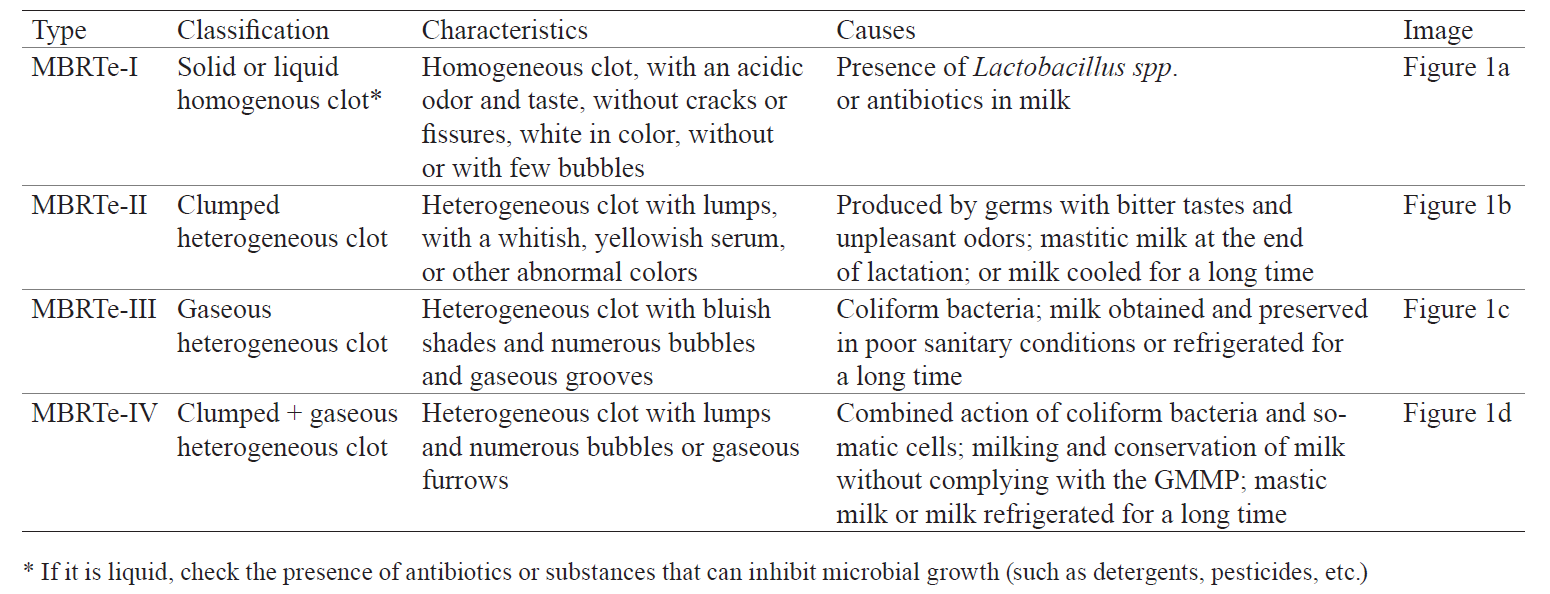
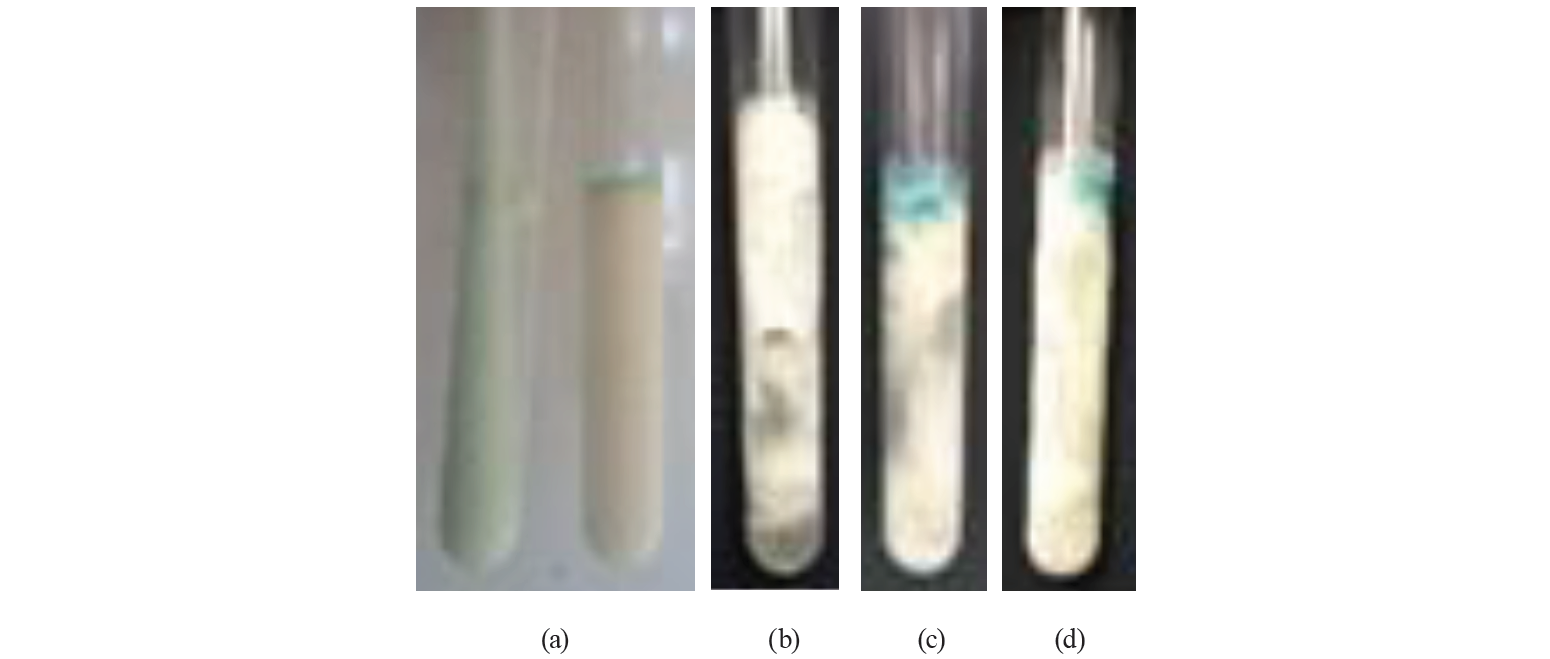
The MBRT is, therefore, a quantitative test (measured in hours), while the MBRTe is a qualitative test (one of the four possible sample types after 24 h incubation with methylene blue).
Statistical Analysis. The statistical analysis was applied using the free statistical package R version 3.6.1 (2019-07-05).
РЕЗУЛЬТАТЫ И ИХ ОБСУЖДЕНИЕ
We analyzed 709 samples for eight continuous variables (SCC, TBC, MBRT, fat, protein, total solids, density and acidity) and three categorical variables:
(1) eight dates (Oct-16, Nov-16, Dec-16, Jan-17, Feb-17, Mar-17, Apr-17, and May-17);
(2) six associations (A, B, C, D, E, and F); and
(3) four MBRTe clots (MBRTe-I, MBRTe-II, MBRTe-III, and MBRTe-IV).
The Lilliefors test (a normality test based on the Kolmogorov-Smirnov test) [11–13] was used to explore the continuous variables, and none of them showed a normal distribution of the samples (P < 0.05).
Recently, a similar finding has been reported in a study conducted to determine the quality of milk (total bacterial and somatic cell counts) among small livestock producers where the values obtained did not follow a normal distribution [14]. This is probably due to the nonhomogeneity of the samples, the differences between the producers with respect to compliance with good practices, as well as uncontrolled factors that fall outside the framework of the studies.
The Kruskal-Wallis rank-sum test was performed to establish the influence of categorical variables over continuous variables [15, 16]. A pairwise comparison with the Wilcoxon nonparametric rank-sum test was used to determine which of the associations or MBRTe types differed from each other (P < 0.05) for each specific continuous variable [17]. Different letters near each of the magnitude values showed significant differences (P < 0.05).
In this study, the values of acidity, total solids, MBRT, SCC and TBC differed significantly (P < 0.05) between the associations, while density, protein and fat concentrations were not different (P > 0.05) (Fig. 2).
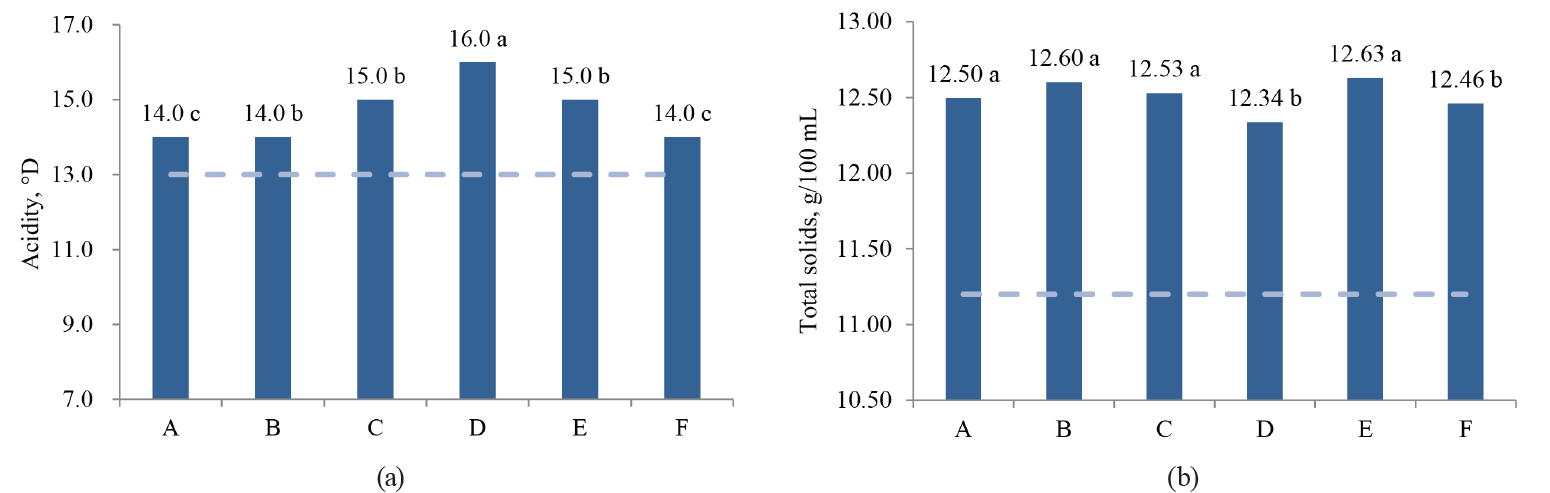
As we can see in Fig. 2, only Association A, which fully implemented the GMMP, showed a better quality of fresh milk during the whole period. Association B, which began to implement the GMMP during the study period, achieved high quality in the final months of the study. Associations C, E and F are still in the process of organizing their quality assurance system, and their results oscillate between regular and low quality. Finally, Association D always had contamination problems and showed poor quality milk, so all of their work protocols need revising.
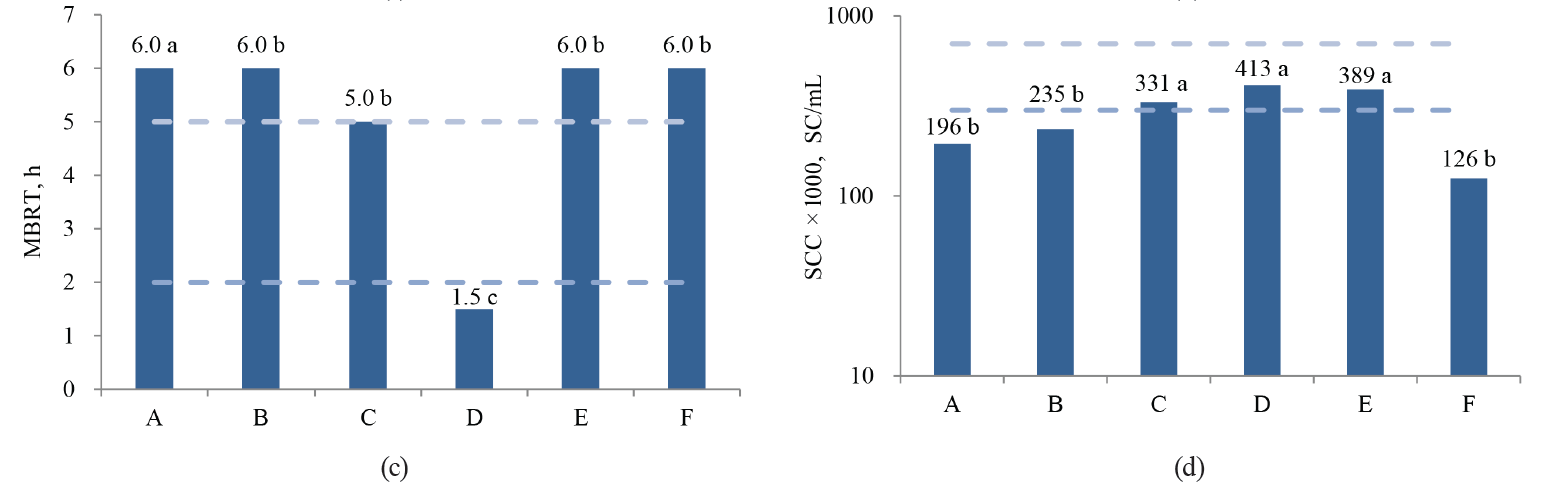
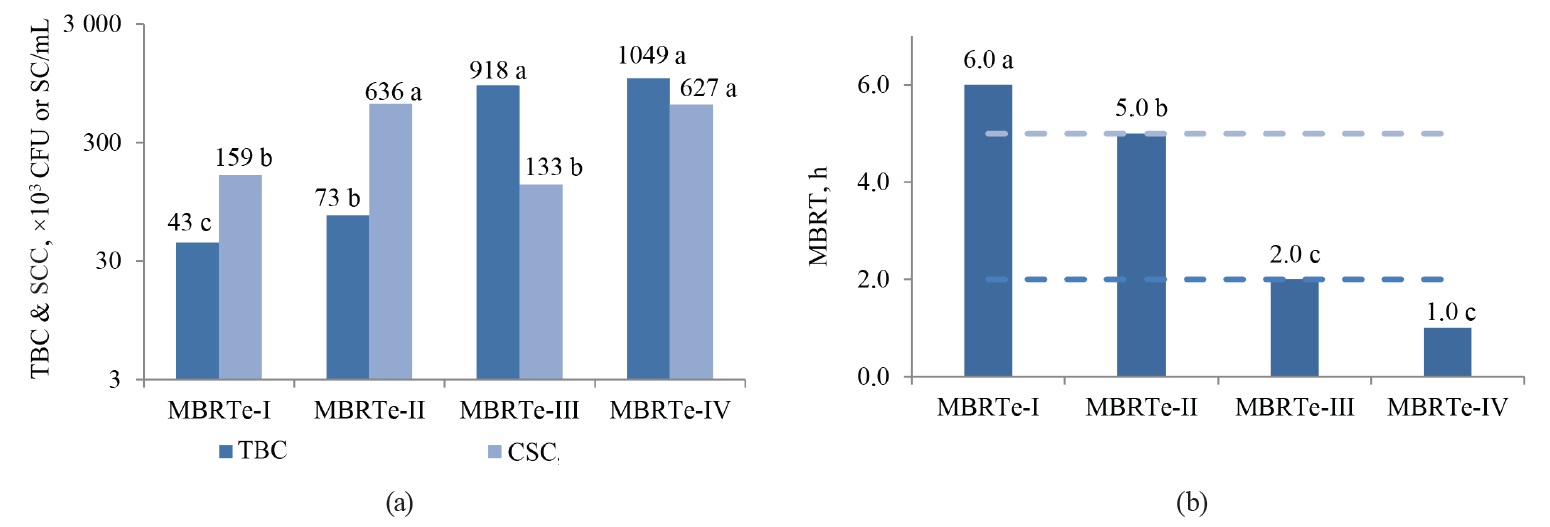
The values of SCC, TBC, MBRT, fat, total solids, and acidity were significantly influenced by the type of MBRTe (P < 0.05), whereas there were no differences (P > 0.05) for the protein content and density (Fig. 3).
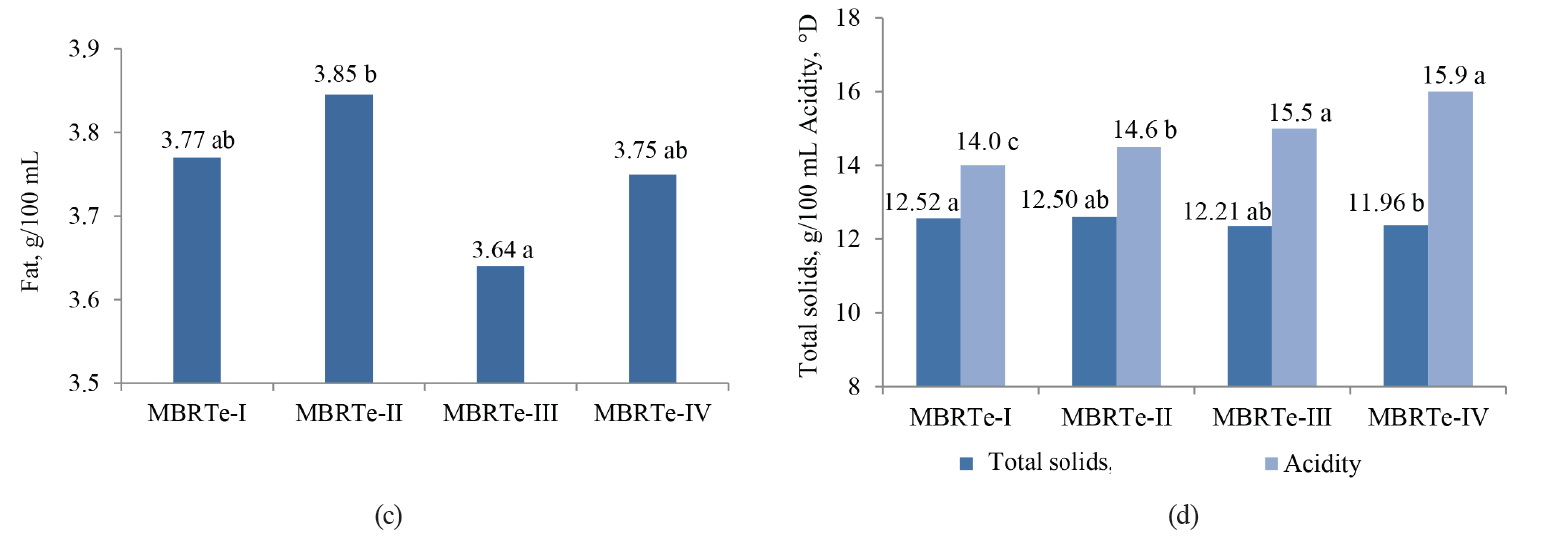
The significant difference (P < 0.05) observed in the fat content between the MBRTe-II and MBRTe-III samples (Fig. 3c) could be due to a high concentration of somatic cells and a low concentration of total bacteria in the MBRTe-II sample group. In fact, the method of fat determination presupposes the addition of sulfuric acid which causes the breakdown of somatic cells incorporated into milk fat. It was also possible that exogenous bacteria species that contaminated milk, which were present in the MBRTe-III samples, exerted a greater lipolytic effect on the fat and lowered its concentration in milk, compared to the rest of the MBRTe samples.
In Fig. 3c, we can observe an increase in acidity and a decrease in total solids when moving from MBRTe-I to MBRTe-IV. This trend seems to be associated with a combined increase in the microbial load and somatic cells in these groups, enhancing the presence of organic acids and therefore leading to higher acidity, and a decrease in carbon sources, such as lactose, leading to lower total solids.
When comparing the magnitudes of the qualitative MBRTe and the quantitative MBRT with the SCC and TBC values in a Kruskal-Wallis rank-sum test, we can see that unlike the MBRT, which is only significantly influenced (P < 0.05) by TBC, but not SCC (P > 0.05), the qualitative variable of MBRTe correlates significantly (P < 0.05) with both the TBC and SCC values.
In the proposed MBRTe test, some of the samples incubated with and without the presence of methylene blue had a similar behavior and formed the same type of clot after 24 h. This finding suggests that the presence of the methylene blue dye does not play the same role as it does in the MBRT test. However, there is a need for more detailed experiments to corroborate the influence or necessity of this dye in the MBRTe test. They need to use the same samples, incubate them under the same conditions for 24 h and then observe the type of clot forming after that time.
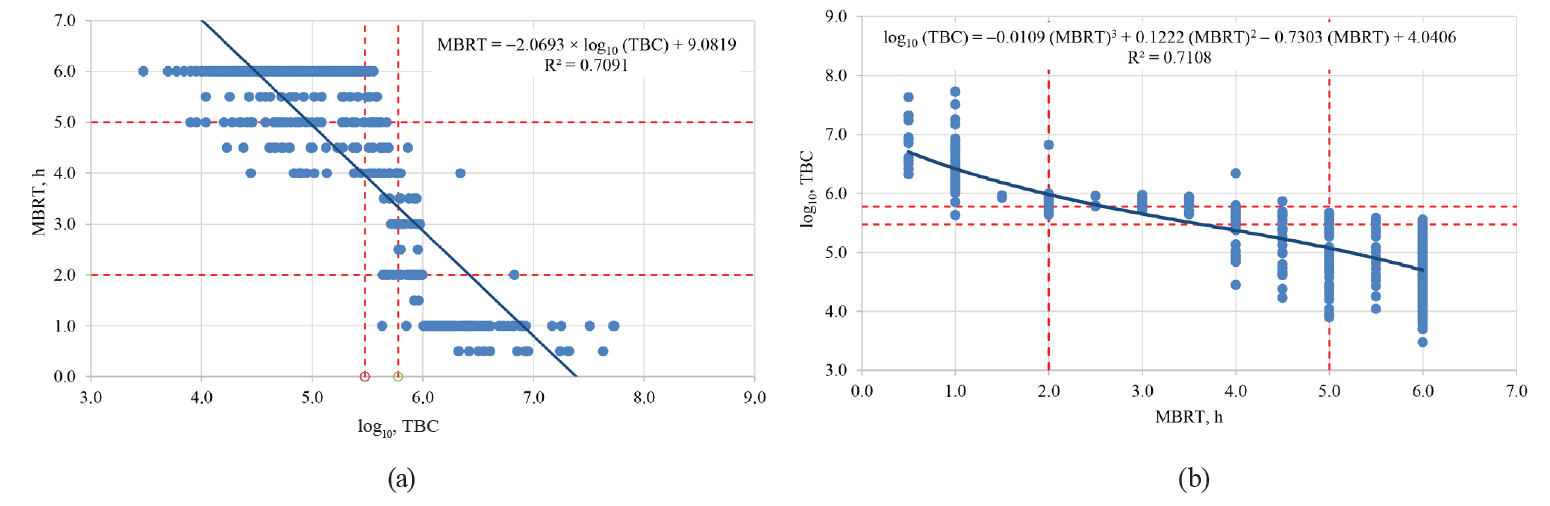
When correlating the MBRT values with the TBC, or vice versa, we can observe similar correlations to those previously reported by other authors [8, 9], although with somewhat lower correlation coefficients R² (Fig. 4).
Thus, the qualitative MBRTe not only would allow us to assess the microbiological quality of milk samples through TBC values, but it could also detect a healthy dairy herd (< 310 000 SC/mL) or the presence of mastitis in its preclinical (310 000 ≤ SCC ≤ 700 000 SC/mL) or clinical (> 700 000 SC/mL) stages, which is impossible to do with the standard MBRT test.
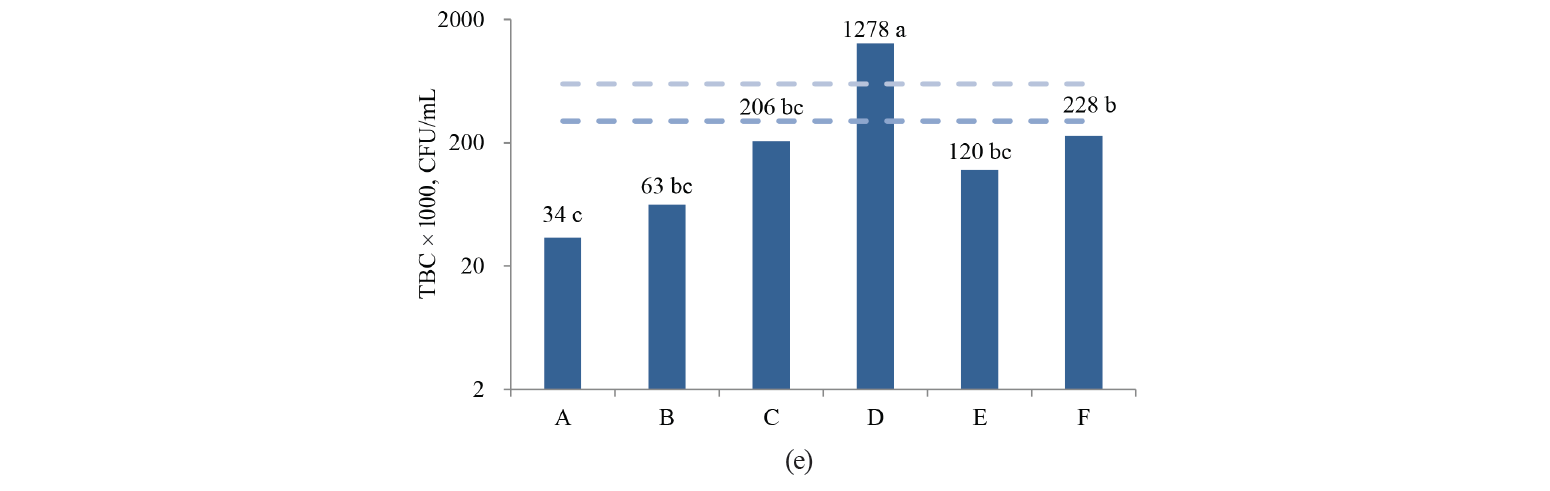
Fig. 5 shows the distribution of the MBRTe samples in each association. As we can see, the associations with the highest proportions of MBRTe-I, compared to the other types, had the best quality milk.
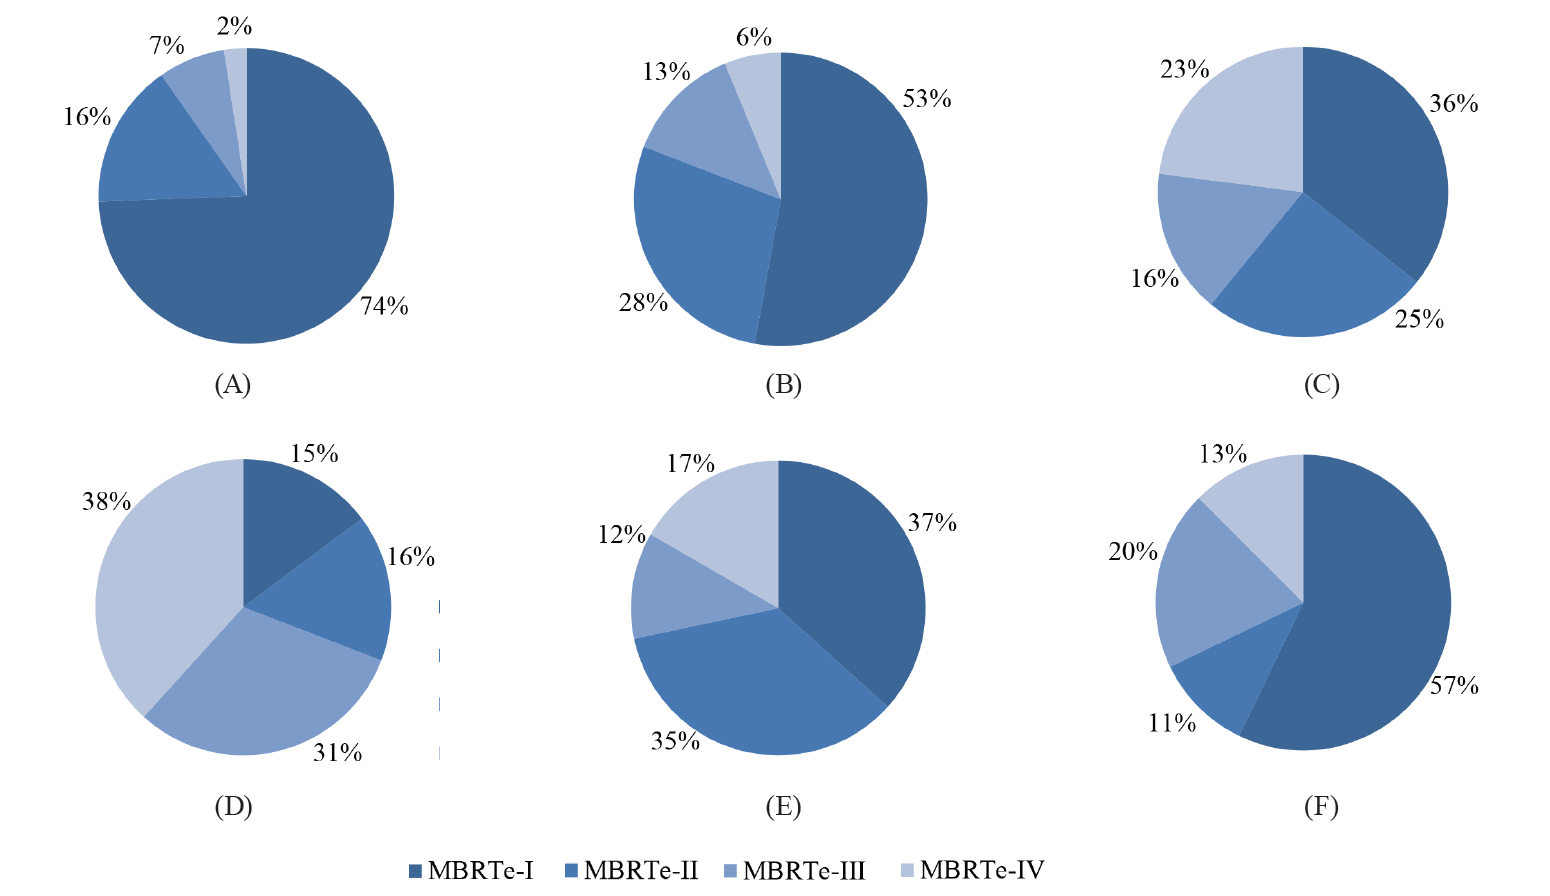
As we can see in Fig. 5, Association A provided better milk quality than the rest of the associations. The lowest-quality milk was produced by Association D. This means that the health of its herd and the procedures for milking, handling, and storage of fresh milk should be reviewed.
When correlating the TBC and SCC values with the qualitative MBRTe, we observed that the MBRTe could adequately predict not only the samples with a high bacterial load, but also those with a significant presence of somatic cells. The latter might indicate preclinical or clinical mastitis in the herd (Fig. 6).
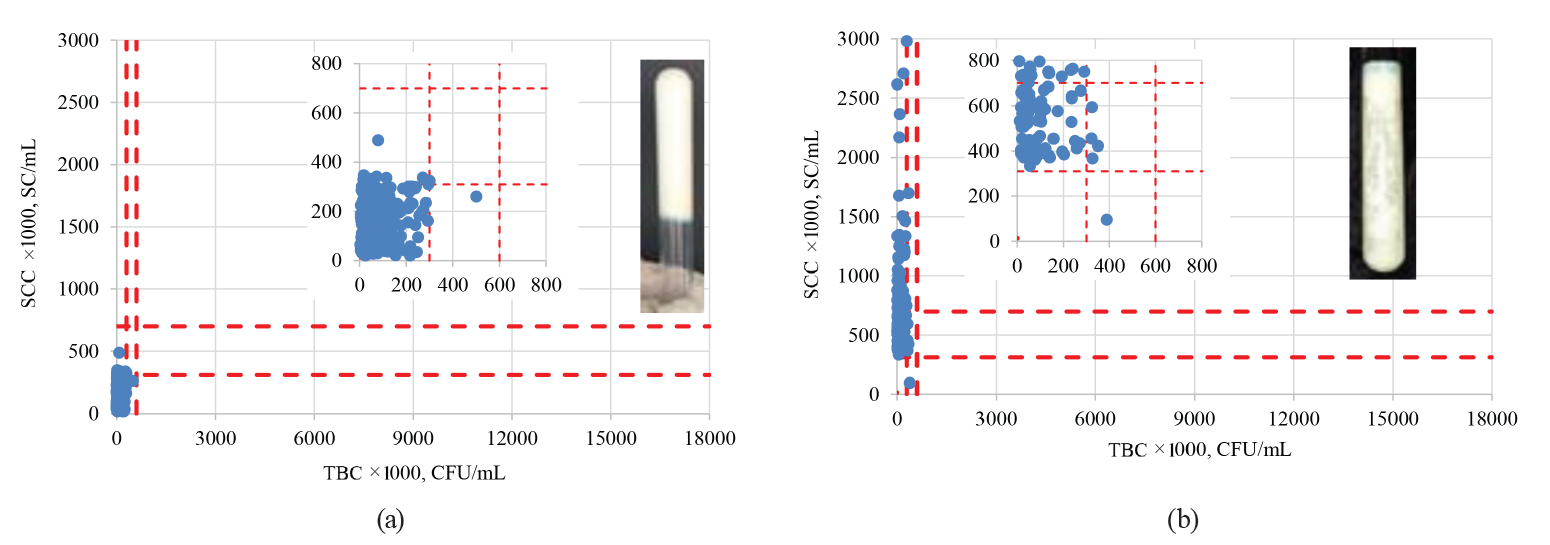
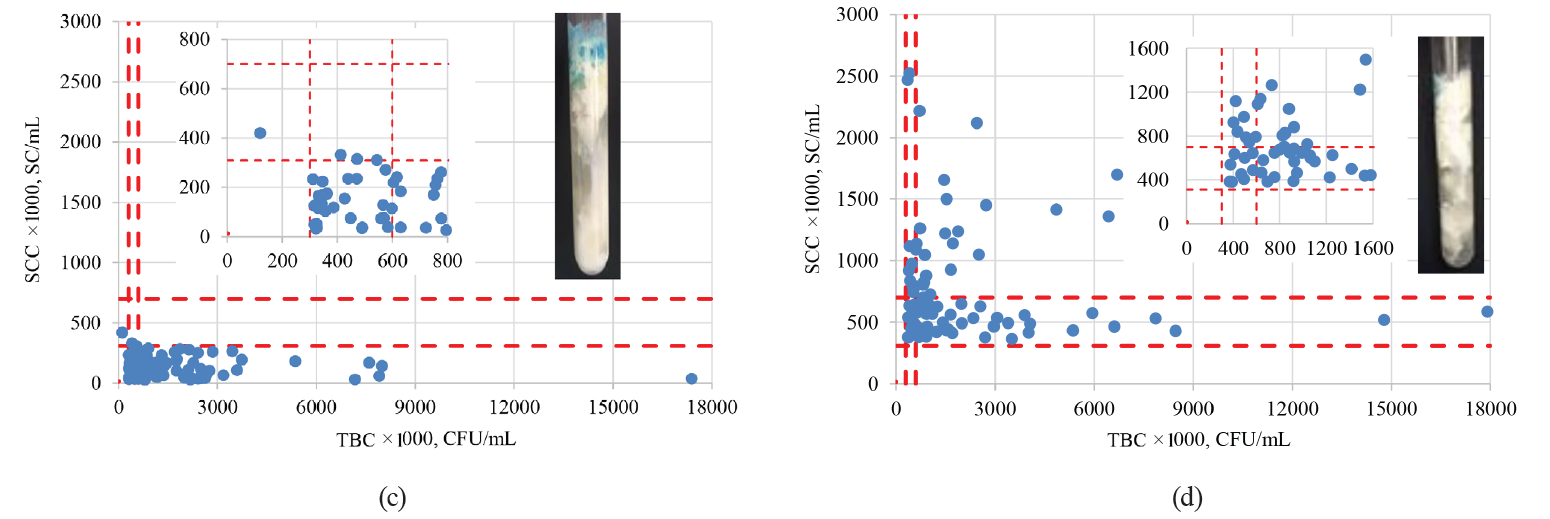
As we can see in Fig. 6a, more than 94% of the MBRTe-I samples had SC values below 310 000 SC/mL and TBC values below 300 000 CFU/mL. Fig. 6b shows that more than 94% of the MBRTe-II samples had TBC values below 300 000 CFU/mL, while 57% of them had SC values between 310 000 and 700 000 SC/mL, which could indicate a preclinical condition of mastitis. Moreover, 42% of the MBRTe-II samples had SC values of over 700 000 SC/mL, which suggests the presence of mastitis in at least part of the dairy herd. Of the MBRTe-III samples, 97% had SC values below 310 000 SC/mL, which indicates a healthy dairy herd, without mastitis problems.
However, as we can see in Fig. 6c, 32% of those samples showed moderate values of microbial contamination (between 300 000 and 600 000 CFU/mL) and 67% of them had high values (> 600 000 CFU/mL). These data suggest that the samples came from a healthy dairy herd, but the GMMP were not followed properly. Finally, all the MBRTe-IV samples (Fig. 6d) showed moderate to high values of both TBC and SCC, suggesting a dairy herd with mastitis problems and bad management and milking practices. Such a product cannot be recommended for direct consumption – it has to be carefully pasteurized before being used in the manufacture of dairy products.
Likewise, we analyzed a possible relationship between the physicochemical and hygienic-sanitary properties of the samples and the month in which these samples were taken (from October 2016 to May 2017). For this, a Kruskal-Wallis rank sum test was applied to each of the measurements made to each sample and the month of sampling. We found that the TBC, MBRT, protein and fat contents did not depend on the months in which the samples were taken. However, the determinations of density, total solids and SCC, in at least a couple of months, were influenced by the month of sampling. To determine the significance (P < 0.05) of these differences, we performed a pairwise comparison using the Wilcoxon nonparametric rank-sum test and the Bonferroni method (Fig. 7), as we did with the previous categorical variables (type of association and MBRTe) [17].
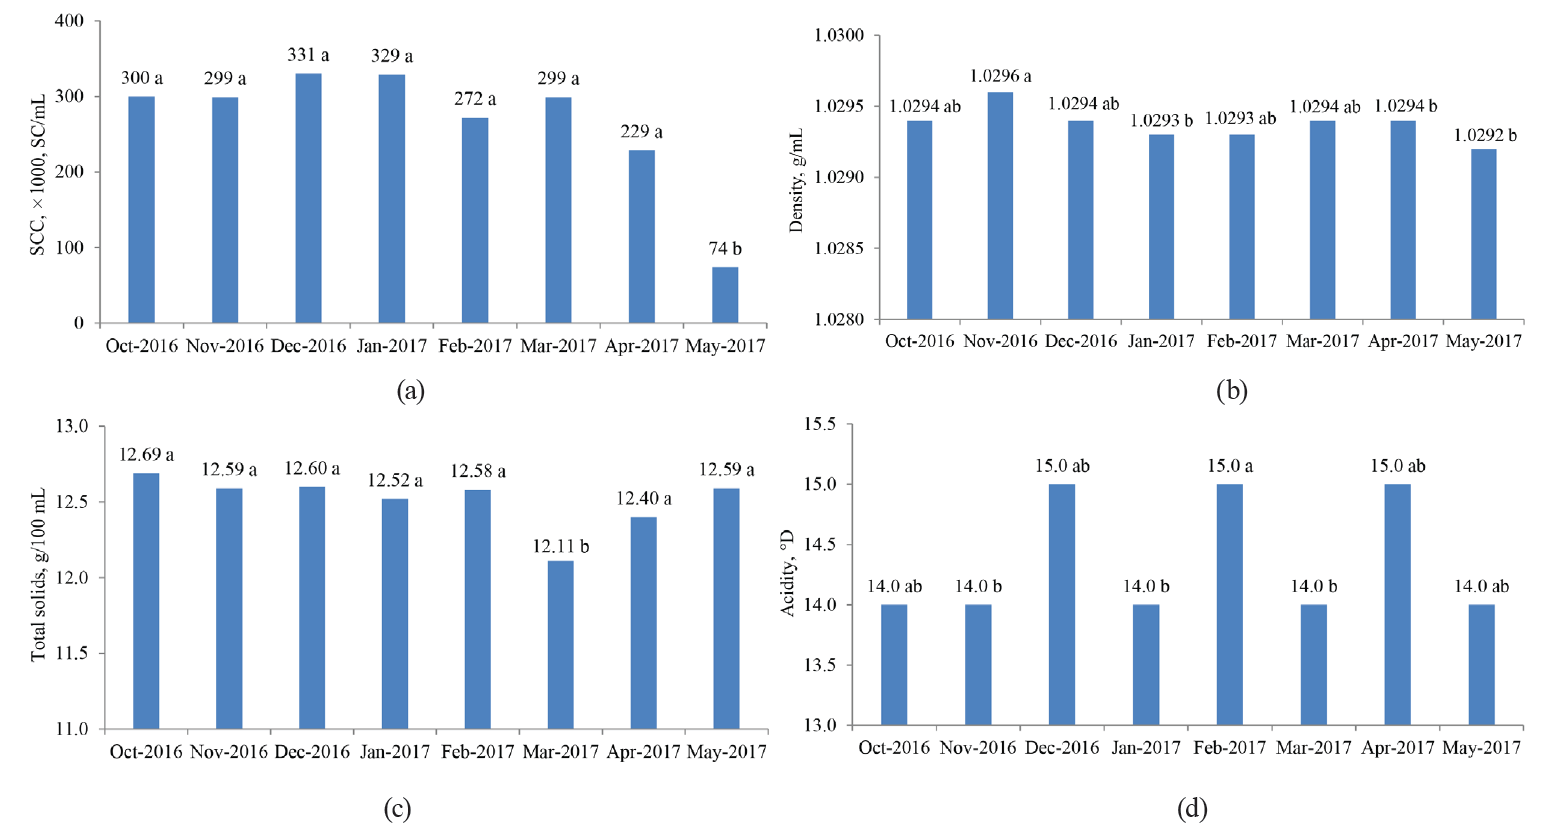
The differences associated with the month in which the samples were analyzed could be explained by some uncontrolled factors in the experiments. These include variations in the periods of rain, which could influence the type and abundance of the grass consumed by the dairy herd, and changes in the management of the herd, as well as milking and storage of fresh milk. Also, possible measures taken by the associations to deal with mastitis problems may have been reflected in the SC values, as well as the time they were taken.
To sum up, we can say that the MBRTe correctly prequalified fresh milk and, therefore, allowed us to suggest possible industrial uses for it and set fair market prices (Table 2).

We all know of difficulties that small cattlemen’s associations have with assessing the microbiological quality of milk and detecting sub-clinical mastitis in real time to continuously improve the quality of milk delivered to the industry and consumers. Accredited laboratories that perform somatic cells and total bacterial counts, as well as the methylene blue reduction test (MBRT), are located in provincial cities or capitals, far away from the rural areas where most of the small farmers’ associations are, at least in Ecuador [16]. This means that the farmers’ associations usually have to wait a few days (an average of 3 days) for the test results. Thus, they cannot quickly identify individual producers that affect the milk quality of the whole association to take prompt corrective measures.
Moreover, the cost of such analysis in Ecuador, including transportation (for a distance of ~ 50 km), is approximately $9.56 per sample. In contrast to that, the qualitative MBRTe takes only one day and costs approximately $0.46 per sample. In addition, it is easy to perform and its interpretation is straightforward and simple: fresh milk is pre-qualified as good (MBRTe-I), intermediate to good (MBRTe-II), poor to intermediate (MBRTe-III), and poor (MBRTe-IV).
The qualitative MBRTe would allow us not only to know if the association follows good practices of milking, handling and storage of milk, but also to examine the health of the dairy herd, as far as mastitis is concerned. In addition, it is a cheap test since it requires only a conventional thermostatic bath, the blue methylene reagent, and a set of common glass tubes. It is significantly cheaper than modern equipment for the detection and counting of somatic cells.
The above makes the MBRTe suitable for small associations of livestock farmers that are isolated from cities and towns where accredited laboratories are generally located.
Additionally, the MBRTe can be applied not only to raw fresh milk collected from all the farmers in the association, but also from individual farmers who are its members. This last feature could help identify individual cattlemen who own dairy herds with preclinical or clinical mastitis or those who do not comply with good practices of milking and handling of fresh milk. By doing so, the association can make a corrective plan to improve the microbiological quality of raw fresh milk in the near future and establish better market prices for its producers.
ВЫВОДЫ
In this work, we evaluated the quality of milk produced by six dairy associations of small farmers in the province of Carchi for eight consecutive months. We determined the hygienic and sanitary status of milk and dairy herd, respectively. The study found an adequate correlation between the quality of milk and the farmer’s compliance with good practices of milking, handling and storage of fresh milk. Thus, it served to encourage some of the associations to comply with these good practices.
We demonstrated a relationship between the qualitative MBRTe and somatic cells and total bacteria counts. As a result, we proposed the MBRTe to the cattlemen’s associations in the Ecuadorian highlands to pre-qualify milk collected from both the entire association and individual farmers. Also, the proposed methodology can be useful for isolated ranchers, away from accredited labs, to check the quality of their milk by themselves. This test can identify the presence of sub-clinical or clinical mastitis and inadequate management of milking, handling, storage and transportation of fresh milk. The results can be used to make appropriate improvement plans to correct these deficiencies and enhance the quality of milk.
КОНФЛИКТ ИНТЕРЕСОВ
The authors declare that there were no conflicts of interest during the elaboration of this work or later, during the preparation of the manuscript.
БЛАГОДАРНОСТИ
We would like to thank the engineers Luis Aldean and Vanessa Bastidas from the Alpina S.A. Foundation (www.alpina.com.co) for the support given to this research.
СПИСОК ЛИТЕРАТУРЫ
- Juan Pablo Grijalva: Exportar leche, una buena solución [Juan Pablo Grijalva: Export milk, a good solution] [Internet]. [cited 2019 Oct 01]. Available from: https://www.revistalideres.ec/lideres/exportacion-leche-ganaderos-lacteosconsumo.html.
- Un tercio de la producción láctea se dedica al queso [A third of dairy production is dedicated to cheese] [Internet]. [cited 2019 Oct 01]. Available from: https://www.revistalideres.ec/lideres/ecuador-produccion-lactea-queso.html.
- Esguerra JC, Cassoli LD, Munera-Bedoya OD, Ceron-Munoz MF, Machado PF. Milk quality: milking personnel associated factors. Revista Mvz Cordoba. 2018;23(1):6461–6473. DOI: https://doi.org/10.21897/rmvz.1241.
- Rodrigues MX, Lima SF, Canniatti-Brazaca SG, Bicalho RC. The microbiome of bulk tank milk: Characterization and associations with somatic cell count and bacterial count. Journal of Dairy Science. 2017;100(4):2536–2552. DOI: https://doi.org/10.3168/jds.2016-11540.
- Jamali H, Barkema HW, Jacques M, Lavallee-Bourget EM, Malouin F, Saini V, et al. Invited review: Incidence, risk factors, and effects of clinical mastitis recurrence in dairy cows. Journal of Dairy Science. 2018;101(6):4729–4746. DOI: https://doi.org/10.3168/jds.2017-13730.
- Dalen G, Rachah A, Norstebo H, Schukken YH, Reksen O. The detection of intramammary infections using online somatic cell counts. Journal of Dairy Science. 2019;102(6):5419–5429. DOI: https://doi.org/10.3168/jds.2018-15295.
- Thornton HR, Hastings EG. Studies on oxidation-reduction in milk: The methylene blue reduction test. Journal of Dairy Science. 1930;13(3):221–245. DOI: https://doi.org/10.3168/jds.S0022-0302(30)93520-5.
- De Silva SASD, Kanugala KANP, Weerakkody NS. Microbiological quality of raw milk and effect on quality by implementing good management practices. Procedia Food Science. 2016;6:92–96. DOI: https://doi.org/10.1016/j.profoo.2016.02.019.
- Boor KJ, Wiedmann M, Murphy S, Alcaine S. A 100-year review: Microbiology and safety of milk handling. Journal of Dairy Science. 2017;100(12):9933–9951. DOI: https://doi.org/10.3168/jds.2017-12969.
- Official methods of analysis of AOAC International, 21th Edition. Washington DC: The Association of Official Analytical Chemists, 2019.
- Lilliefors HW. On the Kolmogorov-Smirnov test for normality with mean and variance unknown. Journal of the American Statistical Association. 1967;62(318):399–402. DOI: https://doi.org/10.1080/01621459.1967.10482916.
- Lilliefors HW. On the Kolmogorov–Smirnov test for the exponential distribution with mean unknown. Journal of the American Statistical Association. 1969;64(325):387–389. DOI: https://doi.org/10.1080/ 01621459.1969.10500983.
- Dallal GE, Wilkinson L. An analytic approximation to the distribution of lilliefors test statistic for normality. American Statistician. 1986;40(4):294–296. DOI: https://doi.org/10.2307/2684607.
- Arrieta G, Gomezcaceres L, Albis D, Calderon-Rangel A, Rodriguez V. Quality of raw milk for human consumption at two locations in Sucre (Colombia). Revista Mvz Cordoba. 2019;24(3):7355–7361. DOI: https://doi.org/10.21897/rmvz.1829.
- Kruskal WH, Wallis WA. Use of ranks in one-criterion variance analysis. Journal of the American Statistical Association. 1952;47(260):583–621. DOI: https://doi.org/10.1080/01621459.1952.10483441.
- Choi W, Lee JW, Huh MH, Kang SH. An algorithm for computing the exact distribution of the Kruskal-Wallis test. Communications in Statistics-Simulation and Computation. 2003;32(4):1029–1040. DOI: https://doi.org/10.1081/sac-120023876.
- Wilcoxon F. Individual comparisons by ranking methods. Biometrics Bulletin. 1945;1(6):80–83. DOI: https://doi.org/10.2307/3001968.
- García-Martínez EM, Fuentes-López A, Fernández-Segovia I. Determinación de la calidad higiénica de la leche mediante la medición indirecta del tiempo de reducción del azul de metileno o prueba de la reductasa microbiana [Determination of the hygienic quality of milk by indirect measurement of the reduction time of methylene blue or microbial reductase test]. València: Universitat Politècnica València; 2014. 7 p. (In Spanish).
