

Аннотация
The paper deals with the theory of fuzzy sets as applied to food industry products. The fuzzy indicator function is shown as a criterion for determining the properties of the product. We compared the approach of fuzzy and probabilistic classifiers, their fundamental differences and areas of applicability. As an example, a linear fuzzy classifier of the product according to one-dimensional criterion was given and an algorithm for its origination as well as approximation is considered, the latter being sufficient for the food industry for the most common case with one truth interval where the indicator function takes the form of a trapezoid. The results section contains exhaustive, reproducible, sequentially stated examples of fuzzy logic methods application for properties authentication and group affiliation of food products. Exemplified by measurements of the criterion with an error, we gave recommendations for determining the boundaries of interval identification for foods of mixed composition. Harrington’s desirability function is considered as a suitable indicator function of determining deterioration rate of a food product over time. Applying the fuzzy logic framework, identification areas of a product for the safety index by the time interval in which the counterparty selling this product should send it for processing, hedging their possible risks connected with the expiry date expand. In the example of multi-criteria evaluation of a food product consumer attractiveness, Harrington’s desirability function, acting as a quality function, was combined with Weibull probability density function, accounting for the product’s taste properties. The convex combination of these two criteria was assumed to be the decision-making function of the seller, by which identification areas of the food product are established.Ключевые слова
Fuzzy logic, Harrington’s desirability function, identification criteria of food products, identification areasВВЕДЕНИЕ
In the food industry, the task of identification – that is, determining the attribution of a food product to a particular class in terms of condition, quality and taste characteristics – stands alone. For the solution of this task there exist: a set of criteria both measurable and expert; typical characteristics that product clusters must meet; and stratifying borderline values [1–5].
At the same time, all the obtained relations are empirical. Besides, as discriminatory criteria are construed, product clusters often intersect according to some measured parameters, so it makes sense to introduce a characteristic of attribution [6]. The latter would be a unit (“the sample certainly belongs to this product cluster”) in cluster centers and would decrease at the borders (“the sample belongs to some extent to one cluster and to some extent to the neighboring one”). This would allow making product identification more transparent and applicable to real food applications [7, 8].
The method of fuzzy sets theory application to the problems of the food industry, proposed in this paper, will create lax regulatory restrictions on the composition, quality and sanitary characteristics of the product, taking into account the varied errors of methods and measurements. The purpose of this research was to provide food industry experts with a tool that allows building a robust multiparameter identification criteria based on empirical product data.
ОБЪЕКТЫ И МЕТОДЫ ИССЛЕДОВАНИЯ
The concept of fuzzy sets as applied to the food industry. In order to define fuzzy set A for elements of ℝn, enter the indicator membership function:
![]()
Concurrently, the set in the classical sense of, defined in this way, is a special case of A*, a fuzzy set:
![]()
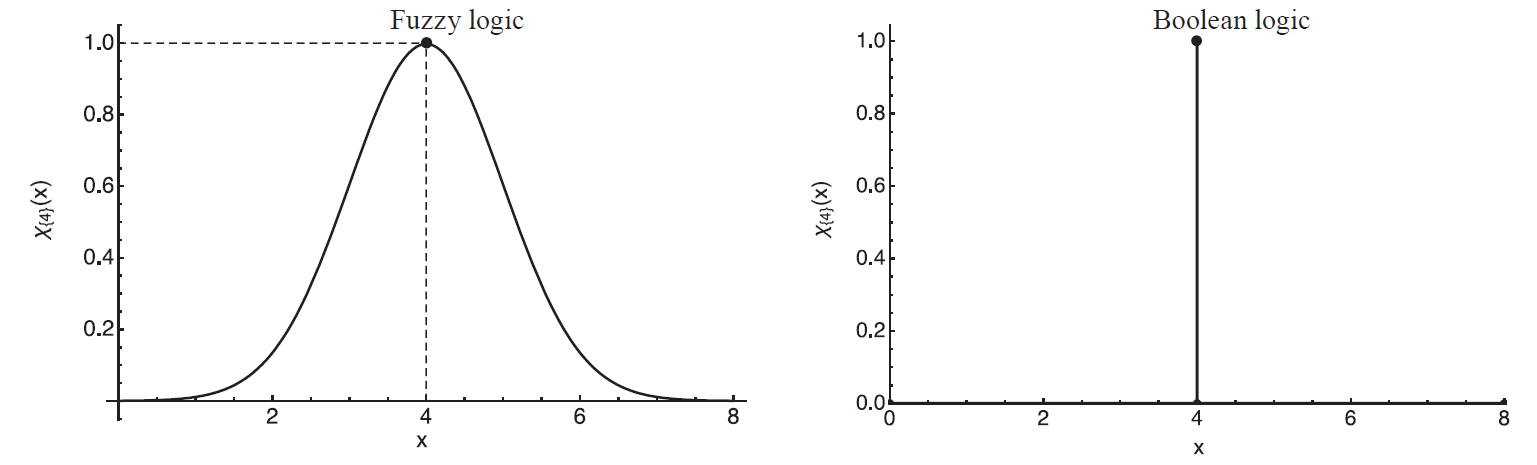
Thus, fuzzy logic extends the Boolean one with two values {0,1} to the continuum of values in the interval of [0, 1]. The difference between the approaches is shown in Fig. 1. Most often, the value χA(x) is interpreted as a subjective assessment of x as attributed to A, for example χA(x) = 0.9 means that is 90% of A [9].
The example of interpretation contains the word “subjective”, which presupposes the possibility of each subject having an opinion concerning the relationship of each specific set attribution on the basis of their own indicator function. For food industry, this means the need of using a consensus membership function for each criterion; the function based on a particular food industry experts’ consolidated opinion, as well as confirmed experimental data [10].
The subjectivity of assessment also implies the existence of a method of translating psycholinguistic conclusions about the considered attribution to the digital domain of the indicator function.
The concept of a linguistic variable includes the object under study, as well as a set of natural language phrases (linguistic lexemes) that the variable can take in a fuzzy sense. The method of establishing the relevance is individually selected for each industry and case of study. Common sense is one of the primary factors, since the number of linguistic lexemes used by experts and intended for digital transformation is extremely diverse, for example: “true”, “false”, “almost false”, “almost true”, “unknown”, “possible”, “sometimes”, “may be”, etc. (Fig. 2).

The main prerequisite for the use of fuzzy logic as applied to the food industry is the inability to build clear relations and criteria that link the quality and performance of products and are not subject to multiparameter, unamenable to expression, factors of influence and measurement errors [11].
In a way, the definition of a fuzzy set via the indicator function contains neither lack of focus nor ambiguity, so it is possible to use the fuzzy logic framework for setting standards and identification methods in the food industry.
Basic operations with fuzzy sets. Let us examine in more detail the possible fuzzy sets manipulations and highlight the most common operations in terms of the food industry (in fuzzy logic it is impossible to identify a finite set of basic functions, through which all the others could be expressed; besides, operations on sets become “blurred”) [12–14].
Consider the sets, A, B ⊂ ℝn. The relation of inclusion of the A set B into:
![]()
The most practical option for constructing fuzzy negation Ā is:
![]()
There is an unlimited number of simple fuzzy negations; besides, this method is convenient for constructing linguistic expert models, for exemples, the negation for "unknown" (χA(x) = 0.5) will also be "unknown".
The expansion of conjunction (operation “AND”) for fuzzy sets is called the t-norm (or triangular norm), and the expansion of disjunction (operation “OR”) is called the s-norm. In practice, most commonly used are:
The logical product of A∩B and sum A∪B:
![]()
The algebraic product of A⚹B and sum A+B
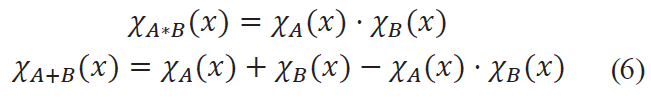
The presented pairs of t- and s- norms are called dual, since when using the above negation, de Morgan’s laws are implemented in a fuzzy form, which makes their application practically convenient in calculations.
Failure of the law of complementarity in the general case must be noted as an important feature of fuzzy logic. Denoting t-norm as &, s-norm as |, we have:
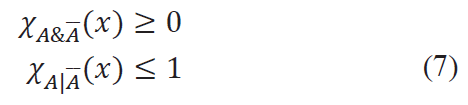
The postulate of Boolean algebra “some criterion and its negation are simultaneously unjust” violates the introduction of intermediate variants. In particular, that of the lexeme “unknown”, since it and its negation are assumed to be simultaneously and equally fair. This fact demonstrates the coexistence of the property and its negation.
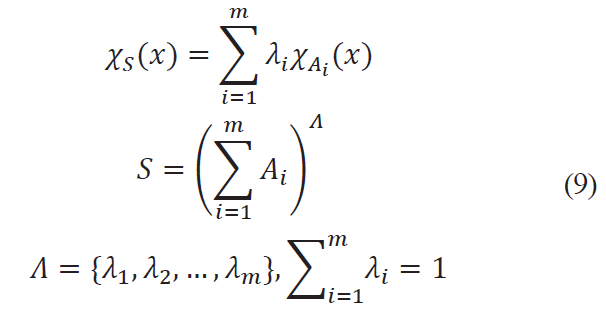
With multi-criteria identification of food products it is often necessary to assign weight numbers for each individual criterion while obtaining the aggregate indicator quality function. To do this, convex integration with λ coefficient (denote as (A+B)λ) is used:
![]()
This formula is easily generalized for the case of criteria. Suppozing there are fuzzy sets A1, A2, ... , Am, where Ai ⊂ ℝn their convex integration will have the form:
Constructing indicator functions, it is useful to control the smoothness and speed of the transition of one linguistic concept to another. To do this, we use a power function that defines Aα as follows:
![]()
If α < 1, the function reduces the requirements for membership to the set Aα with respect to A, at α > 1, the function clarifies it.
Linear fuzzy classification. From the standpoint of the probability theory the indicator function can be interpreted as conditional probability
![]()
that is, the probability of membership to the set of a random variable X, provided that it was implemented by x value. It should be noted that this is the basic difference between the approaches: fuzzy logic operates by the degree of membership to a particular set. While probability theory (and “probabilistic” logic) indicates the probability of occurrence of mutually exclusive events.
As an example, consider the fuzzy classification of drinking milk by fat content (Fig. 3). According to this classification, milk with a fat content of 3.75% is both 0.5 medium-fat and 0.5 high-fat. We consciously give no percentages here, because it is not a matter of probability (otherwise, in a batch of milk with the same fat content of 3.75%, half of the bottles would be recognized as “medium-fat”, and the other half – as “high-fat”, which makes no sense). Fuzzy sets exist in superposition with each other, this being their main advantage in food identification. Continuing the example on the same classifier, 0.8 milk of average fat content is actually the same as 0.2 of extra fat content, and this has a direct interpretation since two linguistic postulates describing different degrees of one measurable criterion are associated. At the same time, it should be noted that combining probabilistic and fuzzy methods has its own scope; besides, probability distributions can be used as indicator functions, as will be shown below.
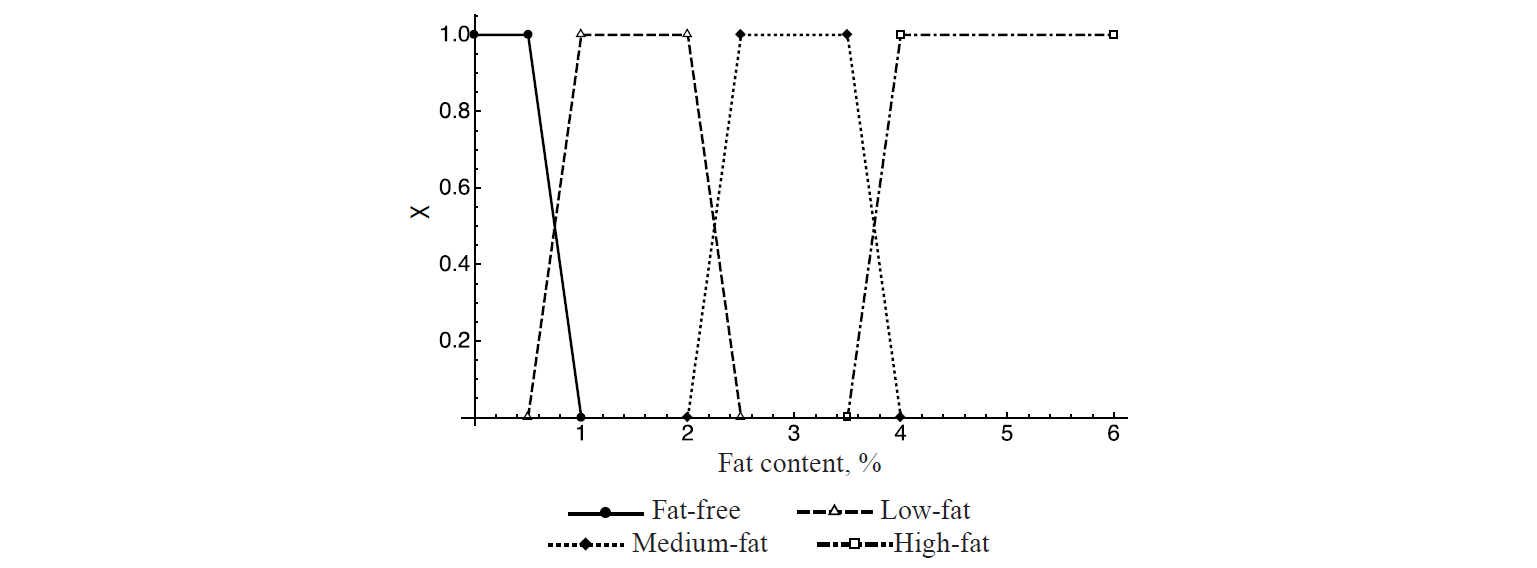
In the example with milk fat linear functions are used to determine the degree of membership, being the most practically applicable for the food industry due to the simplicity of construction and linguistic explanation of the result [15, 16]. In order to construct a linear characteristic function χA(x) for some criterion A on the domain R ∈ ℝ there are three steps to follow:
(1) Determination of the intervals (xi, yi), i = 1 ... n, where χA(x) = 1 that is, belonging to such intervals is characterized by the lexeme "certanly Yes";
(2) Determination of the intervals (x'j, y'j), j = 1 ... m, where χA(x), that is, their linguistic characteristics is "certanly No";
(3) Combination of the intervals into one list with the length of k = n + m and sort them in ascending order of the left border. Since in the resulting list the intervals with characteristics "certanly Yes" and "certanly No" will alternate, it remains only to connect the boundaries by linear function.
(a) For the sequence (xi, yi); (x'i+1, y'i+1) the function will look like:
![]()
(b) For the sequence (x'i, y'i); (xi+1, yi+1) the function will look like:
![]()
Of course, in practice the most common case is that with one truth interval, and the function takes the form of a trapezoid, as seen in the graph of milk classification.
For one truth interval the convenient approximationis:
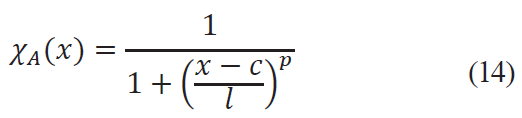
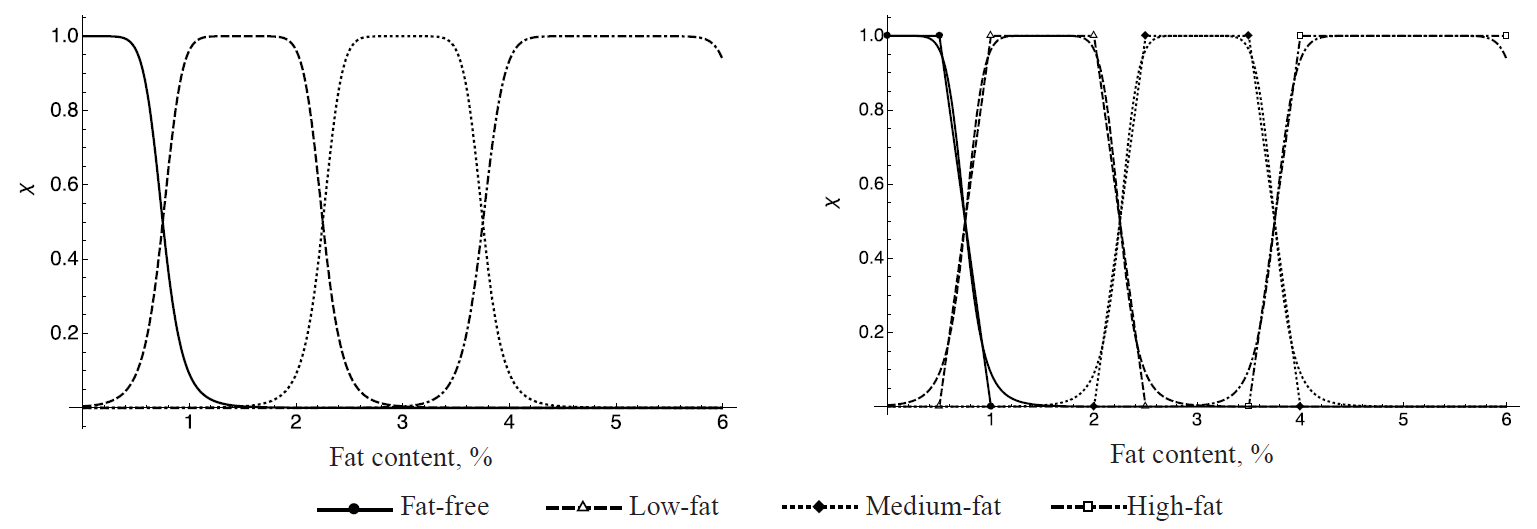
where c is the center of interval, l is the range, p is the smoothing fit. In the context of the example, the indicator function for dairy products will take form:
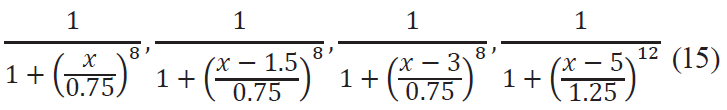
for fat-free, low fat, medium fat and high fat products, respectively. The patterns of these functions, as well as comparison of the two approaches are shown in Fig. 4.
РЕЗУЛЬТАТЫ И ИХ ОБСУЖДЕНИЕ
To determine the value of the indicator function χA(x) at a particular point, it is sometimes necessary to resort to nested fuzzy sets. This happens, for example, when the values of the linguistic variables of the expert group differ for the same criterion at a point. When a indicator function of a set is realized not by a specific number, but by another indicator function, it is called a second order fuzzy set. In practice, it is very difficult to use such items, and they are absolutely unsuitable for establishing legal relations between contractors of the food industry, in particular, producers and consumers. In this case, instead of the nested indicator function at a point, its integral value is considered, for example, the consensus of experts or the probability value, if the function was represented by the probability density [17–19].
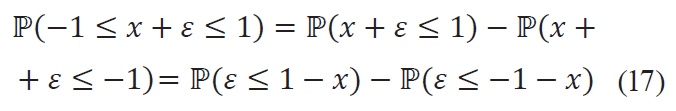
As an example, consider a criterion of a food product, which according to regulatory documents should fall into the interval [-1, 1] we consider it as a fuzzy set I) with a measuring device error of ± 0.5 The error was deliberately taken as comparable to the length of the interval for a more visual demonstration of the behavior of the indicator function at the boundary.
Suppose that the measurement error ε ∼ N(0, σ2) is a normally distributed random variable with zero expectation and dispersion, whose value can be determined from the instrument error. If we assume that 95.6% (which corresponds to the probability of a normally distributed random variable falling within the range ± 2σ relative to the mean value) of measurements of x fall within the range x ± 0.5 (the assumption can be strengthened or weakened depending on the conditions and the nature of the error), it means that:
![]()
To construct the indicator function of the criterion, let us ask: “what probability does the product satisfy the criterion with if its measurement showed the result of?”. Obviously, a second order fuzzy set emerges: for each x there is an error probability density that can serve (after some manipulations) as a nested indicator function. As previously stated, it is more convenient to assume the integral value as the value at the point, that is, from a probabilistic point of view, to calculate the conditional probability ℙ(xr ∈ I | x), where xr = x + ε is the real value of the indicator. In this case, χI(x) is the possible real value x + ε on the interval [-1, 1] probability density integral (i.e., the probability of x + ε falling into the specified interval):
The last expression is nothing but the difference between the distribution functions Φε(•) of the random variable ε. The formula is:
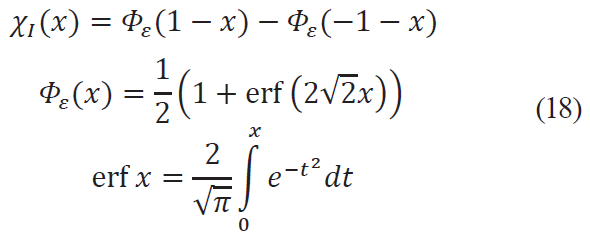
erf x the error function, included for convenience of calculations in many packages of mathematical data processing, in particular, MS Excel.
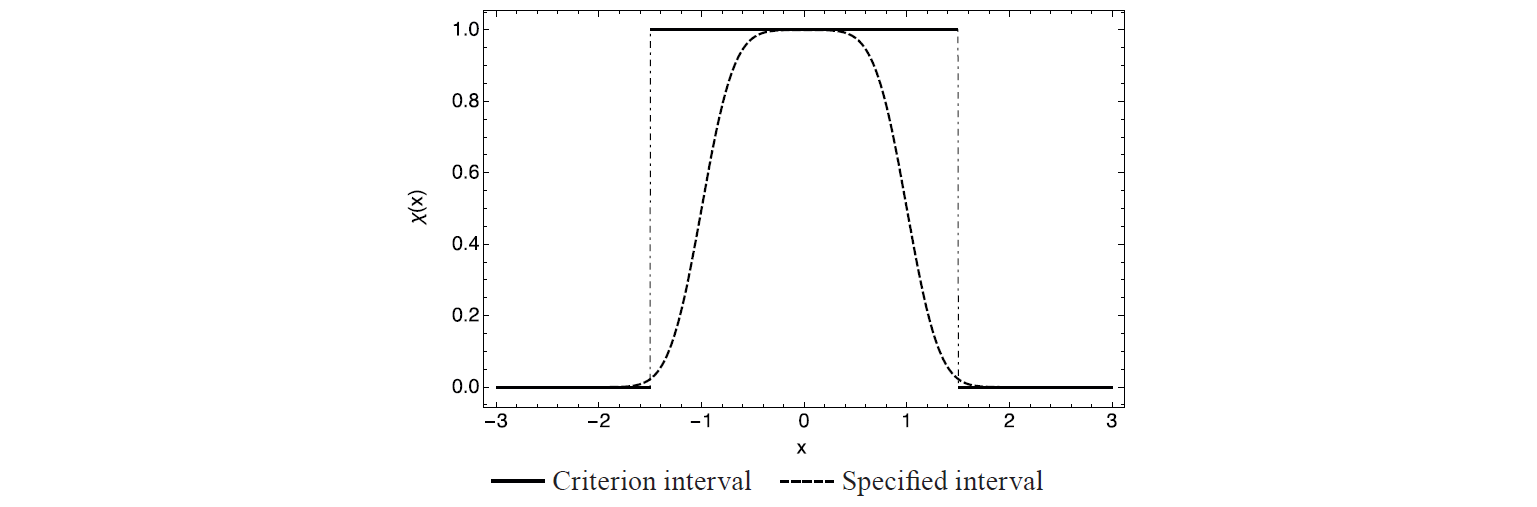
In the classical approach to identification, any measurement that falls within the interval [–1, 1] ± 0.5 will be recognized as corresponding to the criterion (to simplify the example, the questions of additional and outlier measurements are omitted here), while already at the values –1 and 1 the level of belonging to the criterion in the fuzzy approach will be equal to only 0.5 (Fig. 5), and when approaching the boundaries of a large interval –1.5 and 1.5, there is no chance for the criterion. Moreover, to provide the characteristic “most likely the product has a criterion” (function value 0.8), the measurement value must fall within the range [–0.79, 0.79].
This approach should be taken into account specifically at the boundaries of the interval identification. For example, when establishing a boundary for foods of mixed composition with milk fat content the following definition is proposed: if milk fat content exceeds 51% of the total fat phase, the product is called milk-based. If it makes less than 50% – milk-containing, respectively, with a measurement error of ± 0.5%. In this case, products containing milk fat in the range of [50.25%, 50.75%] will not belong to any specified class with a sufficiently high level of confidence.
Despite measurement errors, the boundary of identification classes should be set without taking them into account. Regardless of the nature (except for the assumption of distribution symmetry) and the type of error at the point of the boundary, the indicator function of both classes will be equal to 0.5. This is a logical assumption to refer the product to a particular class if the measurement gave a boundary indicator. In the above example, this boundary will be the point 50%.
However, if indicator functions of two identification classes, being adjacent linguistic characteristics of the same criterion, take the same value of 0.5 at a point, it makes sense setting a boundary between these classes at this point. For the multidimensional case, the boundary will be represented by a hyperplane, but in practice the dimension exceeding two is rarely considered.
Harrington’s function as an example of indicator function. One of the applied tools in the qualitative assessment of the developed food industry identification methods is Harrington’s desirability function [20].
The idea of Harrington’s function is to transform the values of the criteria into a dimensionless desirability scale that allows comparing and combining the characteristics of products of different nature. It establishes compliance between experts’ psycholinguistic assessments and natural indicators of criteria. In addition, it has all the necessary practical properties of the indicator function, which allows using it actively in fuzzy logic applications.
Generally, Harrington’s function is of the form of:
![]()
where Y(x) is a function that establishes a relation between the values of the experimental variable and the dimensionless scale [21]. In practice, it is almost always linear, being accountable for the shift and steepness of Harrington’s function curve in accordance with application needs. It is so as to correspond to the well-established mapping of the function value intervals to the linguistic variable of desirability: “very good” – 0.8, 1; “good” – 0.63, 0.8; “satisfactory” – 0.37, 0.63; “bad” – 0.2, 0.37; “very bad” – 0, 0.37.
If there are n criteria with corresponding desirability functions di(x), the consolidated estimate is expressed as a weighted geometric mean:
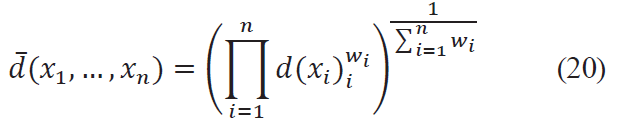
The useful property of the function is insensitivity within the range of 0 to 1 values (estimates “very bad” and “very good”, respectively). It can be used in the construction of criteria linked to the product’s shelf life.
In food products ‒ complex biological systems ‒ quality deterioration is often subject to the exponential law, and one of the key factors is the change in microbiological parameters. So, Harrington’s function can be considered as χQ(t) indicator function of Q fuzzy set – i.e., the products corresponding to public health regulations. Here storage time t > 0 is used as a product characteristic.
Supposing a product has 4 days’ shelf-life. Let us first consider its validity indicator function without the use of fuzzy logic (Fig. 6).
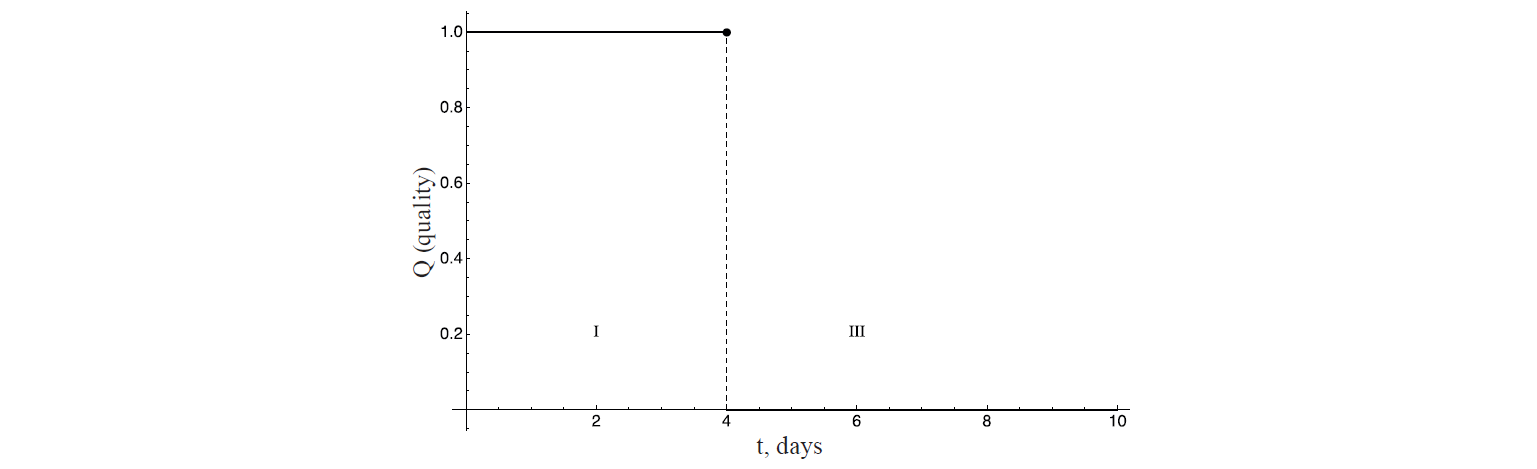
Identification areas I “the product meets the standards and is ready for consumption” and III “the product must be disposed of” are shown, respectively. Within strict logic, at point {4}, it is expected that the function has a gap of the first kind. As an applicable rule, the function reflects rather Cinderella’s carriage qualitative characteristics before and after midnight than those of the actual food product.
Since shelf life usually has a margin of 20–25%, consider the following indicator function:
![]()
The function is a fuzzy negation of Harrington’s function, but this is natural when smaller values are assumed to have a larger desirability value. Its graph is shown in Fig. 7.
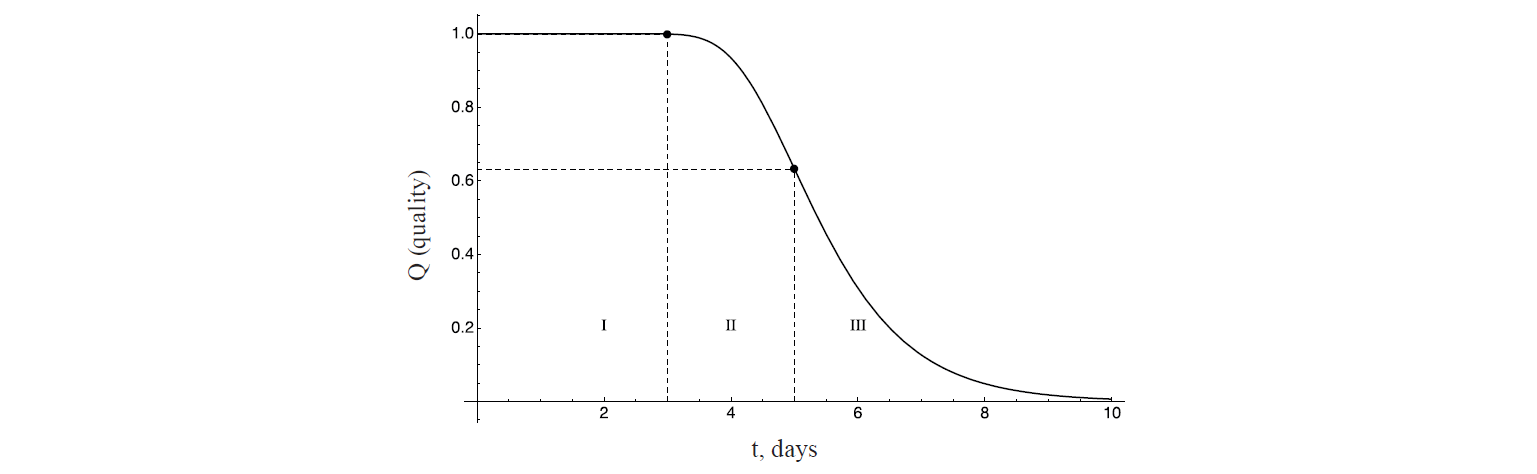
In addition to the identification areas I and III, whose linguistic characteristics remain the same, there appears area II – “the product is safe for use, but already undergoing degrading qualitative changes”. In this sense, products from identification area II are no longer suitable for end-users and must be sent for extending shelf life processing (sterilization, canning, etc.). At the same time, it should be noted that, for example, when canning, a fuzzy logic device must also be used to establish the final shelf life of the product from raw materials within the boundaries of identification area II.
As it was mentioned above, changes in microbiological parameters have a direct impact on the quality of the product. Logically the phases of microbiological cultures’ development can be compared with Harrington’s function identification areas; in particular, area I corresponds to the lag phase, area II – to acceleration and exponential growth of microorganisms phase, and area III – to deceleration and stationarity phase. At the same time, substrate and other biotechnological characteristics of change in the population of microorganisms are calculated for each specific product, which may lead to diversities in the general matches given.
Combination of the product’s quality characteristics. The construction of indicator functions is inextricably linked with decision-making systems. In the case of one criterion (for example, safety, as described above), the fuzzy logic apparatus gives no clear advantage over a strict approach. In the end, all the contractors of the food industry (consumers, manufacturers, law enforcement agencies, etc.) make a binary decision whether a particular product sample complies with a criterion [22, 23]. Due to the fact that the criterion is unique (for example, expiration date) they identify the above decision with the function of the ultimate goal (“buying” vs. “not buying”, “recalling” vs. “not recalling”, “fining” vs. “not fining”).
In the example with the fety function, three clear identification areas can be introduced. For them, for instance, the seller will have a system of specific actions (I – “selling”, II – “reselling for recycling”, III – “recycling”).
However, even when the second criterion in the decision-making system is engaged, it is much harder to establish the precise boundaries of identification classes.
Consider the instance with the safety criterion with an additional indicator “consumer quality” – a characteristic that demonstrates the taste and overall satisfaction from the consumption of the product – added. In the fuzzy logic the unction of this indicator decreases faster than the safety function. For example, for baking and confectionery products, taste profiles degrade much earlier than the products become unfit for use. The taste of “fresh bread” is of great value to the consumer and has its impact on their purchase preferences, but it is not unique or decisive, as shelf life is also taken into account.
To construct an example of the consumer quality function χT(t), let us use the probability theory apparatus, assuming that fresh (t = 0) product has some taste profile lost on expiry [24]. In practice, it makes sense to put an experiment to determine the distribution histogram of the moment of fresh taste degradation. However, for the purposes of exemplification, it will be simulated with the help of Weibull distribution, used in survival analysis, giving a good approximation in the study of products’ storage stability [25]. The density of this distribution fW(k,λ)(t) has the form:
![]()
As a quality function we take the survival function SW(k,λ)(t) for the given distribution. It is equal to the probability that the value of the random variable under study will exceed t, in this case, the probability that the taste has not yet been lost by t. For the Weibull distribution, it has a convenient expression:
![]()
Supposing that for a product with the safety function described by formula (23) the average taste profile is lost on the second day, an approximation of distribution parameters with λ = 2, k = 2 can be derived.
The problem of food products’ seller is to establish the time when the product should already be sold at the residual price (the time of entering area III) taking into account the safety and consumer quality criteria.
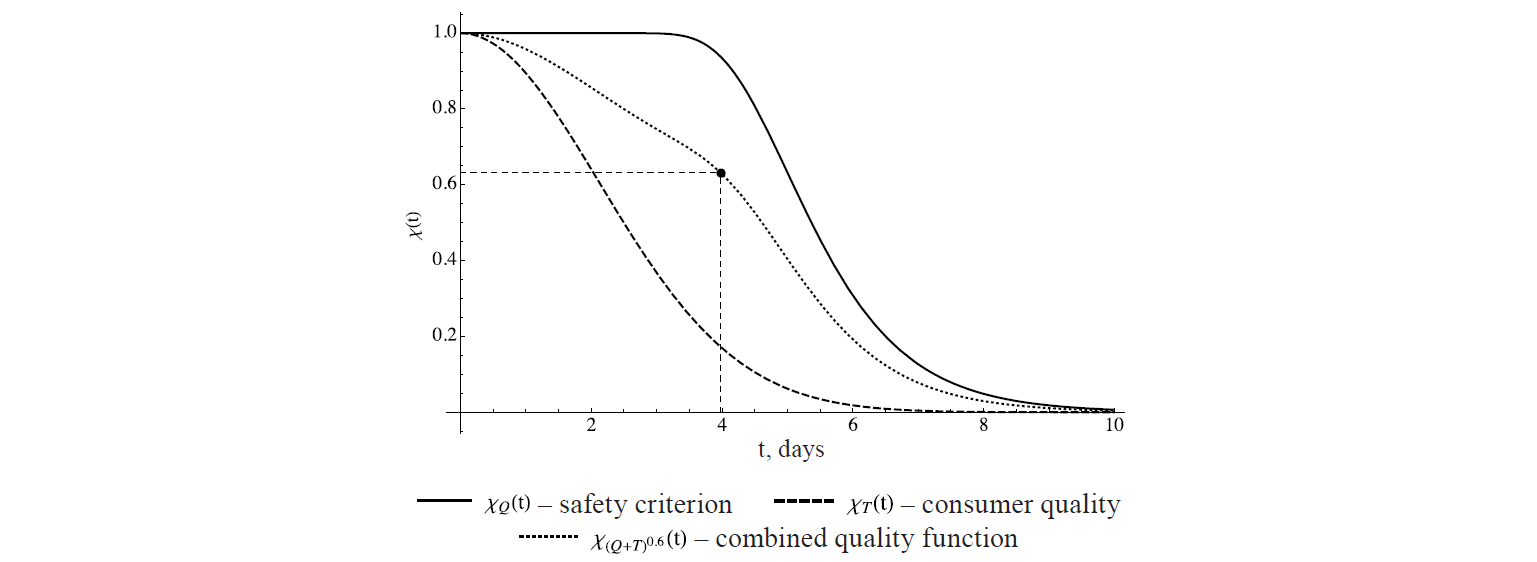
If the weight of safety indicator is set at 0.6, and the weight of consumer quality indicator is set at 0.4, respectively, a convex criteria combination (8) will take the form:
![]()
Solving the equation (0.63 being Harrington’s function upper exponent for “satisfactory”):
![]()
we obtain t ≅ 4. This means that after four days the product must be sold in traditional or alternative ways. Guided by rate expiry date only, the seller would get the value of 5, thus having no time left for operational maneuvers. The type of function graphs and their convex combination is shown in Fig. 8.
ВЫВОДЫ
Thus, the apparatus of fuzzy logic allows building multi-criteria decision-making systems in the food industry. They help effectively make decisions about products’ quality and safety and, in the case of violations and arbitral bodies’ involvement, differentiate the administrative impact on the contractors of the food industry.
КОНФЛИКТ ИНТЕРЕСОВ
The authors declare that there is no conflict of interest related to this article.
СПИСОК ЛИТЕРАТУРЫ
- Khurshudyan SA. Consumer and Food Quality. Food Industry. 2014;(5):16–18. (In Russ.)
- Gupta RK, Minhas D, Minhas S. Food safety in the 21st century: Public health perspective. Academic Press; 2016. 624 p. DOI: https://doi.org/10.1016/C2014-0-01094-5.
- Oganesyants LA, Khurshudyan SA, Galstyan AG, Semipyatnyi VK, Ryabova AE, Vafin RR, et al. Base matrices – invariant digital identifiers of food products. News of the Academy of Sciences of the Republic Kazakhstan. Series of Geology and Technical Sciences. 2018;6(432):6–15. DOI: https://doi.org/10.32014/2018.2518-170X.30.
- Ehrl M, Ehrl R. Primery razrabotki pishchevykh produktov. Analiz keysov [Examples of food development. Case Analysis]. St. Petersburg: Professiya; 2010. 464 p. (In Russ.).
- Filzmoser P, Todorov V. Review of robust multivariate statistical methods in high dimension. Analytica Chimica Acta. 2011;705(1–2):2–14. DOI: https://doi.org/10.1016/j.aca.2011.03.055.
- Aung MM, Chang YS. Traceability in a food supply chain: Safety and quality perspectives. Food Control. 2014;39(1):172–184. DOI: https://doi.org/10.1016/j.foodcont.2013.11.007.
- Oganesyants LA, Vafin RR, Galstyan AG, Semipyatniy VK, Khurshudyan SA, Ryabova AE. Prospects for DNA authentication in wine production monitoring. Foods and Raw Materials. 2018;6(2):438–448. DOI: https://doi.org/10.21603/2308-4057-2018-2-438-448.
- Schiano AN, Harwood WS, Drake MA. A 100-year review: Sensory analysis of milk. Journal of Dairy Science. 2017;100(12):9966–9986. DOI: https://doi.org/10.3168/jds.2017-13031.
- Zadeh LA. Fuzzy sets. Information and Control. 1965;8(3):338–353. DOI: https://doi.org/10.1016/s0019-9958(65)90241-x.
- Alghannam ARO. Design of a simple fuzzy logic control for food processing. In: Eissa AHA, editor. Trends in vital food and control engineering. InTech; 2012. pp. 99–114. DOI: https://doi.org/10.5772/39086.
- Eerikäinen T, Linko T, Linko S, Siimes T, Zhu Y-H. Fuzzy logic and neural network applications in food science and technology. Trends in Food Science and Technology. 1993;4(8):237–242. DOI: https://doi.org/10.1016/0924-2244(93)90137-Y.
- Podrzaj P, Jenko M. A fuzzy logic-controlled thermal process for simultaneous pasteurization and cooking of softboiled eggs. Chemometrics and Intelligent Laboratory Systems. 2010;102(1):1–7. DOI: https://doi.org/10.1016/j.chemolab.2009.12.002.
- Birle S, Hussein MA, Becker T. Fuzzy logic control and soft sensing applications in food and beverage processes. Food Control. 2013;29(1):254–269. DOI: https://doi.org/10.1016/j.foodcont.2012.06.011.
- Perrot N, Baudrit C. Intelligent quality control systems in food processing based on fuzzy logic. In: Caldwell DG, editor. Robotics and automation in the food industry. Current and future technologies. Cambridge: Woodhead Publishing Ltd.; 2013. pp. 200–225. DOI: https://doi.org/10.1533/9780857095763.1.200.
- Dórea JRR, Rosa GJM, Weld KA, Armentano LE. Mining data from milk infrared spectroscopy to improve feed intake predictions in lactating dairy cows. Journal of Dairy Science. 2018;101(7):5878–5889. DOI: https://doi.org/10.3168/jds.2017-13997.
- Aryana KJ, Olson DW. A 100-year review: Yogurt and other cultured dairy products. Journal of Dairy Science. 2017;100(12):9987–10013. DOI: https://doi.org/10.3168/jds.2017-12981.
- Kramer E, Cavero D, Stamer E, Krieter J. Mastitis and lameness detection in dairy cows by application of fuzzy logic. Livestock Science. 2009;125(1):92–96. DOI: https://doi.org/10.1016/j.livsci.2009.02.020.
- Albelwi S, Mahmood AA. Framework for designing the architectures of deep convolutional neural networks. Entropy. 2017;19(6). DOI: https://doi.org/10.3390/e19060242.
- Osman T, Mahjabeen M, Psyche SS, Urmi AI, Ferdous JMS, Rahman RM. Application of fuzzy logic for adaptive food recommendation. International Journal of Fuzzy System Applications. 2017;6(2):110–133. DOI: https://doi.org/10.4018/IJFSA.2017040106.
- Montet D, Ray RC. Food traceability and authenticity: Analytical techniques. Boca Raton: CRC Press; 2017. 354 p. DOI: https://doi.org/10.1201/9781351228435.
- Magomedov GO, Zhuravlev AA, Sheviakova TA, Sedykh DV. Use of function of Harrington for optimization of prescription structure bars like a praline. Proceedings of the Voronezh State University of Engineering Technologies. 2014;60(22):99–103. (In Russ.).
- Abdul Kadir MK, Hines EL, Qaddoum K, Collier R, Dowler E, Grant W, et al. Food security risk level assessment: A fuzzy logic based approach. Applied Artificial Intelligence. 2013;27(1):50–61. DOI: http://doi.org/10.1080/08839514.2013.747372.
- Jensen DB, Hogeveen H, De Vries A. Bayesian integration of sensor information and a multivariate dynamic linear model for prediction of dairy cow mastitis. Journal of Dairy Science. 2016;99(9):7344–7361. DOI: http://doi.org/10.3168/jds.2015-10060.
- Yu P, Low MY, Zhou W. Design of experiments and regression modelling in food flavour and sensory analysis: A review. Trends in Food Science and Technology. 2018;71:202–215. DOI: https://doi.org/10.1016/j.tifs.2017.11.013.
- Valero A, Carrasco E, Garcia-Gimeno RM. Principles and methodologies for the determination of shelf-life in foods. In: Eissa AHA, editor. Trends in vital food and control engineering. InTech; 2012. pp. 3–42. DOI: https://doi.org/10.5772/35353.
