

Abstract
The increasing production volumes of soy foods require new express methods for testing soybeans during processing and presowing. This study assessed the efficiency of spectral pre-sowing assessment methods using Vilana soybeans.The research featured soybeans of the Vilana cultivar. The control sample consisted of untreated whole soybeans while the test samples included soybeans pretreated with various modifiers. The methods involved spectrofluorimetry and IR-Fourier spectrometry.
A wide emission band at 400–550 nm corresponded to the fluorescence of the soybean testa. The band at 560–610 nm indicated the presence of such modifiers as Imidor insecticide and Deposit fungicide. The luminescence spectrum of the untreated soybean testa was maximal at 441 nm. The luminescence spectrum of the treated soybean samples was maximal at 446.5 and 585 nm when the excitation wavelength was 362 nm. The fluorescence was studied both spectrally and kinetically to establish the maximal luminescence time and the typical vibration frequencies.
The spectral studies of Vilana soybeans before and after treatment revealed which modifiers were adsorbed on the palisade epidermis and defined the type of interaction between the modifier and the soybean. The spectrofluorimetry and IR spectroscopy proved able to provide a reliable qualitative and quantitative analysis of Vilana soybean surface.
Keywords
Soybeans, Vilana variety, fluorescence, spectroscopy, kinetics, adsorption, chromophore groups, phytochromes, cryptochromes, photoreceptorsINTRODUCTION
Soy is a unique agricultural crop because its beans are extremely rich in native proteins and saturated fats. In fact, soybeans are superior to cereals, oilseeds, and legumes in terms of protein content and essential amino acids [1–4]. The food industry highly appreciates their plasticity, high enzymatic activity, therapeutic effect, and prophylactic properties.
According to the Oil World, 2021/22 saw an increase in the global soybean production. The Food and Agriculture Organization of the United Nations even developed the Soybean Information and Research Act (http://www.fao.org/3/bs958e/bs958e.pdf). This document provides quality indicators for national soybean production. It also introduces a research program that aims at increasing production volumes, expanding domestic and foreign soybean markets, and popularizing soy products in the human diet.
New high-tech soybean production processes require new research methods. Pre-sowing treatment needs special control since it affects the yield. Other important methods include risk assessment and pre-calculation of maximal amounts of pesticide residue in soybean products [5].
Seeds maintain the viability of the embryo and preserve nutrients. However, the embryo protection is not the only function of the seed coat: it also affects seed germination. In soybeans, the testa and hilum are covered with two layers of palisade epidermis and wax. Agricultural soybean varieties have a thick palisade layer. Apparently, the chemical composition, location, and size of palisade cells delay swelling. The soybean testa contains 6.0% of protein, 2.7% fat, 34.3% fiber, 32.3% nitrogen-free extractives, and 10.6% ash. Soybeans include 13.0–21.7% of oils and 36.0–45.0% of protein. The activity of their trypsin inhibitors is 22.4 mg/g while the moisture content is 6.9–8.0% [6].
Soybean testa consists of metamorphosed integuments which form a narrow canal called micropyle. The part of the ovule opposite the micropyle is called the chalase. The chalazal part is responsible for tissue cells, or hypostasis, and their membranes are highly reflective. Flavones and flavonols absorb light in a shorter wavelength spectrum (280–320 nm) than anthocyanins. As a result, flavones and flavonols protect plant tissues, especially epidermis, from ultraviolet radiation. Phytochromes, cryptochromes, and phototropins are the most important photoreceptors of all the photomorphogenesis pigments because they absorb red and blue light. Cryptochromes and phototropins are blue light receptors. Cryptochromes consist of apoprotein and two chromophores, namely, pterin and flavin. Apoprotein has a high degree of homology with photolyase enzymes involved in the light-dependent DNA repair. The absorption spectrum of cryptochromes is ultraviolet (320–390 nm) and blue (390–500 nm), partially including green. The absorption region depends on the pterin chromophore functional group [7, 8].
Optical methods provide the most effective ways to control seeds and predict the optimal harvest time [9–11]. Luminescence and IR spectroscopy are environmentally friendly, non-destructive, remote, and fast. They are known for their high-precision and a wide variety of sampling options.
Photoluminescent devices that provide express diagnostics of ripeness, humidity, and germination are accurate and employ photodiodes or LEDs, depending on the test objective [12, 13]. Zelentsov et al. developed calibration models for MATRIX IR analyzers to monitor protein, oil, moisture, and trypsin inhibitor activity in laboratory soybeans [6]. The models gave satisfactory results and saved valuable selection material. To expand the spectrofluorimetric and IR-Fourier spectroscopic methods of seed control, scientists need new calibration models for different soybean varieties, as well as tailored equipment.
Agriculturists determine the pre-sowing seed quality and plan their chemical treatment by comparing the spectral profile of the seed testa of untreated and treated soybeans.
The research objective was to use spectral analysis, i.e., luminescence and IR spectroscopy, to assess the quality of Vilana soybean pre-sowing treatment.
The research involved the following tasks:
– determining the quality of pre-sowing treatment of Vilana soybeans with various modifiers;
– identifying the functional groups of modifiers on the palisade epidermis;
– studying the spectral profiles of untreated and experimental soybeans; and
– developing recommendations for spectral calibration models to assess soybean quality indicators and increase the yield.
STUDY OBJECTS AND METHODS
The soybeans of the Vilana cultivar were provided by the soybean department of the V.S. Pustovoit All-Russian Research Institute of Oilseeds (Krasnodar, Russia). This mid-season variety is highly productive and stressresistant; it contains 40.8% of protein. Its yield is 2.5– 3.0 tons/ha, which can reach 4.9–5.7 tons/ha if the moisture level is optimal. The plant has some gray floccose, the corolla of the flower is purple, and the bean folds are brown. The testa is yellow and dull, with no pigmentation. The hilum is medium, oval-elongated, and light brown [11].
For protection purposes, soybeans are treated with various chemical compounds before planting [14, 15]. We treated the Vilana soybeans with a mix of chemical and biological substances. It included insecticide Imidor, fungicide Deposit, fertilizer Rhizoform, and sticking agent Static. The procedure followed the one described in [16, 17]. Imidor is imidacloprid [4,5-dihydro-N-nitro-1-[(6-chloro-3-pyridyl)-methyl]-imidazolidin-2-yleneamine] with neonicotinoid as the chemical active substance [18]. Deposit is a microemulsion that consists of 40 g/dm3 of fludioxonil [4-(2,2-difluoro-1,3-benzodioxol-4-yl)-pyrrole-3-carboxylic acid], 40 g/dm3 of [(±)-1-(β-allyloxy-2,4-dichlorophenylethyl)imidazole], and 30 g/dm3 of metalaxyl [methyl N-(methoxyacetyl)-N-(2,6-xylyl)-DL-alaninate]. Rhizoform is a liquid inoculant of Bradyrhizobium japonicum (2–3×10⁹ CFU/cm3). Rhizoform (https://betaren.ru/catalog/spetsialnye-udobreniya/mikro- biologicheskie-preparaty/rizoform-soya) always goes with Static, a stabilizer and sticking agent, which ensures the safety of viable bacteria on the surface of beans for up to 21 days. Static is a preservative that contains 0.5% of carbohydrates, 0.1% salts, and 100 cm3 water at pH 6.5–7.4.
To identify the spectral changes, we studied the luminescence parameters of the soybean testa in the untreated (control) samples and the experimental samples treated with separate modifiers and their mixes. Spectrofluorimetry involved the PanoramaPro software at 380–690 nm and copied the method described by Belyakov in [19], which was developed for a Fluorat-02-panorama spectrofluorimeter (Lumex-Marketing, Russia).
We interpreted the spectral bands of separate chemicals and their mixes to identify the vibration bands of each group on the surface of the biological object treated with a chemical mix. To reveal the vibration bands of water, protein, starch, and fat, we studied the spectra of ground soybeans and the surface of untreated soybeans. Grinding and the IR spectroscopy were in line with State Standard R 53600-2009. The spectral studies followed the recommendations developed by the Agilent Food Testing & Agriculture LinkedIn in the spectral range between 350 and 7000 cm–1 using an Agilent Cary 630 FTIR spectrometer (Agilent Technologies, USA) [10].RESULTS AND DISCUSSION
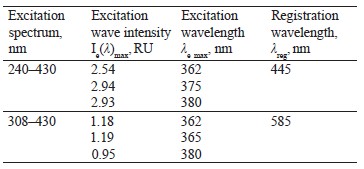
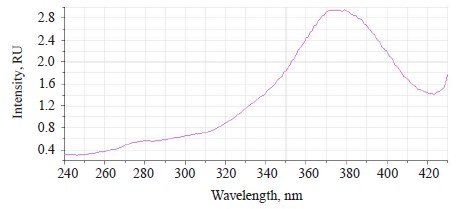
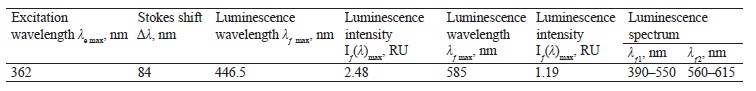
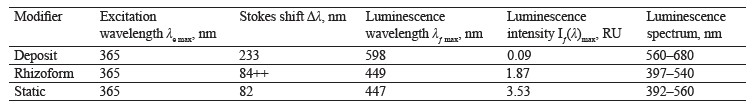
Spectrofluorimetry of soybeans. To register luminescence, we studied the spectral characteristics of luminescence excitation for a wide spectral range (Table 1, Figs. 1 and 2). Table 1 describes the excitation spectrum.
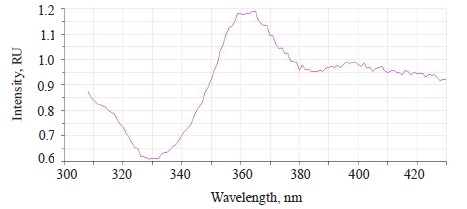
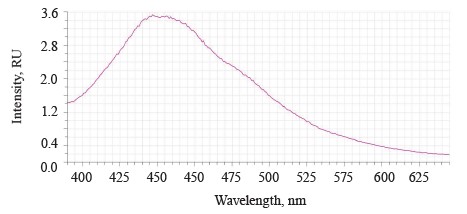
When the excitation length λе was 362 nm, the luminescence spectra of the untreated (control) soybean testa demonstrated a typical wide luminescence band at 400–550 nm, which corresponded to the fluorescence of the soybean testa.
Table 2 shows the spectrum of the untreated soybeans.
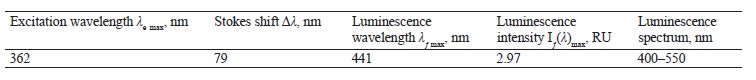
In addition to the main maximum of the luminescence band at λƒ max 441 nm and intensity Іƒ(λ)max 2.97 RU, the research revealed a minor shoulder at ~ 510 nm (Fig. 3).
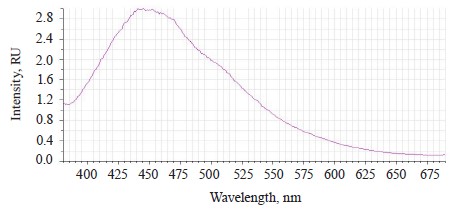
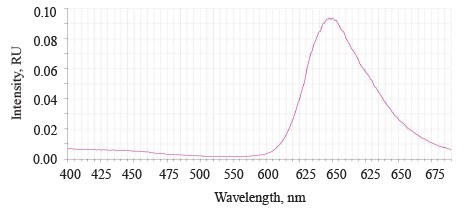
The luminescence spectra of the whole soybean testa treated with a mix of modifiers (Fig. 4) also showed a typical wide luminescence band at 400–550 nm, which corresponded to the fluorescence of the soybean testa with a maximum λƒ1 max 446.5 nm and intensity Іƒ(λ)1 max 2.48 RU. A second luminescence band of lower intensity appeared at 557–610 nm with a maximum at λƒ2 max 585 nm and Іƒ(λ)2 max 1.19 RU, which matched the fluorescence of one adsorbed modifier.
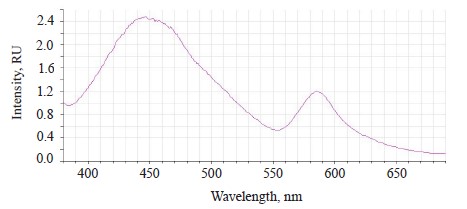
The treated (experimental) seeds showed the following spectral changes: a 5-nm Stokes shift, a 5-nm bathochromic shift of the main peak, and a lower intensity of the main fluorescence peak. In addition, the shoulder at the main maximum disappeared at 510 nm, and a luminescence band of lower intensity appeared in the long-wavelength part of the spectrum (Table 3).
To reveal the luminescence of the modifiers, we treated the soybeans with each component of the mix separately, in line with the procedure described in [17] (Tables 4 and 5).
Figures 5–8 show the luminescence spectra of the treated soybean samples.
The luminescence spectrum of the soybeans treated with Imidor showed two bands of different intensity (Fig. 5).
The first main band at 390–530 nm had a maximum at λƒ1 max 445 nm, which corresponded to the luminescence of the testa. Relative to the mix-treated sample, the intensity of the main band decreased by 0.512 RU, the hypsochromic shift was 1.5 nm, and the Stokes shift reduced by 4 nm (Table 4).
The second band at 560–620 nm had a maximum at λƒ2 max 585 nm, which corresponded to the Imidor luminescence. The maximum value of the second spectral band of the soybeans treated with a mix of modifiers coincided with that of the sample treated with Imidor.
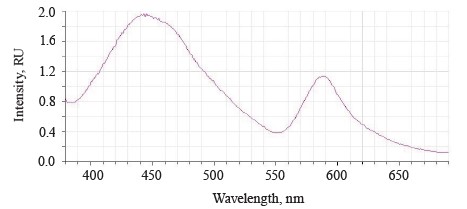
The luminescence spectrum of the sample treated with Deposit showed a band of low intensity at 520– 640 nm with a maximum of λƒ max 598 nm, which corresponded to the luminescence of Deposit (Fig. 6).
The Deposit treatment suppressed the luminescence of the testa at 390–550 nm. This result depended on the preparative form of the soybeans, which were ground to particles of 0.1–5 µm, and the composition of Deposit (https://betaren.ru/upload/medialibrary/d83/Depozit_-ME_compressed.pdf). Deposit has a complex structure, and the substituent groups of the benzene ring bend the plane of the molecules, thus reducing their luminescent ability.
The absence of testa luminescence means that this microemulsion indeed protected the soybeans from ultraviolet radiation.
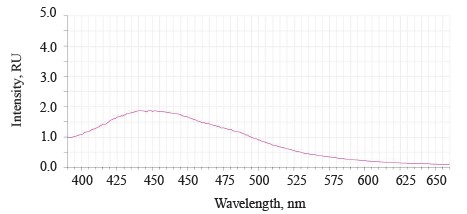
The luminescence spectrum of soybeans treated with Rhizoform had a band at 400–550 nm with a maximum at 449 nm, which corresponded to the luminescence of Rhizoform (Fig. 7). Relative to the mix-treated sample, the changes were as follows. The intensity of the main band reduced by 0.61 RU; the bathochromic peak shift was λ 2.5 nm; and the Stokes shift Δλ did not ƒ max change.
The spectrum of soybeans treated with Static had a band at 392–560 nm with a maximum at λƒ max 447 nm, which corresponded to the luminescence of the sticking agent. Relative to the mix-treated sample, the intensity of the main band increased by 1.05 RU; the bathochromic shift of the maximum increased by 0.5 nm; and the long-wavelength shoulder of the main band became more obvious.
Luminescence at 392–560 nm depended on Rhizoform and Static, while luminescence at 560–690 nm depended on Deposit and Imidor (Table 5). The luminescence spectrum of the treated soybeans coincided with the spectrum of Rhizoform and Static (Figs. 7 and 8).
The luminescence of Imidor at 560–620 nm overlapped the low-intensity luminescence of Deposit at 570–640 nm (Figs. 5 and 6). The pyridine ring of the neonicotinoids in Imidor used the methylene bridge to bind to the terminal electron-donating group of imine or ethene during the treatment.
The soybeans treated with a mix of modifiers had the second band at 560–615 nm that matched the luminescence of Imidor.
The untreated sample peaked at λƒ max 441 nm and Іƒ(λ) max 2.97 RU, Δλ 79 nm. The treated samples had two peaks: λƒ1 max 446.50 nm at Іƒ(λ)1 max 2.48 RU, Δλ 84 nm, and λƒ2 max 585 nm at Іƒ(λ)2 max 1.19 RU. Since cryptochromes had ultraviolet absorption spectrum (320390 nm), the chromophore molecules at their basis were the luminescence centers of the soybean testa [12, 13].
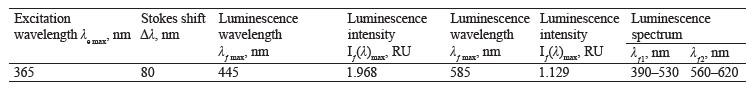
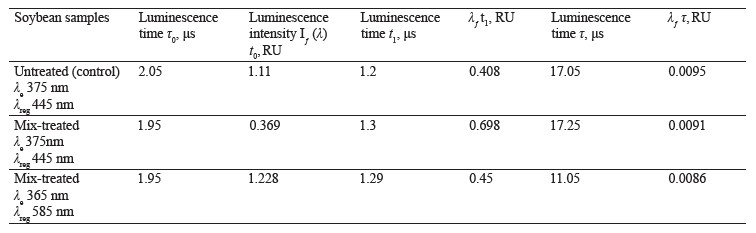
Figure 9 illustrates the luminescence kinetics in the PanoramaPro software. The luminescence decay kinetics was analyzed at λe 365 and 375 nm and λregistration at 445 and 585 nm. The discreteness of the kinetic change was 0.05 μs; the measure gate was 0.10 μs; the gate delay was 0.05–30 μs; and the gate delay step was 0.10 μs (Table 6).
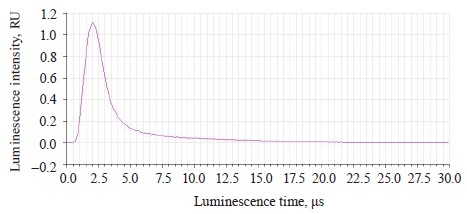
The luminescence decay parameters were expressed as the dependence of the luminescence intensity on time:

where A was the constant that depends on the nature of the substance; τ was the luminescence time, μs.
Therefore, luminescence time t1 could be calculated as follows:

where I(t0) was the maximal luminescence intensity at t0, %
In treated soybeans, the luminescence intensity Iƒ(λ) t0 reached its maximum by 0.1 μs sooner than in the untreated sample. Their luminescence time was longer by 0.09–0.1 μs. The shortest time of almost complete luminescence was λе 365 nm, and λreg 585 nm. The kinetic analysis proved that this luminescence could be classified as fluorescence.
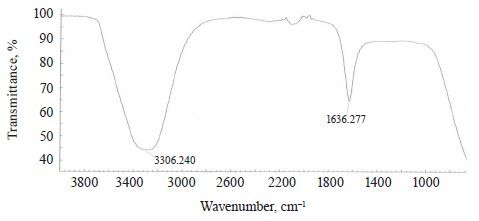
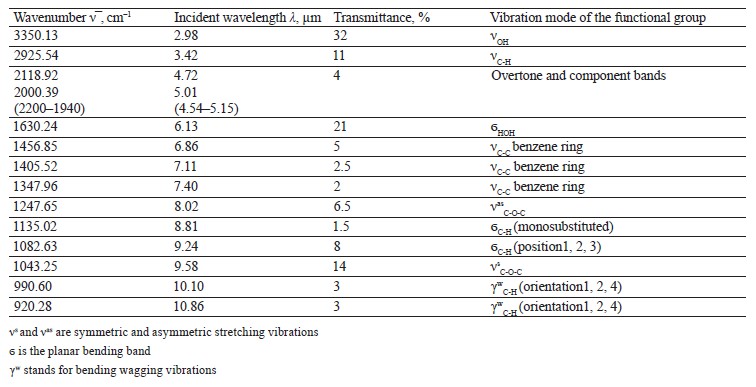
IR spectroscopic analysis. We performed a separate IR spectroscopic analysis for each modifier, i.e., Imidor (Fig. 10), Deposit (Fig. 11), and Static (Fig. 12). Each of these substances, except for Rhizoform, is a complex aromatic compound. Fig. 13 illustrates the IR spectrum of Rhizoform. The grouping followed the typical vibration frequencies (Tables 7–9).
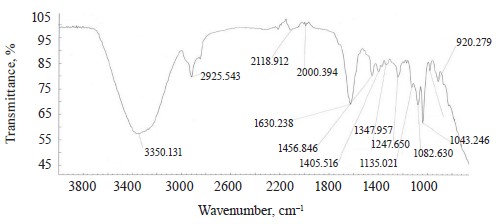
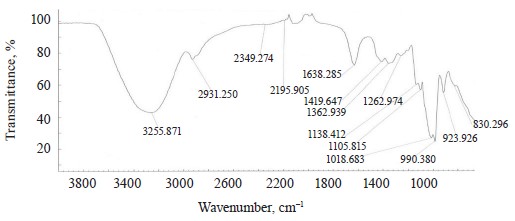
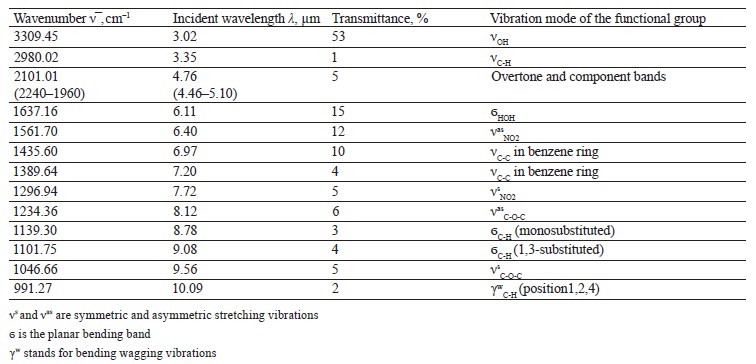
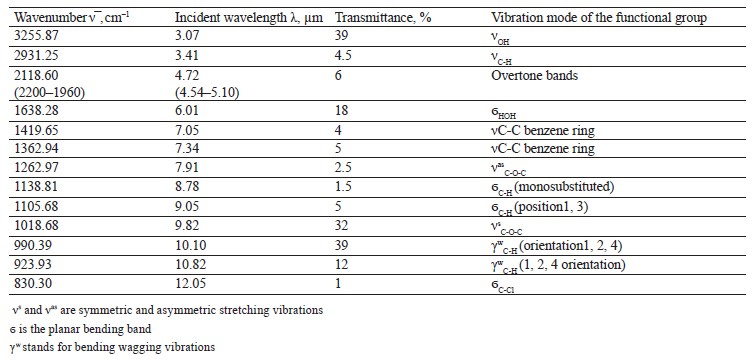
The spectra of Imidor (3309.45 cm–1), Deposit (3350.13 cm–1), and Static (3255.87 cm–1) demonstrated an intense wide band of stretching vibrations of the hydroxyl group involved in the intermolecular hydrogen bond.
The spectra showed bands of stretching vibrations of C-H methyl groups: low-intensity at 2980.02 cm–1 for Imidor; average intensity at 2925.54 cm–1 for Deposit, and average intensity at 2931.25 cm–1 for Static [5].
The stretching vibrations of the C-C bonds in the benzene ring resulted in two bands of average intensity at 1435.6 and 1389.64 cm–1 for Imidor, 1456.85, 1405.52, and 1347.96 cm–1 for Deposit, and 1419.65 and 1362.94 cm–1 for Static [20].
The Imidor IR spectrum revealed stretching vibrations of the nitro group. As a result of the coupling, the ν of NO2 bands shifted to the low-frequency region. The νasNO2 band at 1561.7 cm–1 was more intense than the νsNO2 band at 1296.94 cm–1 [21].
The location and intensity of the stretching vibrations of the C-O bond depend on the structural features of the molecule, mainly on the double bond and aromatic nucleus. The analyzed samples revealed two νС-О-С bands. The Imidor IR spectrum had νsС-О-С at 1046.66 cm–1 and νasС-О-С at 1234.36 cm–1. The Deposit IR spectrum had νsС-О-С at 1043.25 cm–1 and νasС-О-С at 1247.65 cm–1. The Static IR spectrum showed νsС-О-С at 1018.68 cm–1 and νasС-О-С at 1262.97 cm–1.
The weak overtone bands at 2240–1940 cm–1 helped locate the substituents of the benzene ring. The bands in this region had different contours depending on the nature of the substituent [7].
The IR spectra of the samples had plane bending vibrations of C-H at 1135–1082 cm–1. In the Imidor spectrum, ϭС-Н at 1101.75 cm–1 matched positions 1, 3 of the substituents while ϭС-Н at 1139.3 cm–1
matched the monosubstitution. The out-of-plane molecular vibrations, e.g., the wagging vibrations of atoms in a molecule, had a low-intensity γС-Н
band at 991.27 cm–1 and corresponded to positions 1, 2, 4 of the substituents. In the Deposit spectrum, ϭC-H at 1082.63 cm–1
described positions 1, 2, 3 of the substituents while ϭС-Н at 1135.02 cm–1 matched the monosubstitution. The bending wagging vibrations of atoms in a molecule appeared as bands at γmax 920.28 and 990.60 cm–1, which was typical of orientations 1, 2, 4 of the substituents. The hypsochromic shift of the band γmax at 920 cm–1 indicated the conjugation of the benzene ring substituent. In the Static spectrum, the absorption frequency ϭС-Н at 1105.68 cm–1 also corresponded to the meta position of the substituents while ϭС-Н at 1138.81 cm–1 matched the monosubstitution. The γС-Н bands at 990.39 and 923.93 cm–1 indicated positions 1, 2, 4 of the substituents. The spectrum contained a low-intensity bending band of C-Cl at 830.3 cm–1.
In the IR spectra, the overtone bands at 2240– 1960 cm–1 signified the main vibrations, namely νsС-О-С and plane ϭС-Н with positions 1, 2, 3 and 1, 3 of substituents [22].
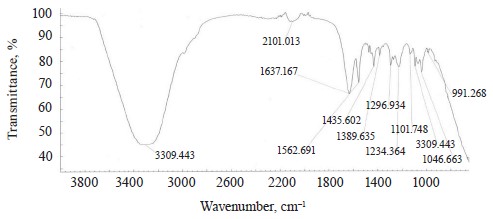
The Rhizoform IR spectrum showed νОН at 3306.24 cm–1, bending vibrations of water molecules ϭН2О at 2080 cm–1, and bending vibrations of the HOH stretch angle at 1636.28 cm–1 (Fig. 13).
The spectra of Imidor, Deposit, and Static also demonstrated bending vibrations of the HOH stretch angle at 1637.16, 1630.24, and 1638.28 cm–1, respectively. They allegedly indicated that the constancy of bending vibrations was caused by the intermolecular interaction: the bond angle of the water molecule changed as a result of the molecular interaction with each other, as well as with cations and anions [21].
To interpret the spectra of the biological sample treated with chemicals, we performed IR spectroscopy of the ground and whole samples (Fig. 13 and Table 10). The vibration frequencies indicated moisture, protein, fat, ash, carbohydrates, and hardness [23, 24].
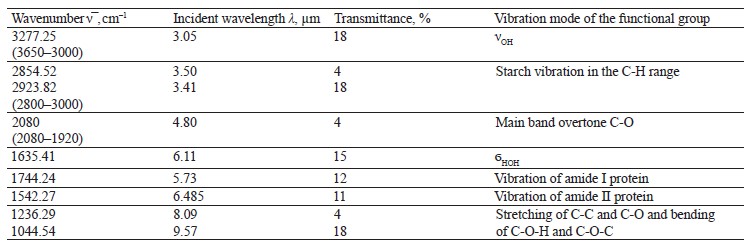
The IR spectrum of ground soybeans (Fig. 14) had stretching vibrations of OH groups at 3277.25 cm–1 and bending vibrations of the HOH stretch angle at 1635.41 cm–1.
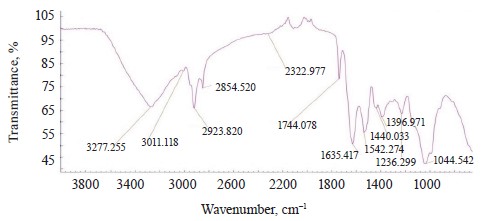
The vibration frequencies typical of amides I and II appeared at 1542.27 and 1744.24 cm–1. The data differed from those reported by Migues et al.: our experiment revealed a bathochromic shift of 40 cm–1 and a hypsochromic shift of 8 cm–1, respectively [7].
Vibrations typical of fats based on the C-H bond were observed at 1600–1750 and 1550–1570 cm–1. The maxima of typical starch bands (2854.52 and 2923.82 cm–1) were observed at 2800–3000 cm–1 in the C-H vibration region (Table 10). The strong absorption at 1200– 900 cm–1 depended on the C-C and C-O stretching and the C-O-H and C-O-C bending [10].
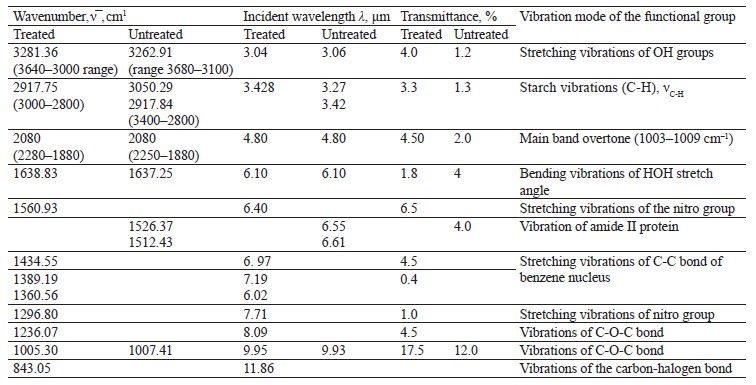
The IR spectra of whole untreated (Fig. 15) and treated soybeans (Fig. 16) demonstrated stretching bands of OH groups at 3262.91 and 3281.36 cm–1 and bending bands of the HOH stretch angle at 1637.25 and 1638.83 cm–1 [7, 10].
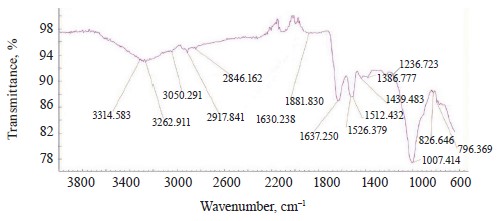
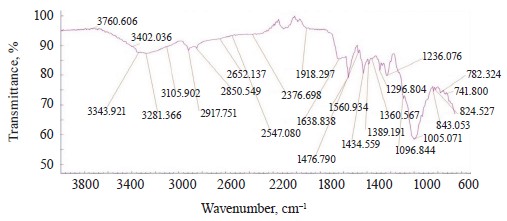
Typical protein vibrations were registered at 1600– 1700 and 1550–1570 cm–1 based on the associated amides I and II, respectively. Typical fat vibrations appeared in the same ranges, but they were based on the C-H bond. Starch vibrations were observed at 2800– 3000 cm–1 of the C-H stretch range at 2917.84 and 2917.75 cm–1. The overtones had bands at 2080 cm–1.
The vibrations typical of testa protein were observed in the spectrum of untreated soybeans at 1526.37 cm–1. An intense band appeared at 1007.41 and 1005.30 cm–1 in the range of C-O-C vibrations at 1120–840 cm–1 (Table 11).
The bands at 1550–1200 cm–1 were strong and typical. This range made it possible to identify Imidor, Deposit, and Static on the hard soybean testa. The width and shape of the bands and the magnitude of the absorption band that occurred during the aggregate changes of the adsorbents revealed the magnitude and nature of intermolecular compounds and the treatment quality [21].
We registered five overlapping band maxima when comparing the spectra of the treated soybeans with the Imidor spectra. The bands at 1560.93 and 1561.7 cm–1, as well as those at 1296.80 and 1296.94 cm–1, corresponded to the stretching vibrations of the Imidor nitro group.
The bands at 1434.55 and 1435.6 cm–1, as well as those at 1389.19 and 1389.64 cm–1, matched the stretching vibrations of the C-C bond of the Imidor aromatic system. The typical C-O-C vibrations were visible at 1236.07 and 1234.36 cm–1. The fact that the maxima of the absorption bands overlapped means that the interaction between Imidor and soybeans was, in fact, physical adsorption.
The spectra of the treated soybeans and the spectra of Static overlapped at 1360.56 and 1362.94 cm–1, as well as in the range of 830–890 cm–1. The comparison with the Deposit spectra revealed no overlaps, which indicated chemisorption on the soybean testa surface.
We tested the method of IR spectroscopy on complex organic adsorbed modifiers and detected certain structural elements with varying indicator values. The analysis revealed the presence of an aromatic system, the nature of functional groups, and the position of substituents.
CONCLUSION
The research featured the spectral-luminescent profile of untreated (control) and treated (experimental) soybeans and their infrared spectra. Both spectral profiles changed after the samples were treated with various modifiers. The comparative analysis of the infrared spectra gave the following results:
– the luminescence spectrum of the untreated Vilana soybean testa was 400–550 nm, with a maximum of λƒ max 441 nm and the Stokes shift of 79 nm;
– the luminescence spectrum of the treated soybeans had two bands: at 390–550 nm with a maximum of λƒ1 max
446.5 nm and at 560–615 nm with λƒ2 max 585 nm; the Stokes shift was 84 nm;
– the first band of the treated soybeans overlapped with the Rhizoform and Static spectra. The hypsochromic shift of the first band maximum was λƒ1 max. The difference with the maxima of Rhizoform and Static was 2.5 and 0.5 nm, respectively;
– in the treated soybean sample, the second band at 560– 615 nm with a maximum λƒ2 max 585 nm and intensity Іƒ(λ)2 max 1.129 RU overlapped with the luminescence of Imidor;
– the luminescence of the treated and untreated soybean testa samples, as well as that of the modifiers, belonged to fluorescence;
– the modifiers on the surface of the treated soybeans could be identified at 1550–1200 cm–1. We found five band maxima that overlapped with the Imidor spectra, two overlaps with the Static spectra, and no overlaps with the Deposit spectra;
– we detected the types of interaction between soybeans and modifiers. In case of Imidor, it was physical adsorption, while in case of Deposit, it was chemisorption.
Luminescence and IR spectroscopy provided a preliminary quality assessment of soybeans without germination. The spectral profile was able to define the heterogeneity of the crop seeds and helped select the best planting material.
The fluorescence level characterized the penetration of modifiers into plant tissues. This analysis made it possible to observe the pre-sowing treatment quality changes that may occur as a result of environmental changes, thus helping select the optimal processing conditions and the best modifier or their mix.
The methods of luminescence and IR spectroscopy were found prospective for new methods of qualitative and quantitative analysis of soybean surface before and after treatment.Contribution
Olga N. Bugaets performed the research, analyzed the obtained data, and wrote the article. Ivan A. Bugaets prosed the experimental data. Elena A. Kaigorodova designed the research and provided scientific counselling. Sergey V. Zelentsov prepared the research material and provided scientific counselling. Natalia A. Bugaets reviewed scientific publications. Evgeny O. Gerasimenko was responsible for the spectrofluorimetry. Elena A. Butina performed the IR-Fourier spectrometry.
CONFLICTS OF INTEREST
The authors declare that there is no conflict of interests regarding the publication of this articleFUNDING
The authors used the equipment of the Research Center for Food and Chemical Technologies. This Collective Use Center at Kuban State Technological University (KUBSTU) (CKP_3111) is supported by the Ministry of Science and Higher Education of the Russian Federation (Minobrnauki) (Agreement N 075-15-2021-679). The research was part of the state task of the Minobrnauki, project no. FZEZ-2020-004.REFERENCES
- Messina M. Perspective: Soybeans can help address the caloric and protein needs of a growing global population. Frontiers in Nutrition. 2022;9. https://doi.org/10.3389/fnut.2022.909464
- Abdelghany AM, Zhang S, Azam M, Shaibu AS, Feng Y, Qi J, et al. Natural variation in fatty acid composition of diverse world soybean germplasms grown in China. Agronomy. 2020;10(1). https://doi.org/10.3390/agronomy10010024
- Sokolov DV, Bolkhonov BA, Zhamsaranova SD, Lebedeva SN, Bazhenova BA. Enzymatic hydrolysis of soy protein. Food Processing: Techniques and Technology. 2023;53(1):86–96. (In Russ.). https://doi.org/10.21603/2074-9414-2023-1-2418
- Serba EM, Tadzhibova PYu, Rimareva LV, Overchenko MB, Ignatova NI, Volkova GS. Bioconversion of soy under the influence of Aspergillus oryzae strains producing hydrolytic enzymes. Foods and Raw Materials. 2021;9(1):52–58. https://doi.org/10.21603/2308-4057-2021-1-52-58
- Zhang J, Li M, Kong Z, Bai T, Quan R, Gao T, et al. Model prediction of herbicide residues in soybean oil: Relationship between physicochemical properties and processing factors. Food Chemistry. 2022;370. https://doi.org/10.1016/j.foodchem.2021.131363
- Zelentsov SV, Kochegura AV, Podkina DV, Trembak EN. Vilana Soybeans. Russia patent 03379607722. 1996.
- Migues VH, David JM, Gomes AF, David JP. Determination of soybean isoflavone by HPLC/DAD and simple UV spectroscopic analysis: A comparative study. Food Analytical Methods. 2022;15:367–376. https://doi.org/10.1007/s12161-021-02120-2
- Desta KT, Hur O, Lee S, Yoon H, Shin M, Yi J, et al. Origin and seed coat color differently affect the concentrations of metabolites and antioxidant activities in soybean (Glycine max (L.) Merrill) seeds. Food Chemistry. 2022;381. https://doi.org/10.1016/j.foodchem.2022.132249.
- Saito Y, Itakura K, Kuramoto M, Kaho T, Ohtake N, Hasegawa H, et al. Prediction of protein and oil contents in soybeans using fluorescence excitation emission matrix. Food Chemistry. 2021;365. https://doi.org/10.1016/j.foodchem.2021.130403
- Yu D, Lord N, Polk J, Dhakal K, Li S, Yin Y, et al. Physical and chemical properties of edamame during bean development and application of spectroscopy-based machine learning methods to predict optimal harvest time. Food Chemistry. 2022;368. https://doi.org/10.1016/j.foodchem.2021.130799
- Belyakov MV. Determination of seed germination of plants by the luminescence method. The Bulletin of Izhevsk State Agricultural Academy. 2017;52(3):35–40. (In Russ.). https://elibrary.ru/ZRCNHZ
- Belyakov MV, Bereznikova LA. Innovative photoluminescent device control parameters of the plant seeds. Bulletin NGIEI. 2017;78(11):46–58. (In Russ.). https://elibrary.ru/ZWPRFF
- Efimenko EG, Kucherenko LA, Efimenko SK, Nagalevskaya YaA. Evaluation of the general qualitative traits of soybean seeds using IR-spectrometry. Oilseeds. Scientific and Technical Bulletin of the All-Russian Scientific Research Institute of Oilseed. 2016;167(3):33–38. (In Russ.). https://elibrary.ru/WWTJJD
- Valand R, Tanna S, Lawson G, Bengtström L. A review of Fourier Transform Infrared (FTIR) spectroscopy used in food adulteration and authenticity investigations. Food Additives and Contaminants: Part A. 2020;37(1):19–38. https://doi.org/10.1080/19440049.2019.1675909
- Romero EL, Fairfax M, Colombo R, Gallup C, Biro A. Fungicide compounds and mixtures for control of fungal diseases of grain crops. Russia patent RU 2749224C2. 2021.
- Tanaka A, Shimomura M, Nokura Y, Murakami S. Heterocyclic compound and agent containing it for the control of harmful arthropods. Russia patent RU 2748695C2. 2021.
- Denisov A. Rhizoform for soybean seed processing. International Agricultural Journal. 2015;(2):65–67. (In Russ.). https://elibrary.ru/TOASQH
- Anhalt JC, Moorman TB, Koskinen WC. Biodegradation of imidacloprid by an isolated soil microorganism. Journal of Environmental Science and Health, Part B: Pesticides, Food Contaminants, and Agricultural Wastes. 2007;42(5):509–514. https://doi.org/10.1080/03601230701391401 PMID: 17562458.
- Belyakov MV. Technique of studying the luminescent properties of plant seeds in “Flyuorat-02-Panorama” spectrofluorometer. Scientific Life. 2016;(3):18–26. (In Russ.). https://elibrary.ru/VXMTLN
- Liu Q, Zhang W, Zhang B, Du C, Wei N, Liang D, et al. Determination of total protein and wet gluten in wheat flour by Fourier transform infrared photoacoustic spectroscopy with multivariate analysis. Journal of Food Composition and Analysis. 2022;106. https://doi.org/10.1016/j.jfca.2021.104349
- Kazachenko AlS, Kazachenko AS, Chaplygina IA, Stupko TV. Using IR-spectroscopy in the analysis of grain (review). Bulletin of KSAU. 2019;150(9):134–142. (In Russ.). https://elibrary.ru/COSTFD
- Keerati-U-Rai M, Miriani M, Iametti S, Bonomi F, Corredig M. Structural changes of soy proteins at the oil–water interface studied by fluorescence spectroscopy. Colloids and Surfaces B: Biointerfaces. 2012;93:41–48. https://doi.org/10.1016/j.colsurfb.2011.12.002
- Marshall WE, Wartelle LH, Boler DE, Johns MM, Toles CA. Enhanced metal adsorption by soybean hulls modified with citric acid. Bioresource Technology. 1999;69(3):263–268. https://doi.org/10.1016/S0960-8524(98)00185-0
- Li W, Zhao H, He Z, Zeng M, Qin F, Chen J. Modification of soy protein hydrolysates by Maillard reaction: Effects of carbohydrate chain length on structural and Interfacial properties. Colloids and Surfaces B: Biointerfaces. 2016;138:70–77. https://doi.org/10.1016/j.colsurfb.2015.11.038
