

Аннотация
This paper shows a possibility of establishing the authenticity and geographic origin of wines by neural networks based on multi-element analysis. The study used 144 samples of Cabernet and Merlot dry red wines produced in Krasnodar Region according to traditional technologies. The wines were provided by the producers or purchased in retail stores. The concentrations of 20 micro- and macroelements in red wines were determined by atomic emission spectroscopy with inductively coupled plasma. The analysis of average elemental contents showed a significant dependence of wine composition on the grape variety and place of origin, which enabled us to examine interrelations between the elements and think of a way to identify them by means of classification models. The software STATISTICA Neural Networks was used to assess a possibility of determining the grape variety and geographical origin. The neural networks constructed in the study contained five variables corresponding to the elements with statistically significant correlations between the names of the regions and the wine samples, namely Fe, Mg, Rb, Ti, and Na. These predictors were able to determine the grape variety and place of growth with a sufficiently high accuracy. In the test sample set, the accuracy reached 95.24% and 100% for variety and region identification, respectively. A software product was developed to automate the calculations based on the neural networks. The program can establish the grape variety from a minimal set of microelements, and then, based on the variety and the same set of microelements, determine its place of origin.Ключевые слова
Cabernet and Merlot red wines, regional and varietal origin of wine, multi-element analysis, neural network technologies, Neural NetworkВВЕДЕНИЕ
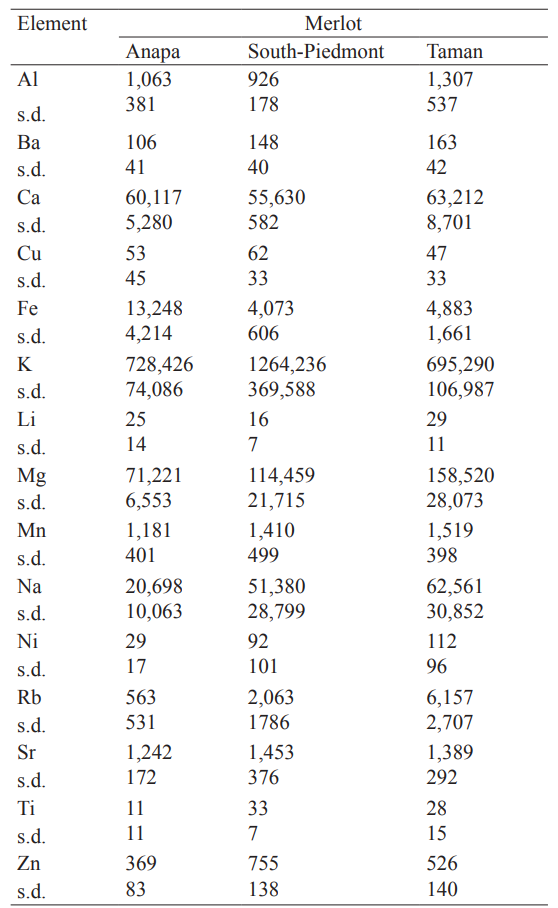
One of the most difficult tasks in analytical chemistry of wine is to identify its authenticity and geographical origin. Single quality assessment parameters are not sufficient to determine whether the product conforms to its labels. To establish the authenticity and geographical origin of wines, as well as changes occurring in case of their adulteration, analytical approaches are being developed that aim to determine the mineral and isotopic composition, study spectral characteristics, and identify phenolic and volatile compounds using various methods of analysis [1–2]. The identification of authenticity and origin criteria is based on obtaining a large amount of data and its processing by chemometric methods, which reveal hidden relations between the wine’s components [1–9]. The combination of modern data analysis tools with the capabilities of chemometric methods ensures higher accuracy in identifying the geographical origin of wines. The information on the elemental composition of wines can be used to both control the technological process and, in combination with chemometric data processing methods, establish the origin of wines [10, 11]. For example, wines produced in various regions of Europe differ quite markedly in the metal content [12], which makes it a good criterion for identifying their geographical origin (Table 1).

Natural variability of wine quality is determined by the grapes growing conditions, such as the climate, the microelement composition of the soil, the technology of growing grapes, the period of grape harvest, etc. The mineral composition of wines can be influenced by various factors (soil, climate, relief, etc.); therefore, for identification purposes, many researchers study those elements which are least dependent on external factors in a given geographical area [3–6, 8, 9, 13, 14]. For example, some authors [13] use Sr, Mn, Mg, Li, Co, Rb, B, Cs, Zn, Al, Ba, Si, Pb, and Ca.
The content of metals in wines is widely different: 10–1000 of macroelements (Ca, K, Na, and Mg), 0.1–10 mg/dm3 of minor elements (Al, Fe, Cu, Mn, Rb, Sr, and Zn), and 0.1–1000 μg/dm3 of trace elements (Ba, Cd, Co, Cr, Li, Ni, Pb, V, etc.) [12]. Therefore, the problem of ascertaining the microelement “image” of grapes is of practical, as well as scientific, interest [14–18].
In cases when wines from different grape varieties have certain organoleptic similarities, for example, colour or astringent, sour taste, it is important to be able to identify the grape variety from the microelement composition of the wine [19]. In fact, the task comes down to establishing the grape variety and geographical origin based on the content of microelements in a sample of unblended wine.
The purpose of this work was to study a possibility of identifying the authenticity and geographical origin of red wines, namely Cabernet and Merlot varietal wines, based on multi-element analysis with STATISTICA Neural Network.
ОБЪЕКТЫ И МЕТОДЫ ИССЛЕДОВАНИЯ
The study used 144 samples of Cabernet (76) and Merlot (68) varietal dry wines produced from 2012 to 2015 by the main wineries in Krasnodar Region: ZAO Zaporozhskoye, OOO Kuban-Vino, OAO APF Fanagoria, OOO APK Millstream Black Sea Wines, ZAO AF Kavkaz, ZAO Abrau-Durso, ZAO APK Gelendzhik, ZAO AF Myskhako, OOO Firma Somelye, ООO AF Sauk-Dere, and ООО Soyuz-Vino (Table 2). Theses wineries are located in different geographic zones (subzones) of Krasnodar Region: the South-Piedmont zone, the Black Sea zone, the Anapa subzone, and the Taman subzone. The wines were provided by the manufacturers or purchased in retail stores.

The main vineyards of Krasnodar Region are located in five cultivation areas: Temryuk (the Taman Peninsula, the Taman subzone), Anapa (the Anapa subzone), the Black Sea zone (Gelendzhik and Novorossiysk), Krymsk (the South-Piedmont zone), and Novokubansk. The frequency distribution of Cabernet and Merlot samples by zone and variety is shown in Table 2.
The elemental composition of the wine samples was established by atomic emission spectroscopy with inductively coupled plasma using iCAP-6000 (Thermo Scientific). The operating conditions of the spectrometer were optimised to detect 20 elements (Li, Na, Mg, Al, K, Ca, Ti, V, Cr, Mn, Fe, Co, Ni, Cu, Zn, Rb, Sr, Cd, Ba, and Pb). The most sensitive analytical lines were used for most of the metals, with the exception of Al, V, Ca, Mg, and Sr, for which alternative lines were chosen due to spectral overlays. For some macroelements, we needed to reduce the signal intensity. When optimising the conditions for element detection, we studied how the operating characteristics (generator power, argon flow rate) affected the analytical signal of elements in the model and sample solutions. We also investigated the mutual influence of micro- and macroelements, as well as background components, of the samples prepared for analysis in the model solutions containing variable amounts of the elements. The quantification of metals was carried out by diluting the wine samples, taking into account the data obtained [5, 14–18, 20, 21].
The following reference standards were used to study the test samples: GSO 7780-2000 (Li), GSO 8062-94 (Na), GSO 7767-2000 (Mg), GSO 7854-2000 (Al), GSO (K), GSO 7772-2000 (Ca), GSO 7205-95 (Ti), GSO (Cr), GSO 8056-94 (Mn), GSO 8032-94 (Fe), GSO 7784-2000 (Co), GSO 7785-2000 (Ni), GSO 7836-2000 (Cu), GSO 8053-94 (Zn), GSO 7035-93 (Rb), GSO 7783-2000 (Sr), GSO 7874-2000 (Cd), GSO 7760-2000 (Ba), and GSO 7778- 2000 (Pb). All the reagents used in the work were of chemically pure (C.P.) grade.
The chemometric analysis was performed using STATISTICA Neural Networks [22].
РЕЗУЛЬТАТЫ И ИХ ОБСУЖДЕНИЕ
The analysis of average element contents (Tables 3, and 4) showed a significant dependence of wine composition on the grape variety and place of origin. For example, the samples from the Anapa subzone had a high content of Fe, those from the South-Piedmont zone were rich in Ba, Ti, and V, whereas the Taman wines were abundant in Na, Mg, and Rb. The Cabernet wines had significantly different contents of many elements. For example, the Cabernet samples from the South-Piedmont zone contained the lowest concentrations of Li, Na, Al, Ca, Fe, and Sr, while the Merlot samples from the same zone had the lowest content of Al, Ca, Fe, and Li. As a rule, standard deviations did not exceed half of the average values. This suggests a small variation in the concentrations of elements, which means that an average value is a relevant characteristic of metal content in wine. The exceptions are Cu, Li, Ni, Na, Rb, and Ti; however, standard deviations exceeded the averages only in three cases: Cu (Cabernet, Anapa subzone) and Ni (Cabernet and Merlot, South-Piedmont zone).

Previously, we applied traditional statistical methods of discriminant analysis and classification trees to construct probabilistic-statistical models that allowed us to identify the varietal and regional origin of the same group of red wines using multi-element analysis data [23]. This study looked at a possibility of determining the grape variety and geographical origin using STATISTICA Neural Networks, followed by a comparative analysis.
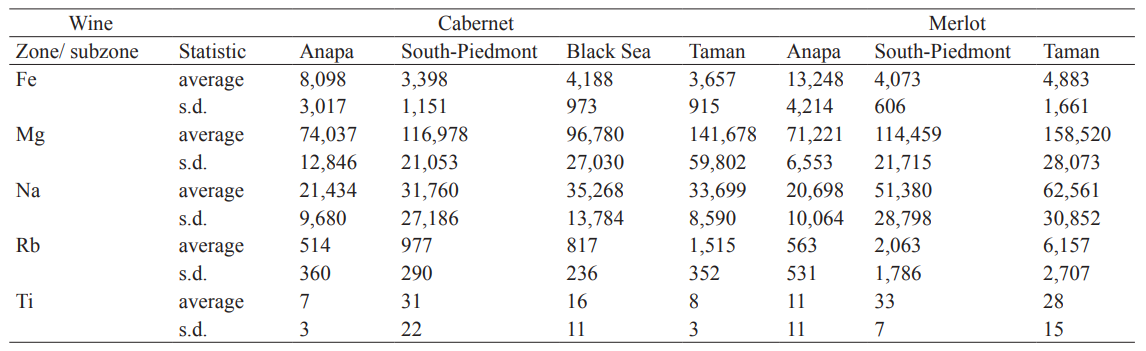
To select a number of elements as predictors of neural network classification models, we used a Spearman’s nonparametric correlation coefficient that characterised the correlation between the names of wine samples, the region of grape origin, and the concentrations of trace elements in the samples. In particular, the elements with the largest statistically significant correlation links between the names of regions and wines (Fe, Mg, Rb, Ti, and Na) were selected as predictor variables.
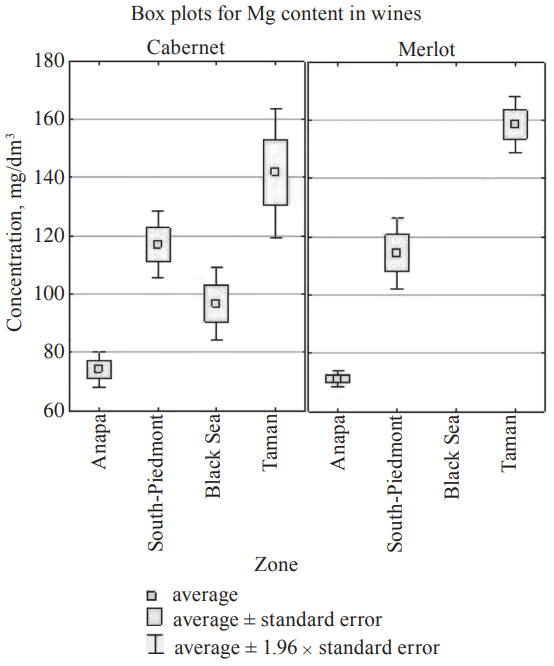
In Table 5, which shows average elemental contents with standard deviations in both wine varieties from different regions, we can see some significant differences in the average values – the deciding factor for building classification models with neural networks. Most distinctly these differences are visualised by means of graphs. Fig. 1, for example, shows some box plots displaying Mg content in the Cabernet and Merlot wines from various regions. The box plots present ranges of values of a selected variable separately for groups of observations defined by the values of a categorical variable. The rectangles depicted around the midpoints (or squares) represent selected ranges of variation, for example, the standard error (the ratio of the standard deviation to the square root of the sample size). The segments with their ends outside the rectangles also reflect ranges of variation (average ± 1.96 × standard error). The diagram shows that the average values of Mg content, together with variation values, differ significantly between both the regions and the grape varieties.
As in [23], we were not able to build adequate neural networks that would allow us to identify the grape variety and region of origin from the concentrations of selected elements. Therefore, the problem was divided into two parts. First, networks were built to predict the grape variety from the concentrations of Fe, Mg, Rb, Ti, and Na. Then, based on the variety predicted (qualitative predictor) and the same set of elements (quantitative predictors), further networks were built to determine the place of grape origin. After assessing their predictive properties (productivity, number of classification errors, etc.), we selected the best network. Productivity is a percentage of correctly classified wine samples, with 100% taken as maximum. The higher the productivity, the more accurate the prediction. To improve predictive accuracy, the samples were divided into three groups: training, control, and validation sample. The most important were the values of adequacy criteria in the test set. By combining various network options, we tried to create a network with the best predictive capabilities; therefore, at each stage of the process, the number of networks was different.
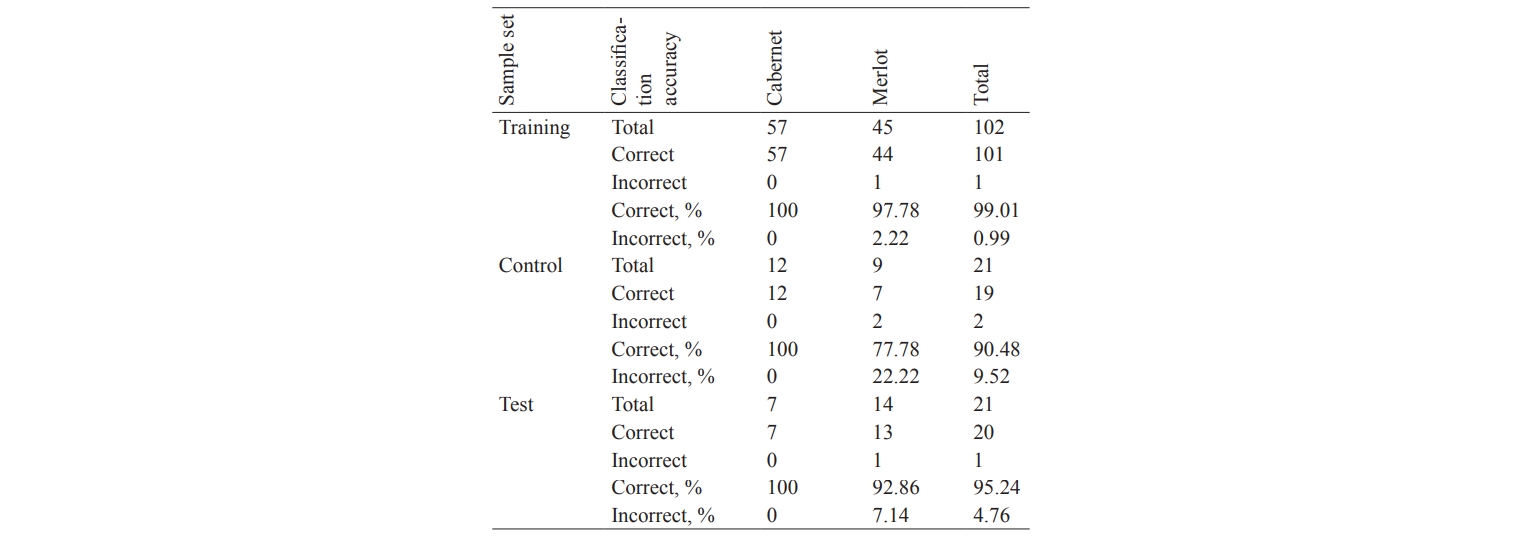
Building a neural network to establish the varietal origin of wine. The program divided 144 wine samples into three groups: training set (102), control set (21), and test set (21). The productivity of the best network (MLP 5-5-2), selected out of 50, had high values of 99.02%, 90.48%, and 95.30% in the training, control, and test sets, respectively. MLP 5-5-2 is a combination of letters and numbers that represents a topology of a multilayer perceptron. The letters stand for the type of a neural network, a multilayer perceptron (MLP); the first numeral (5) refers to the number of predictor variables in the model, a sum of quantitative predictors and qualitative predictor values; the second (5) and the third (2) numerals refer to the numbers of hidden and output neurons, respectively.
The network topology is shown in schematic form in Fig. 2, where we can see five entries of predictor variables Xi; five hidden neurons Yj; two output neurons representing objects of classification Qk, the Cabernet and Merlot varieties, as well as connections between them in the form of weights Wij, Wjk.

Table 6 shows the frequencies of correctly and incorrectly classified wines in the sample sets. As we can see, one Merlot sample from the training and the test sets and two Merlot samples from the control set were erroneously classified as Cabernet. All Cabernet samples were correctly identified in all the sets. The total number of erroneously classified samples was four out of 144 (app. 2.8%), i.e. the neural network identified 97.2% of the wine samples correctly. In [23], by comparison, the classification tree with seven terminal vertices only once misclassified a Merlot sample as a Cabernet, based on the concentration of seven microelements, i.e. 99.3% of the training sample was identified correctly.
The network sensitivity can be used to estimate a contribution of each predictor to its predictive properties: in our case, a contribution of the elements to the classification model. The sensitivity values (see Table 7) indicate a decreasing sequence of Fe, Rb, Mg, Na, and Ti, which represents their contributions to the predictive properties of the network.

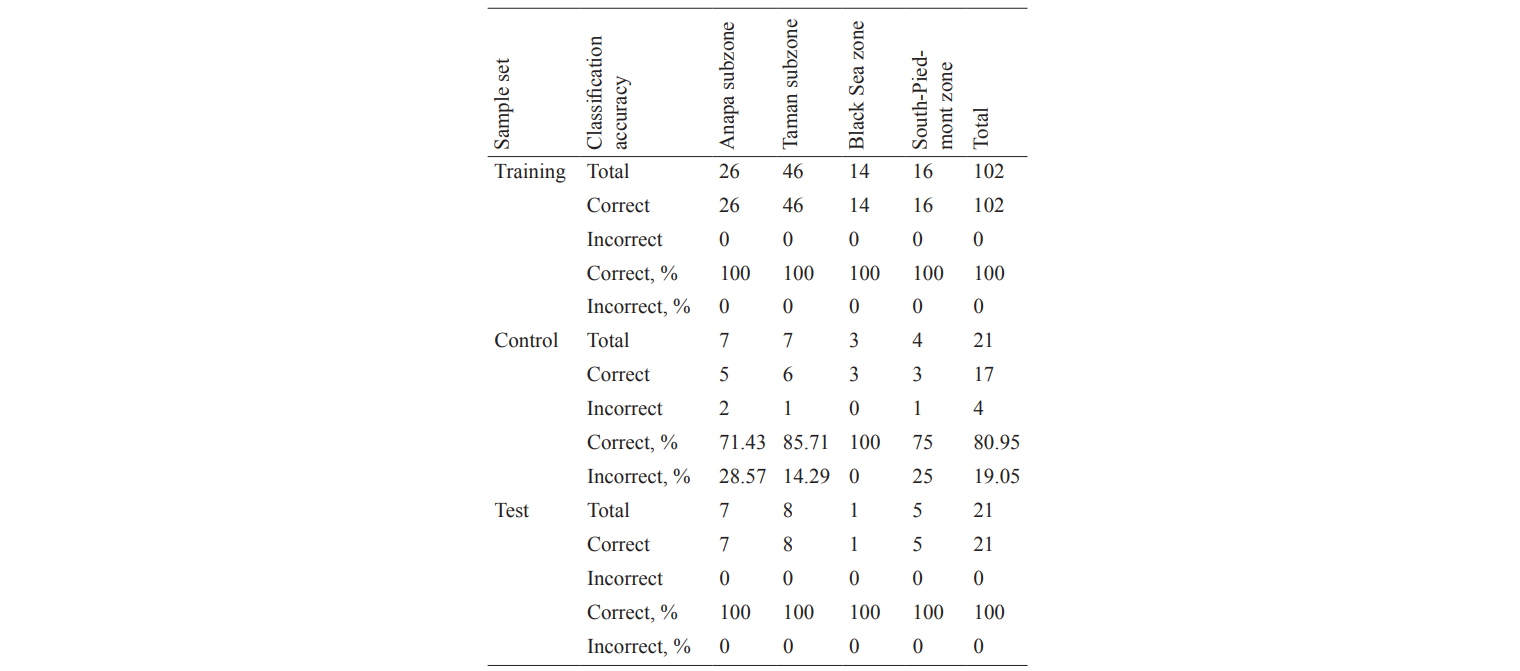
Building a neural network to determine the regional origin. The possibility of predicting the wine variety based on five microelements made it realistic to create a neural network to identify the place of grape origin using the trace elements of Fe, Mg, Rb, Ti, and Na and the varieties of Cabernet and Merlot. In the same way, the program divided 144 wine samples into three groups: training set (102), control set (21), and test set (21). The best out of 18 networks (MLP 7-9-4) had productivity values of 100%, 80.95%, and 100% in the training, control, and test sets, respectively.
As can be seen in Table 8, all the wine samples (100%) from the Black Sea zone were classified by the network correctly. The next high accuracy area was the Taman subzone with 100%, 85.71%, and 100% of correctly classified samples in the training, control, and test sets, respectively. The lowest accuracy was observed in the Anapa subzone: 100%, 71.43%, and 100%, respectively. The total number of misclassified samples was four out of 144 (app. 2.8%), i.e. the neural network identified 97.2% of the wine samples correctly. It is noteworthy that all the samples in the test set were classified correctly, regardless of the place of origin.
The sensitivity analysis showed that the average predictor contributions to the network’s predictive properties decreased in the following order: Variety, Rb, Ti, Mg, Fe, and Na. We can notice that this sequence is significantly different from the one for the variety identification network.
In [23], the problem of identifying the place of grape origin was solved separately for Cabernet and Merlot wines using two methods, discriminant analysis and classification trees. The discriminant analysis of Cabernet and Merlot wines involved 13 and 14 microelements, respectively, whereas only 7 and 3 microelements were used in the classification trees. However, both methods produced 100%-accurate classifications.
The above shows that the traditional methods of classification analysis, which used a larger number of elements, achieved a higher predictive accuracy. However, the neural networks also showed acceptable prediction accuracy with a significantly smaller number of predictors (5). The results were confirmed by the classification analysis in the test sample set, with a 100% accuracy of region identification and only one mistake in variety identification.
Thus, we managed to build adequate neural networks for two red wines, Merlot and Cabernet, with high predictive properties, able to determine the wine variety from a minimum set of elements, and then, identify the region of grape origin from the variety and the same set of elements.
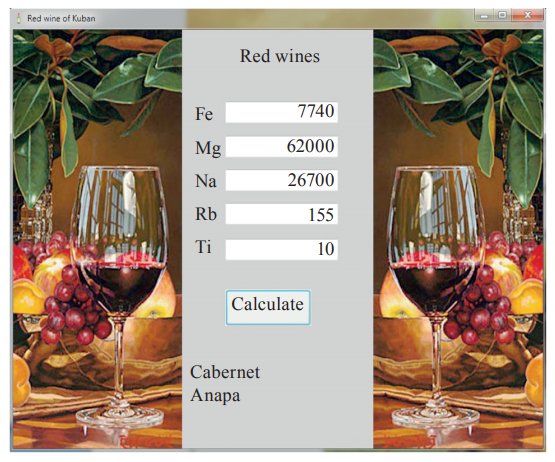
To automate the process of identifying the varietal and geographical origin of red wines, we developed a program using Visual C# (C Sharp). The network parameters obtained during the training process, their topology and weights made it possible to create an autonomous software product that can function independently of STATISTICA. The home screen of the program is shown in Fig. 3. If you enter the concentration values of the trace elements Fe, Mg, Na, Rb, and Ti into the corresponding boxes on the interface and click ‘Calculate’, you will see the variety (Cabernet) and the place of the grape origin (Anapa) at the bottom of the screen.
ВЫВОДЫ
Thus, the use of neural networks enabled us to successfully identify both the varietal and the regional origin of red wines. It is equally important that a certain set of elements in wine contains information not only about the grape variety, but also about the place of its growth. Traditional and heuristic methods of classification analysis used with modern data analysis tools allowed us to accurately determine the grape variety and region of origin from the “elemental” memory of the wine.
КОНФЛИКТ ИНТЕРЕСОВ
The authors declare no conflict of interest.
БЛАГОДАРНОСТИ
The study was financed by the Russian Foundation for Basic Research (Project No. 18-03-00059); the scientific equipment was provided by the Centre for Environmental Analysis at the Kuban State University (unique identifier RFMEFI59317X0008).
СПИСОК ЛИТЕРАТУРЫ
- Schlesier K., Fauhl-Hassek C., Forina M., et al. Characterisation and determination of the geographical origin of wines. Part I: Overview. European Food Research and Technology, 2009, vol. 230, no. 1, pp. 1–13. DOI: https://doi. org/10.1007/s00217-009-1140-y.
- Daniel C. and Smyth H. Analytical and Chemometric-Based Methods to Monitor and Evaluate Wine Protected Designation. Comprehensive Analytical Chemistry, 2013, vol. 60, pp. 385–408. DOI: https://doi.org/10.1016/B978- 0-444-59562-1.00015-3.
- Geana I., Iordache A., Ionete R., et al. Geographical origin identification of Romanian wines by ICP-MS elemental anal- ysis. Food Chemistry, 2013, vol. 138, no. 2–3, pp. 1125–1134. DOI: http://doi.org/10.1016/j.foodchem.2012.11.104.
- Selih S., Sala M., and Drgan V. Multi-element analysis of wines by ICP-MS and ICP-OES and their classifica- tion according to geographical origin in Slovenia. Food Chemistry, 2014, vol. 153, pp. 414–423. DOI: http://doi. org/10.1016/j.foodchem.2013.12.081.
- Martin A.E., Watling R.J., and Lee G.S. The multi-element determination and regional discrimination of Australian wines. Food Chemistry, 2012, vol. 133, no. 3, pp. 1081–1089. DOI: https://doi.org/10.1016/j.foodchem.2012.02.013.
- Rodrigues S.M., Otero M., Alves A.A., et al. Elemental analysis for categorization of wines and authentication of their certified brand of origin. Journal of Food Composition and Analysis, 2011, vol. 24, no. 4–5, pp. 548–562 DOI: https://doi.org/10.1016/j.jfca.2010.12.003.
- Khalafyan A.A., Yakuba Yu.F., Temerdashev Z.A., Kaunova A.A., and Titarenko V.O. Statistical-probability simulation of the organoleptic properties of grape wines. Journal of Analytical Chemistry, 2016, vol. 71, no. 11, pp. 1138–1144. DOI: https://doi.org/10.1134/S106193481611006X.
- Geana E.I., Marinescu A., Iordache A.M., et al. Differentiation of Romanian Wines on Geographical Origin and Wine Variety by Elemental Composition and Phenolic Components. Food Analytical Methods, 2014, vol. 7, no. 10, pp. 2064–2074. DOI: https://doi.org/10.1007/s12161-014-9846-2.
- Dinca O.R., Ionete R.E., Costinel D., et al. Regional and Vintage Discrimination of Romanian Wines Based on Ele- mental and Isotopic Fingerprinting. Food Analytical Methods, 2016, vol. 9, no. 8, pp. 2406–2417. DOI: https://doi. org/10.1007/s12161-016-0404-y.
- Giaccio M. and Vicentini A. Determination of the geographical origin of wines by means of the mineral content and the stable isotope ratios: A review. Journal of Commodity Science, Technology and Quality, 2008, vol. 47, pp. 267–284.
- Ríos-Reina R., Elcoroaristizabal S., Ocaña-González J.A., et al. Characterization and authentication of Spanish PDO wine vinegars using multidimensional fluorescence and chemometrics. Food Chemistry, 2017, vol. 230, pp. 108–116. DOI: https://doi.org/10.1016/j.foodchem.2017.02.118.
- Pohl P. What do metals tell us about wine? Trends in Analytical Chemistry, 2007, vol. 26, no. 9, pp. 941–949. DOI: https://doi.org/10.1016/j.trac.2007.07.005.
- Hopfer H., Nelson J., Collins T.S., Heymann H., and Ebeler S.E. The combined impact of vineyard origin and pro- cessing winery on the elemental profile of red wines. Food Chemistry, 2015, vol. 172, pp. 486–496. DOI: https://doi. org/10.1016/j.foodchem.2014.09.113.
- Jurado J.M., Alcázar A., Palacios-Morillo A., and de Pablos F. Classification of Spanish DO white wines according to their elemental profile by means of support vector machines. Food Chemistry, 2012, vol. 135, no. 3, pp. 898–903. DOI: http://doi.org/10.1016/j.foodchem.2012.06.017.
- Rapeanu G., Vicol C., and Bichescu C. Possibilities to assess the wines authenticity. Innovative Romanian Food Bio- technology, 2009, vol. 5, pp. 1–9.
- Grindlay G., Mora J., Gras, L., and de Loos-Vollebregt M.T.C. Atomic spectrometry methods for wine analysis: A critical evaluation and discussion of recent applications. Analytica Chimica Acta, 2011, vol. 691, no. 1–2, pp. 18–32. DOI: https://doi.org/10.1016/J.ACA.2011.02.050.
- Ivanova-Petropulos V., Balabanova B., Mitrev S., et al. Optimization and Validation of a Microwave Digestion Meth- od for Multi-element Characterization of Vranec Wines. Food Analytical Methods, 2016, vol. 9, no. 1, pp. 48–60. DOI: https://doi.org/10.1007/S12161-015-0173-z.
- Gonzálvez A., Armenta S., Pastor A., and De La Guardia M. Searching the most appropriate sample pretreatment for the elemental analysis of wines by inductively coupled plasma-based techniques. Journal of Agricultural and Food Chemistry, 2008, vol. 56, no. 13, pp. 4943–4954. DOI: https://doi.org/10.1021/JF800286Y.
- De La Guardia M. and Illueca A.-G. Food Protected Designation of Origin: Methodologies and Applications. Elsevier Publ., 2013, vol. 60. 800 p.
- Zioła-Frankowska A. and Frankowski M. Determination of Metals and Metalloids in Wine Using Inductively Coupled Plasma Optical Emission Spectrometry and Mini-torch. Food Analytical Methods, 2017, vol. 10, no. 1, pp. 180–190. DOI: https://doi.org/10.1007/S12161-016-0567-6.
- Kaunova A.A., Petrov V.I., Tsiupko T.G., et al. Identification of wine provenance by ICP-AES multielement analysis.Journal of Analytical Chemistry, 2013, vol. 68, no. 9, pp. 917–922. DOI: https://doi.org/10.1134/s1061934813090050.
- Hill T. and Lewicki P. Statistics methods and applications. Tulsa: OK Publ., 2007. 719 p.
- Titarenko V.O., Khalafyan A., Temerdashev Z.A., Kaunova A.A., and Abakumov A.G. Identification of the Varietal and Regional Origin of Red Wines by Classification Analysis. Journal of Analytical Chemistry, 2018, vol. 73, no. 2, pp. 195–206. DOI: https://doi.org/10.1134/s1061934818020132.
