

Аннотация
The present research features such natural herbal extracts as rosemary (Rosmarinus officinalis L.), pomegranate (Punica granatum L.), and green tea (Camellia sinensis L.). Together with vitamin E, they were chosen to investigate hemp oil stability. The experiments revealed the effect of various fatty acids compositions on hemp oil properties. The effect of herbal extracts on the oxidative stability of oils was measured using the Rancimat method. The chemical tests included peroxide value (PV), free fatty acid (FFA) value, and acidity value (AV). Each herbal extract was applied in amounts of 30 mg/l and 50 mg/l. Vitamin E was mixed with the oil in the amount of 2 g/l. The changes in PV, FFA, AV, and fatty acid composition were measured on day 6, 12, 18, and 24. Hemp oil, pure or mixed with the extracts, was analyzed using the Rancimat method at 120°C with an airflow rate of 20 l/h to identify the in- duction periods (IP). IP values of oils with additional herbal extracts were found to be significantly higher (p < 0.05) than those of the control samples. The oil sample with vitamin E demonstrated the longest IP (4.12 hours at 120°C) during the Rancimat test. The herbal extracts and vitamin E had a positive effect on hemp oil PV compared with the control sample. Gas chromatography (GC) showed that hemp oil included a high amount of polyunsaturated Ome- ga-3 fatty acids, and the oil was not resistant to oxidation. In general, the natural herbal extracts and vitamin E in the recommended quantities had a positive effect on the oxidative stability of hemp oil.ВВЕДЕНИЕ
Hemp (Cannabis sativa L.) is one of the oldest cultivated plants in history. Even though there seems to be no proved data about it, hemp was cultivated in Asia approximately 20,000 years ago [32]. As a rule, hemp is used as a fibre source. Most hemp seed sorts contain 20-35% of oil. Hemp oil is important for human diet due to its high polyunsaturated fatty acid content. Omega-6/Omega-3 ratio of hemp seed oil is similar with Mediterranean diets, which have great benefits for the cardiovascular system. According to the European Food Safety Agency, Omega-3 and Omega-6 ratio should be 1:3–1:5 [14]. Today, foods with a high amount of polyunsaturated fatty acids (PUFAs) are in greater demand than those with synthetic additives. However, there is a great competition to stabilize such products because they contain a lot of unsaturated fatty acids [22].
Hemp oil is extracted from hemp seeds by the cold pressed extraction method. As a rule, cold pressed oils are extracted from herbs or seeds by using a hydraulic press. The cold press method has several advantages compared with the more conventional solvent extraction method. First, it does not require heat processing or organic solvent. Second, the cold press method preserves such bioactive compounds as phenolics, essential fatty acids, tocopherols, and flavonoids, which improves the quality of oil [36].
Lipid oxidation often makes food unacceptable and decreases its nutritional quality due to the deterioration of essential fatty acids. Therefore, lipid oxidation is one of the important factors which define the quality and shelf-life of vegetable oils and fats [12]. Under the oxidative degradation, fats and oils produce toxic compounds that are associated with various health issues [13]. Antioxidants are materials that prohibit oxidation of other compounds. Some natural antioxidants to be found in food include ascorbic acid, phenolic compounds, carotenoids, sterols, protein-based components, and sulphur-containing compounds [7]. Synthetic antioxidants are popular in food industry. However, the safety of synthetic materials remains a matter of discussion. It is now obligatory only natural antioxidants should be used in food industry to prevent the oxidative degradation of oils [6]. Herbs and spices contain a high amount of antioxidants due to phytochemicals [35].
In the last decade, many studies have showed that such herbs and spices as pomegranate, rosemary, various tea extracts, oregano, thyme, sage, etc. possess a high antioxidant capacity. It can be explained by the fact that they are rich in phenolic compounds [27]. For instance, pomegranate extract contains flavonoids, hydrolysable tannins, and anthocyanins [18]. Rosemary extract contains such phenolic diterpenes as carnosic acid, carnosol, and rosmanol, which are very effective antioxidants. Carnosic acid is one of the strongest antioxidant components to be found in rosemary extract [37]. Green tea extracts are rich in gallic acid derivatives and flavanols. In addition, green tea extracts contain a wide range of such flavour components as terpenes and organic acids. Green tea extracts are rich in catechins, epicatechin, epicatechin-3-gallate, epigallocatechin, and epigallocatechin-3-gallate [38].
The quality indicators of oils, such as oil stability index (OSI), fatty acid composition, PV, and AV, determine the quality of vegetable oils and fats. The Rancimat method evaluates antioxidants by measuring the changes in the conductivity induced by absorption of volatile organic acids. IP is the time needed for the secondary oxidation products to occur. IP defines the resistance properties of oils against oxidation. Thus, IP can be used to compare oil samples. On the other hand, fatty acid composition determines the stability of oils. Unsaturated fatty acids are especially prone to oxidation [15]. A higher rate of unsaturation makes the substance more oxygen-sensitive. Saturation of oils is measured with the help of GC, which also determines the fatty acids composition.
The determination of free fatty acid evaluates that the quantity of hydrolytic efficiency which occurs in the oil and as well as it shows intensity due to the reason of pro-oxidant effects of free fatty acids [16]. The determination of FFA evaluates that the quantity of hydrolytic efficiency which occurs in the oil and as well as it shows intensity due to the reason of pro-oxidant effects of free fatty acids [16]. The PV evaluates hydro peroxides composed throughout the early phase of rancidity of oils and fats. The process is usually settled on a titration with sodium thiosulphate. It evaluates the iodine released from potassium iodide according to peroxides in the oil [33]. In accordance with the Codex Alimentarius Commission [9], PV for cold pressed oils is < 15 meq/kg (milliequivalents of peroxide per kg of oil). On the other hand, peroxide value demonstrates the current status of oxidation oxidation of oils and fats, and it does not indicate possible oxidation [27].
Hence, the purpose of the study was to investigate the quality parameters of hemp oil mixed with the different natural extracts and vitamin E. Indicators of oil hemp quality revealed some changes in fatty acids compositions and the quality properties. PV, OSI, AV, FFA, and fatty acid composition were evaluated on days 1, 6, 12, 18, and 24. Omega-3 and Omega-6 ratios were evaluated periodically under storage conditions. The research contributed to a better understanding of various vegetable oils and their oxidative and nutritional properties, as well as their feasibility for human diet.
ОБЪЕКТЫ И МЕТОДЫ ИССЛЕДОВАНИЯ
This research was carried out in the laboratory of Food Institute at Kaunas University of Technology. The fresh cold pressed hemp oil was purchased from JSC BORELA (Kaunas). The dried rosemary, green tea leaves, and dried pomegranate were purchased from a local Lithuanian company. Before extraction, the herbs were thoroughly crushed. All the extracts were prepared by pouring boiled deionized water over the dried herbs and stirring for 40 min. The temperature of the water was not maintained during the extraction. After that, the residue was prepared for the freeze drying process. The freeze drying process was applied in a Freeze Drying Plant Sublimator 15 (ZIRBUS Technology, Germany). The materials were placed on the shelf (300 × 400 mm) with the configuration of 5 shelves/80mm distance, 6/65, 7/55, 8/45. The parameters for the process were –45°C and –55°C; the condenser temperature was –18°C; the product temperature at the beginning of the process was –25°C; and the duration of the process was 12–20 hours. After lyophilization (freeze drying) process, the powdered samples were weighed and kept in a sterile plastic bag. Vitamin E was purchased from a local Lithuanian pharmacy. All other reagents for GC and chemical analysis were of analytical grade and obtained from Toronto Research Chemicals (Toronto, Canada). The samples were analyzed for different physicochemical parameters with the help of triple GC and the Rancimat test.
Mixture preparation. The hemp oil was mixed with the extracts of rosemary, green tea, pomegranate, and vitamin E. The extracts were applied in two different amounts: 30 mg/l and 50 mg/l. Vitamin E was mixed with the oil at the amount of 2 g/l. During the experiment, all the samples were kept in the dark at room temperature.
Rancimat analysis. The accelerated Rancimat test was used to estimate the hemp oil stability to oxidation. The Rancimat apparatus was used with one evaluation mode. The induction period (IP) was defined as the time corresponding to the inflection point of the conductivity time curve. The Rancimat analysis was conducted using a Rancimat 892 (Metrohm, Herisau, Switzerland) according to the AOCS Official Method Cd 12b-92 [2]. Three grams of samples were put into the test tubes. Pure oil samples were considered as blank control samples. The oil samples were carefully poured into each reaction vessel not to push the substance into the oxygen glass tube. The temperature of 120°C was set; the airflow rate was 20 l/h. IP was automatically determined from the inflection point of the curve by using the software supplied by the company.
Peroxide value (PV) measurement. PV indicates the state of primary oil oxidation. A high PV results from the history of oil, e.g. its exposure to such oxidation factors as high temperatures during processing and storage [19]. PV was determined according to ISO 3960 [20]. The oil samples (3 g each) were accurately weighed and mixed with isooctane-glacial acetic (3:2) solution. After that, potassium iodide mixture, water, and starch solution were applied. Finally, the mixtures were titrated with sodium thiosulfate, and the results were expressed in miliequivalents of active oxygen per kg of oil [23].
Determination of free fatty acid (FFA) and acid value (AV). FFA and AV of the oil samples were determined according to ISO 660:2009 without any modifications. FFA content is the number of milligrams of potassium hydroxide required to neutralize the FFA present in 1g of fat. The acidity content of FFAs was determined in accordance with the procedure specified in the International Standard (ISO 660:2009). Approximately 5 g of oil samples were carefully weighed and mixed with ethanol (96%) and diethyl (peroxide free) ether in the ratio of 1:1. After that, phenolphthalein was added to the mixture. Finally, the mixtures were titrated with 0.1M sodium hydroxide. The results were expressed in oleic acid (282 g/mol) for the FFA and in milligrams per gram – for the acid value.
Fatty acid composition analysis. The fatty acid composition analysis was based on the AOCS method [1]. The fatty acid composition was analyzed using an Agilent 7890 gas chromatograph coupled with an Agilent 5975 mass spectrometer (GC–MS; Agilent Technology, CA, USA). It was equipped with an HP-88 capillary column (100 mm × 0.25 mm id, 0.2 m film thickness). To prepare fatty acid methyl esters (FAME), oils were saponified with 0.5M KOH and then methylated by using 40% BF3 in methanol. The injection temperature was 250°C. Helium was used as a carrier gas at a pressure of 100 kPa. The split ratio was 1:30. The oven temperature was programmed according to the following sequence: 5 min at 80°C, then an increase up to 150°C at 10°C/min, 2 min at 150°C, followed by another increase up to 230°C at 5°C/min; and 10 min at 230°C. The ionization voltage was 70 eV; the scanning range was 50–550 m/z. Each fatty acid was quantified handling external norm. The fatty acids were expressed as g/100g.
Statistical analysis. All samplings and chemical analyses were tripled. The results of the study were expressed as a mean of the triplicate values with standard deviations.
РЕЗУЛЬТАТЫ И ИХ ОБСУЖДЕНИЕ
The experiment revealed that the small quantities of the extracts had no effect on such sensory properties of hemp oil as taste, color, and smell.
Rancimat analysis. Table 1 shows the effect of rosemary, pomegranate, green tea extracts, and vitamin E on the oxidative stability of the fresh hemp oil. The blank hemp oil oxidative stability IP value was 3.12 ± 0.02 h at 120°C; the airflow rate was 20 l/h. The control samples were the most visibly oxidized ones, which was demonstrated with the lowest IP values obtained. The IP values of oils with additional herbal extracts were found to be significantly larger (p < 0.05) than that in the control samples.
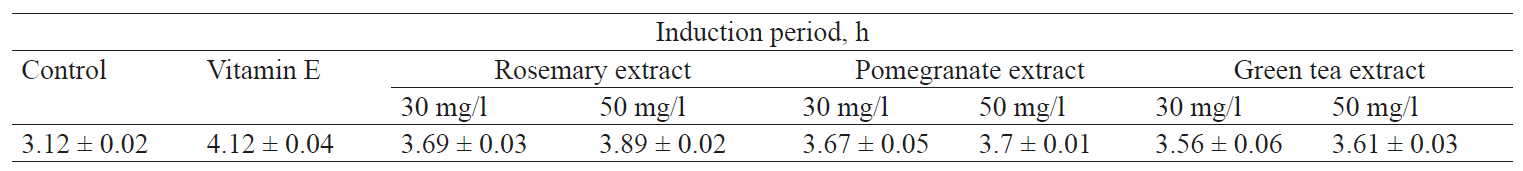
The Rancimat test assessed IP to detect the formal volatile acids throughout oil oxidation [25]. When vitamin E was added to the hemp oil, it resulted in the highest IP value (4.12 ± 0.04 h). This was because of the strong antioxidant capacity of the tocopherol content in vitamin E. When rosemary was added to the hemp oil, IP values were 3.69 ± 0.03 h (30 mg/l) and 3.89 ± 0.02 h (50 mg/l). IP values for the green tea were 3.67 ± 0.05 h (30 mg/l), 3.7 ± 0.01 h (50 mg/l). IP values for the pomegranate extract were and 3.56 ± 0.06 h (30 mg/l) and 3.6 ± 0.03 h (50 mg/l). According to the results, the oils showed lower IP compared to the control sample. This means that the extracts had a high potential prevention of oxidative stability. According to Parker et al. [31], OSI was 8.5 hours for the cold pressed virgin (not refined) hemp seed oil (Wisconsin, USA) at 80°C and 7 l/h air flow rate.
Peroxide value analysis. Fig. 1 shows the effect the storage at 25°C produced on PV of the seven samples. On day 24, PV of all the oil samples increased. The PVs of the control sample demonstrated a decrease on day 24 after a stable increase from day 0 to day 18. The decrease in the PV rates was caused by the unbalanced initial oxidation products which are responsive to dissociation and carbonyl compounds [34]. On day 24, the blank sample had significantly higher PVs (p < 0.05) compared to the samples with rosemary, green tea, pomegranate, and vitamin E. The latter effectively slowed down the formation of hydro peroxide, and therefore postponed lipid oxidation. Plant phenolic compositions decrease lipid oxidation because of their radical-scavenging ability. Phenolic composition could delay the oxidation process owing to the decay of lipid hydro-peroxides. Various phenolic compounds indicate different capacity in delaying lipid oxidation. The difference in their impact is usually attributed to the variation in their structure [26].
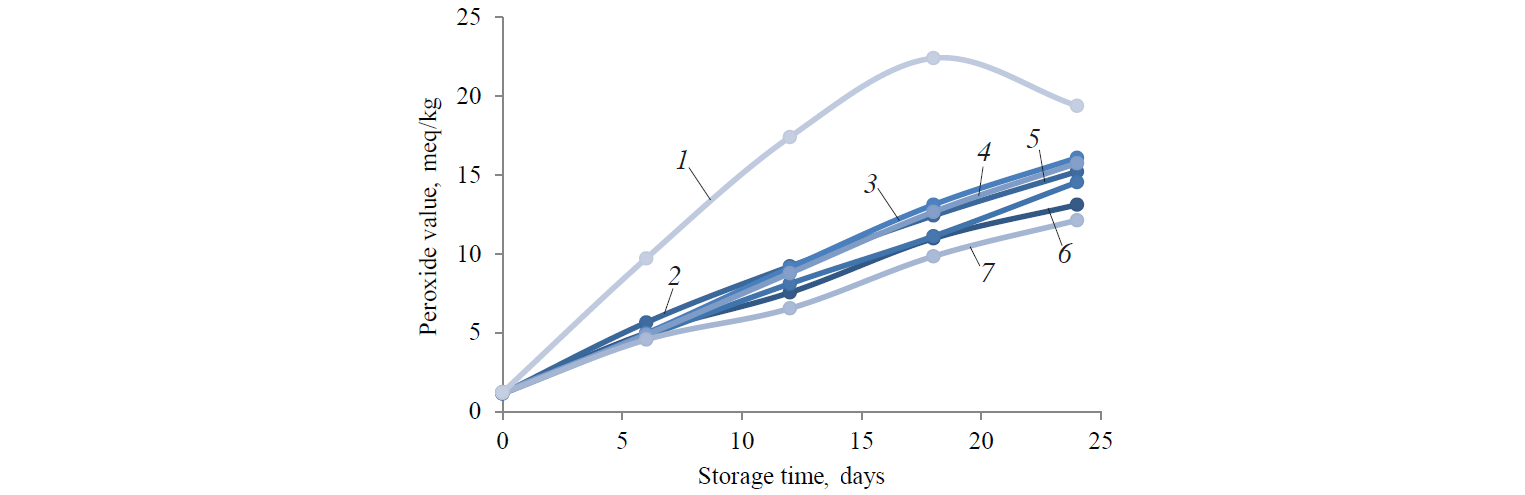
1 – control; 2 – green tea extract 30 mg/l; 3 – pomegranate extract 30 mg/l; 4 – pomegranate extract 50 mg/l;
5 – green tea extract 50 mg/l; 6 – rosemary extract 50 mg/l; 7 – vitamine E 2 g/l.
PV of the control hemp oil was 19.4 ± 0.12 meq/kg. PVs of experimental samples by day 24 were significantly different (p < 0.05) compared to the control sample. Rosemary, green tea extract, and vitamin E revealed a greater ability to delay the PV rates of oils. By day 24, the lowest PV was 12.14 ± 0.17 meq/kg for the vitamin E sample. The effect of rosemary extracts was greater than that of the green tea and pomegranate extracts. PVs of hemp oil with rosemary extract were 14.43 ± 0.06 meq/kg (30 mg/l) and 13.12 ± 0.17 meq/kg (50 mg/l). PVs of hemp oil with pomegranate extract were 16.1 ± 0.09 meq/kg (30 mg/l) and 15.76 ± 0.13 meq/kg (50 mg/l). PVs of hemp oil with green tea extract were 15.23 ± 0.05 (30 mg/l) and 14.55 ± 0.08 meq/kg (50 mg/l). PV of hemp oil with vitamin E was 12.14 ± 0.03 meq/kg.
The peroxide value characterizes the amount of hydro-peroxides created over the primary phase of oxidative rancidity of oils and fats [29]. A higher PV implicates a lower oxidative stability [28]. According to the Codex Alimentarius Commission (1999), PV of refined oils cannot exceed 10 meq/kg, PV of cold pressed virgin oils cannot exceed 15 meq/kg. According to Rossel [33], fresh refined oil must have a PV < 1 meq/kg. However, some oils acquired an off-flavour after refining PVs up to 10 meq/kg at storage condition. PV indicates good relation with flavor scores. However, PV is restricted to the primary stages of oxidation and gives an indication of the available status of oxidation. It does not demonstrate potential oxidation.
Free fatty acids (FFA) and acidity value (AV). Fig. 2 shows FFA values of the hemp oil samples. By day 24, there was a slightly lower rise in FFA in the herbal and vitamin E samples. The FFA of the blank sample demonstrated a more significant increase, if compared to the other samples. The samples with the 2 g/l concentration of vitamin E had the minimum FFA content by the end of the storage period. FFA values of the sample with rosemary extract (30 mg/l, 50 mg/l) were 0.65 ± 0.02 (% oleic acid) and 0.64 ± 0.01 (% oleic acid), respectively. The FFA values of the sample with pomegranate extract (30 mg/l, 50 mg/l) were 0.74 ± 0.03 (% oleic acid) and 0.72 ± 0.02 (% oleic acid), respectively. The FFA values of the sample with green tea extract (30 mg/l, 50 mg/l) were 0.7 ± 0.01 (% oleic acid) and 0.69 ± 0.02 (% oleic acid), respectively. The FFA values of the sample with vitamin E was 0.61 ± 0.03 (% oleic acid) by the end of the storage period. The FFA value of the control sample was 0.82 ± 0.01 (% oleic acid). The results were not significantly different (p < 0.05) from the control sample by day 24.
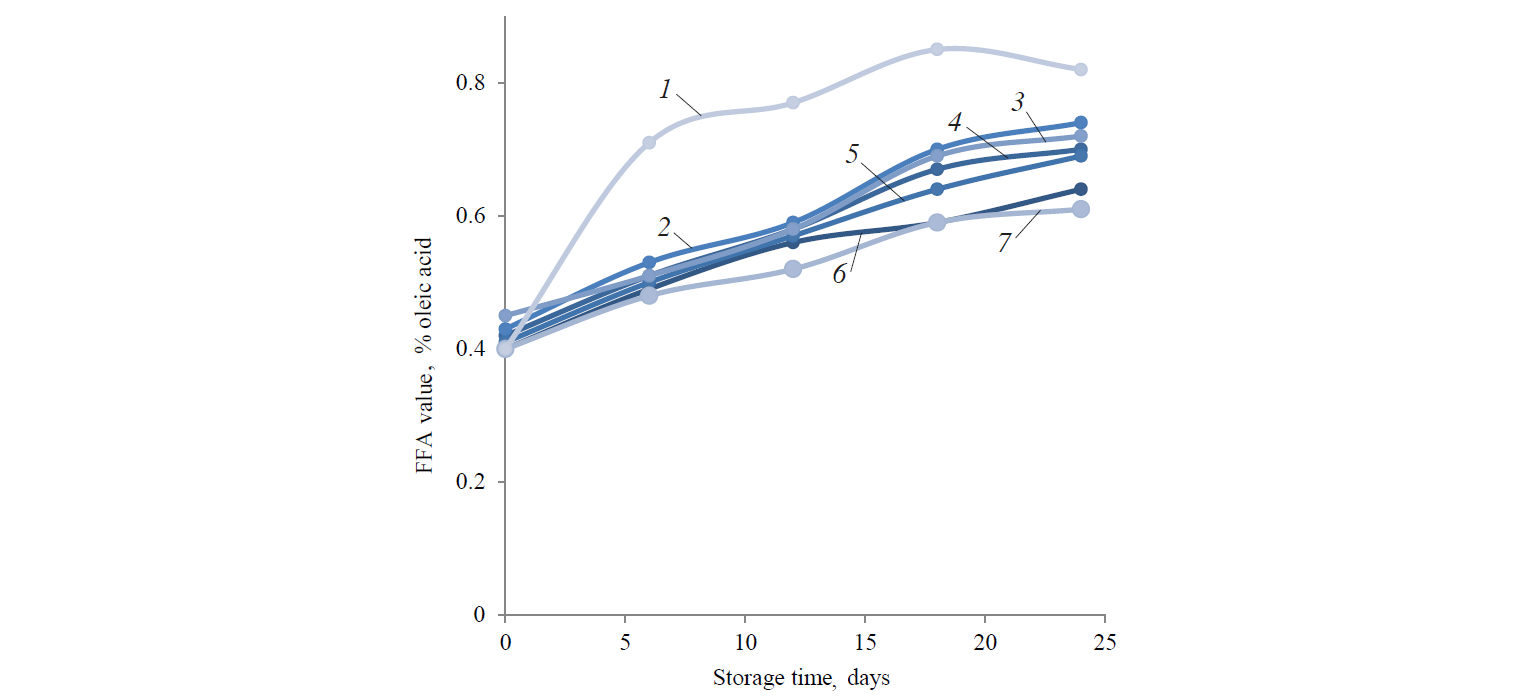
1 – control; 2 – pomegranate extract 30 mg/l; 3 – pomegranate extract 50 mg/l; 4 – green tea extract 30 mg/l;
5 – green tea extract 50 mg/l; 6 – rosemary extract 50 mg/l; 7 – vitamine E 2 g/l.
Fig. 3 shows the AVs of the hemp oil samples. At the beginning, AVs of the samples were not significantly different (p < 0.05) compared to the control sample. By day 24, AV of the control sample was 1.64 ± 0.01 mg KOH/g oil. The vitamin E sample demonstrated the lowest AV (1.28 ± 0.04 mg KOH/g oil). Compared to the blank sample, AVs increased slightly during the storage. The rosemary sample AVs were 1.32 ± 0.05 (30 mg/l) and 1.3 ± 0.06 (50 mg/l) mg KOH/g oil. The green tea AVs were 1.33 ± 0.02 (30 mg/l) and 1.32 ± 0.01 (50 mg/l) mg KOH/g oil. The pomegranate AVs were 1.36 ± 0.03 (30 mg/l) and 1.34 ± 0.02 (50 mg/l) mg KOH/g oil by the end of the storage period.
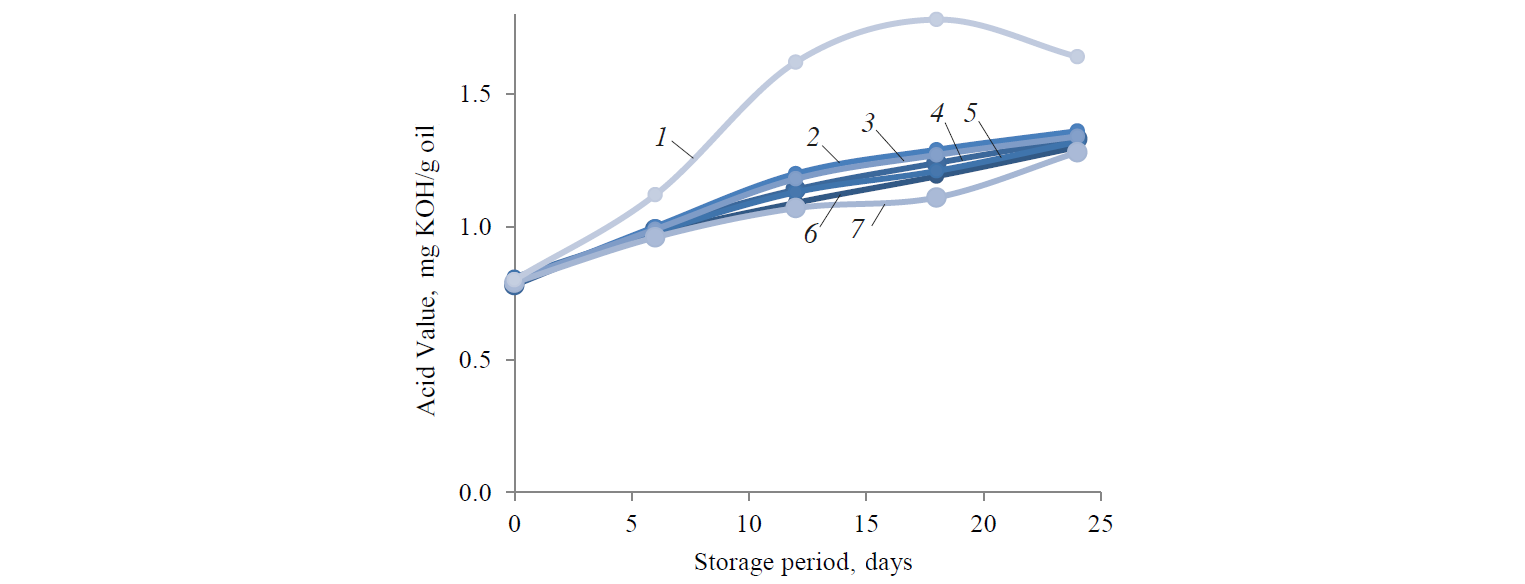
1 – control; 2 – pomegranate extract 30 mg/l; 3 – pomegranate extract 50 mg/l; 4 – green tea extract 30 mg/l;
5 – green tea extract 50 mg/l; 6 – rosemary extract 50 mg/l; 7 – vitamine E 2 g/l.
FFA value indicates hydrolysis of fats, more specifically, the existence of FFAs. FFAs appear because of the hydrolysis of triglycerides and could be supported by humidity content [30]. The FFA content of the samples increased during the storage period. FFA of the control sample demonstrated a more significant increase if compared with the other samples.
Fatty acid composition. The changes in the fatty acid compositions reveal the oxidative constancy and nutritional properties of oils. Table 2 shows the fatty acid composition of the hemp oil samples on day 0 and day 24. All the samples were found to contain similar amounts of specific fatty acids, monounsaturated fatty acids (MUFAs), polyunsaturated fatty acids (PUFAs), and saturated fatty acids (SFAs). Linoleic acid (C18:2) and α-Linolenic acid (C18:3) predominated. The primary SFA content in the control sample was 10.67%. The levels of the SFA, and MUFA increased in all the samples by day 27. Some changes were considerable, while others were insignificant.
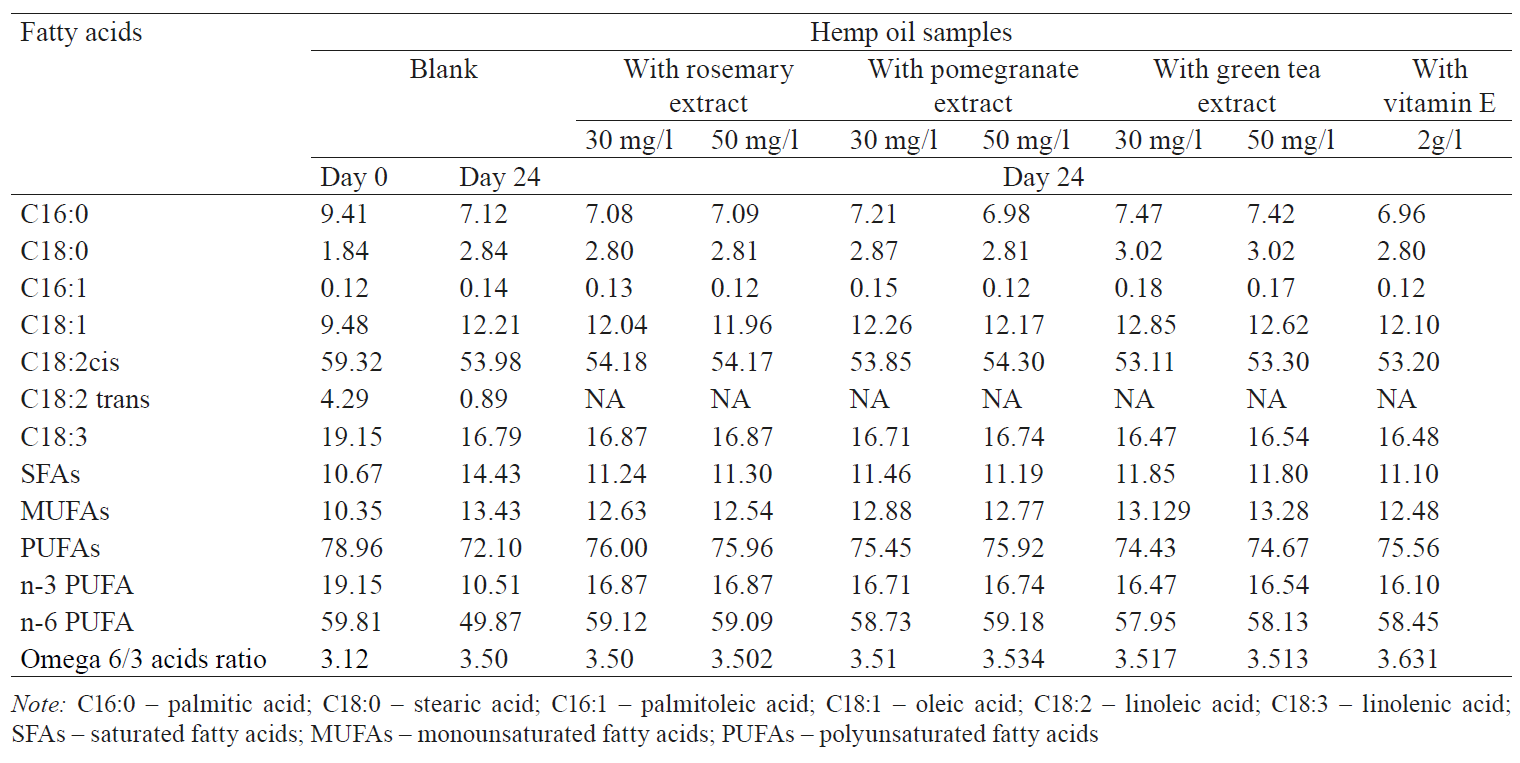
PUFA decreased for all the samples from day 0 to day 24. Vitamin E and natural extracts protected the unity of unsaturated fatty acids, if compared to the blank sample. According to Gargouri et al., the unsaturated fatty acids of the oils easily oxidized [17]. An increase in the number of double bonds in unsaturated fatty acids reduced the oxidative constant [8]. The addition of rosemary, green-tea, pomegranate, and vitamin E into oils can be an applicable and effective attempt to preserve the oil from oxidation during storage. Furthermore, natural extracts offer oil industry a novel opportunity to protect unsaturated fatty acids. Thus, vitamin E, rosemary, pomegranate, and green tea extracts provide extra conservation to vegetable oils and fats and improve their nutritional values.
ВЫВОДЫ
While being one of the oldest cultivated plants in history, hemp (Cannabis sativa L.) still remains one of the most popular herbs in various branches of industry. Hemp seed oil possesses very important ingredients that have a beneficial effect on human health, e.g. various antioxidants, Omega-3 and Omega-6 fatty acids, etc. However, hemp oil is very unstable against oxidation due to its high content of PUFAs. Rosemary, green tea, pomegranate extracts, and vitamin E can have a positive effect on hemp oil quality. The Rancimat method and other chemical tests proved the positive effect of these extracts on the oxidative stability of hemp oil. The experiment measures the changes in PV, FFA, AV, and fatty acid composition. Thus, natural ingredients raise the quality of oils and can be recommended for oil manufacturers.
КОНФЛИКТ ИНТЕРЕСОВ
The authors declare that there is no conflict of interest related to this article.
БЛАГОДАРНОСТИ
The authors would like to express their deepest gratitude to Vilma Speičienė (Kaunas Universtiy of Technology) for her support of the experiment and fruitful discussions.
ФИНАНСИРОВАНИЕ
This research was completed without financial support.
СПИСОК ЛИТЕРАТУРЫ
- AOCS. Official methods and recommended practices of the American Oil Chemist’s Society (5th ed.). Washington, 1997.
- AOCS. Official Methods and Recommended Practices of the American Oil Chemists’ Society (5th ed). Champaign: AOCS Press Publ., 1999.
- AOCS. Official Methods and Recommended Practices of the American Oil Chemists’ Society. Champaign: AOCS Press Publ., 2003.
- Astrup A., Dyerberg J., Elwood P., et al. The role of reducing intakes of saturated fat in the prevention of cardiovas- cular disease: Where does the evidence stand in 2010? The American Journal of Clinical Nutrition, 2011, vol. 93, no. 4, pp. 684–688. DOI: https://doi.org/10.3945/ajcn.110.004622.
- Rubio-Rodríguez N., Beltrán S., Jaime I., et al. Production of omega-3 polyunsaturated fatty acid concentrates: A review. Innovative Food Science and Emerging Technologies, 2010, vol. 11, no. 1, pp. 1–12. DOI: https://doi. org/10.1016/j.ifset.2009.10.006.
- Bhat Z.F., Kumar S., and Kumar P. Effect of Aloe vera on the lipid stability and storage quality of chicken nuggets.Nutrition and Food Science, 2015, vol. 45, no. 1, pp. 54–67. DOI: https://doi.org/10.1108/NFS-04-2014-003.
- Choe E. and Min D.B. Mechanisms of Antioxidants in the Oxidation of Foods. Comprehensive Reviews in Food Science and Food Safety, 2009, vol. 8, no. 4, pp. 345–358. DOI: https://doi.org/10.1111/j.1541-4337.2009.00085.x.
- Choe E. and Min D.B. Mechanisms and Factors for Edible Oil Oxidation. Comprehensive Reviews in Food Science and Food Safety, 2006, vol. 5, no. 4, pp. 169–186. DOI: https://doi.org/10.1111/j.1541-4337.2006.00009.x.
- Codex Alimentarius Commission. Joint FAO/WHO Food Standards Programme. Geneva, Switzerland, 2001. 197 p.
- Cordeiro A.M.T.M., Medeiros M.L., Santos N.A., et al. Rosemary (Rosmarinus officinalis L.) extract. Journal of Ther- mal Analysis and Calorimetry, 2013, vol. 113, no. 2, pp. 889–895. DOI: https://doi.org/10.1007/s10973-012-2778-4.
- Cordeiro A.M.T.M., Medeiros M.L., Silva M.A.A.D., et al. Rancimat and PDSC accelerated techniques for evaluation of oxidative stability of soybean oil with plant extracts. Journal of Thermal Analysis and Calorimetry, 2014, vol. 114, no. 2, pp. 827–832. DOI: https://doi.org/10.1007/s10973-013-3036-0.
- Da Silva A. and Jorge N. Influence of Lentinus edodes and Agaricus blazei extracts on the prevention of oxidation and retention of tocopherols in soybean oil in an accelerated storage test. Journal of Food Science and Technology, 2014, vol. 51, no. 6, pp. 1208–1212. DOI: https://doi.org/10.1007/s13197-012-0623-1.
- Decker E.A., Elias R.J., and McClements D.J. Oxidation in foods and beverages and antioxidant applications. Ox- ford: Woodhead Publ., 2010. 432 p.
- Scientific opinion of the panel on dietetic products, nutrition and allergies on a request from European Commission related to labelling reference intake values for n-3 and n-6 polyunsaturated fatty acids. The EFSA Journal, 2009, no. 1176, pp. 1–11.
- Frank J., Geil J.V., and Freaso R. Automated determination of oxidation stability of oil and fatty products. Food Tech- nology, 1982, vol. 36, no. 6, pp. 71–76.
- Frega N., Mozzon M., and Lercker G. Effects of free fatty acids on oxidative stability of vegetable oil. Journal of the American Oil Chemists’ Society, 1999, vol. 76, no. 2, pp. 325–329. DOI: https://doi.org/10.1007/s11746-999-0239-4.
- Gargouri B., Zribi A., and Bouaziz M. Effect of containers on the quality of Chemlali olive oil during storage. Journal of Food Science and Technology, 2015, vol. 52, no. 4, pp. 1948–1959. DOI: https://doi.org/10.1007/s13197-014-1273-2.
- Gil M.I., Tomás-Barberán F.A., Hess-Pierce B., Holcroft D.M., and Kader A.A. Antioxidant Activity of Pomegranate Juice and Its Relationship with Phenolic Composition and Processing. Journal of Agricultural and Food Chemistry, 2000, vol. 48, no. 10, pp. 4581–4589. DOI: https://doi.org/10.1021/jf000404a.
- Hui Y.H. and Chandan R. Handbook of food products manufacturing. New Jersey: John Wiley and Sons Publ., 2007. 1221 p.
- ISO 3960:2010. Animal and vegetable fats and oils. – Determination of peroxide value. – Iodometric (visual) endpoint determination. 2010.
- ISO 660-2009. Animal and vegetable fats and oils – Determination of acid value and acidity. 2009.
- Kolanowski W., Jaworska D., and Weißbrodt J. Importance of instrumental and sensory analysis in the assessment of oxidative deterioration of omega-3 long-chain polyunsaturated fatty acid-rich foods. Journal of the Science of Food and Agriculture, 2007, vol. 87, no. 2, pp. 181–191. DOI: https://doi.org/10.1002/jsfa.2733.
- Latimer G.W. Official Methods of Analysis of AOAC International. Vol. 2. Gaithersburg, Maryland: AOAC Interna- tional Publ., 2012.
- Li Y., Zhang Y., Wang M., Jiang L., and Sui X. Simplex-Centroid Mixture Design Applied to the Aqueous Enzyma- tic Extraction of Fatty Acid-Balanced Oil from Mixed Seeds. Journal of the American Oil Chemists’ Society, 2013, vol. 90, no. 3, pp. 349–357. DOI: https://doi.org/10.1007/s11746-012-2180-1.
- Mathäus B. Determination of the oxidative stability of vegetable oils by rancimat and conductivity and chemilu- minescence measurements. Journal of the American Oil Chemists’ Society, 1996, vol. 73, no. 8, pp. 1039–1043. DOI: https://doi.org/10.1007/BF02523413.
- Maqsood S., Benjakul S., Abushelaibi A., and Alam A. Phenolic compounds and plant phenolic extracts as natural antioxidants in prevention of lipidoxi – dation in sea food: A detailed review. Comprehensive Reviews in Food Science and Food Safety, 2014, vol. 13, no. 6, pp. 1125–1140. DOI: https://doi.org/10.1111/1541-4337.12106.
- Embuscado M.E. Spices and herbs: Natural sources of antioxidants – a mini review. Journal of Functional Foods, 2015, vol. 18, pp. 811–819. DOI: https://doi.org/10.1016/j.jff.2015.03.005.
- Naghshineh M., Ariffin A.A., Ghazali H.M., Mirhosseini H., and Mohammad A.S. Effect of saturated/unsaturated fatty acid ratio on physicochemical properties of palm olein-olive oil blend. Journal of the American Oil Chemists’ Society, 2010, vol. 87, no. 3, pp. 255–262. DOI: https://doi.org/10.1007/s11746-009-1495-z.
- O’Brien R.D. Fats and Oils: Formulating and Processing for Applications. Lancaster, Pennsylvania: Technomic Pub- lishing Company, 1998.
- O’Keefe S.F. and Pike O.A. Fat characterization. In: Nielsen S.S. (ed.) Food Analysis (4 th Ed.). New York: Springer Science + Business Media Publ., 2010. 239–260 pp. DOI: https://doi.org/10.1007/978-1-4419-1478-1_14.
- Parker T.D., Adams D.A., Zhou K., Harris M., and Yu L. Fatty acid composition and oxidative stability of cold- pressed edible seed oils. Journal of Food Science, 2006, vol. 68, no. 4, pp. 1240–1243. DOI: https://doi. org/10.1111/j.1365-2621.2003.tb09632.x.
- Przybylski R. Hemp: revival of a forgotten oilseed crop. Lipid Technology, 2006, vol. 18, no. 1, pp. 58–62.
- Rossell J.B. Measurement of rancidity. In: Allen J.C. and Hamilton R.J. (eds) Rancidity in Foods. Glasgow: Blackie Academic and Professional Publ., 1994. pp 22–53.
- Shahidi F. and Zhong Y. Lipid oxidation and improving the oxidative stability. Chemical Society Reviews, 2010, vol. 39, no. 11, pp. 4067–4079. DOI: https://doi.org/10.1039/b922183m.
- Srinivasan K. Antioxidant Potential of Spices and Their Active Constituents. Critical Reviews in Food Science and Nutrition, 2014, vol. 54, no. 3, pp. 352–372. DOI: https://doi.org/10.1080/10408398.2011.585525.
- Teh S.-S. and Birch J. Physicochemical and quality characteristics of cold-pressed hemp, flax and canola seed oils. Journal of Food Composition and Analysis, 2013, vol. 30, no. 1, pp. 26–31. DOI: https://doi.org/10.1016/j. jfca.2013.01.004.
- Terpinc P., Bezjak M., and Abramoviˇc H. A kinetic model for evaluation of the antioxidant activity of several rosemaryextracts. Food Chemistry, 2009, vol. 115, no. 2, pp. 740–744. DOI: https://doi.org/10.1016/j.foodchem.2008.12.033.
- Babu A., and Liu D. Green Tea Catechins and Cardiovascular Health: An Update. Current Medicinal Chemistry, 2008, vol. 15, no. 18, pp. 1840–1850. DOI: https://doi.org/10.2174/092986708785132979.
