

Аннотация
To determine the absorbed doses of ionizing radiation of food, it is recommended to use the method of electron paramagnetic resonance (EPR), but, at the same time, determination method improvement is necessary. The objective of the study is improvement of the technique of sample preparation and analysis of the obtained results by means of quantitative estimation of the absorbed doses of ionizing radiation on the basis of EPR spectrum parameters, case study is irradiated meat and fish. Bone tissue samples (BTS) of meat and fish were subject to irradiation processing with ionizing radiation in the following doses: 3, 9, 10, 12 kGy with UELR-10-10C2 linear electron accelerator with energy up to 10 MeV. Study of the irradiated samples was performed with the automated portable X-band EPR spectrometer of the brand Labrador Expert. The improved technique of preparation of bone tissue samples for analysis differs with the increased duration of drying - up to 24 hours, which allows to obtain the stable EPR spectra in multiple replications. Correlation dependence of EPR signal area increase and irradiation dose is determined: for beef it is 0.98, for pork it is 0.98, for poultry it is 0.996 and for fish it is 0.99. Strong statistical relationship between the irradiation dose and the absorbed dose is determined: for beef it is 0.94, for pork it is 0.94, for poultry it is 0.96 and for fish it is 0.94. Processing of EPR spectra of meat and fish BTS by means of amplitudecalculation and EPR peak width and area allows to determine the absorbed dose with a high degree of confidence (p ≤ 0.05). For bone tissue of pork, beef, poultry and fish, irradiated with the dose of 12 kGy, amplitude is 4.8∙10-4, 5.08∙10-4, 1.11∙ 10-4 and 3.44∙10-5 p.u., peak area is - 6.73∙ 10-3, 6.94∙10-3, 3.68∙10-3 and 3.07∙10-3.Ключевые слова
Ionizing radiation, bone tissue samples, meat, fish, irradiation doseВВЕДЕНИЕ
According to the Food and Agriculture Organization of the United Nations (FAO), during the entire supply chain from agricultural raw materials processing and food production to retail outlets, quantitative and qualitative losses of food are significant, and their reduction is in priority for enterprises of food and processing industry [1].
According to the data of 2016, in Russia cooled products have a lead in the total amount of production: beef has a percentage of 80.3% in the total amount of production, pork - 94.2%, poultry has 64.1% and fish - 22.3%. The mentioned food products are perishable [2, 3], and their losses during storage are 0.1–0.2% in the total amount of production. In this regard, improvement of traditional methods and development of new ones of meat and fish preservation is a relevant issue of scientific researches and practical recommendations.
Herewith, processing with ionizing radiation of agricultural raw materials and food may be one of the most modern and promising methods of preservation. The ionizing radiation sources are: γ-emitting radionuclides 60Co or 137Cs, X-rays with radiation energy of or below 5 MeV and electron beams with radiation energy of or below 10 MeV.
The analysis of literature suggests that low doses (0.25–0.5 kGy) of ionizing radiation inhibit the growth of mesophilic aerobic, facultative aerobic microorganisms, coliform bacteria, fungi and yeast [4]; the dose of 3 kGy of meat and meat products prolongs their shelf life to 14 days at a storage temperature of 0–3°C; the dose of ≥ 4.5 kGy reduces microbiological content [5–7], but leads to formation of radiolysis products, reduction of fatty acids and thiamine (B1) concentration and pH displacement to acid medium, which leads to excessive oxidation and appearance of undesirable flavour in fish [8].
The most important advantages of food irradiation processing over the traditional methods are significant increase in their shelf life, as well as low energy and money costs [9, 10].
At the same time, there is no consensus among scientists over the recommended doses of meat and fish irradiation, as well as over justification for large-scale use of irradiation processing of food products and food raw materials.
Despite this fact, since 1992 more than 60 countries allowed processing with ionizing radiation of meat and fish with a maximum dose of absorbed radiation of 10 kGy - it is a safe dose, determined by the decision of the joint Committee of Experts of FAO/International Atomic Energy Agency (IAEA)/World Health Organization (WHO). Irradiated food products are identified by marking with the Radura symbol.
Scientists found that under irradiation free radicals and radiotoxins may be formed in the meat bone [11, 12]. To identify and establish the fact of irradiation of food raw materials and food products, the method of electron paramagnetic resonance is used, which allows to establish only the fact of irradiation/non-irradiation of meat and meat products, containing bone tissue, but not the irradiation dose. In this regard, improvement of the technique of sample preparation and analysis of the obtained results for determination of the absorbed dose is opportune and relevant. In practice the method of electron paramagnetic resonance is used. The authors of the sources [13, 14] state that the establishment of the fact of irradiation with EPR-method is possible due to the presence of long-lasting free radicals, especially of the radical anions CO2−, CO33−, SO2− and SO3−. The authors of the source [15] used EPR for detection of irradiation in the bones of agricultural animals and poultry, fish and mollusc shell, and found that the EPR signals are stable in mammal bones and mollusc shells.
Carrying out the research on irradiated seafood and poultry in different ways (thermoluminescence, radioluminescence and electron paramagnetic resonance methods), the author of the source [16] argues that these methods are comparable, but the use of the EPR method is more effective for solids.
The experimental studies, mentioned in the source [15], show that in bone tissue of irradiated fish the intensity of the radiation-induced EPR signal increases at the absorbed dose, as well as non-linear relationship between radiation dose and the height of the EPR signal is determined. The same data were obtained by the authors of this source.
EPR spectroscopy is as follows: under the influence of ionizing radiation there is a chain reaction of excitation of molecules with the appearance of highly active free radicals, and the analytic signal appears - EPR spectrum, which is recorded with spectrometer.
It is stated that the electron paramagnetic resonance method allows to compare the spectra before and after irradiation of poultry bone tissue samples. The irradiated bone tissue sample has a pronounced spectrum [17].
A number of researchers found that the intensity of the EPR signal is maintained over time. The authors of the source [18] note that the radiation-induced EPR signal can be detected after 60 days. The authors of the sources [10, 19] found that after 2 years since irradiation, 44–75% of the bone tissue samples retain the original EPR spectrum.
The objective of the study is improvement of the technique of sample preparation and analysis of the obtained results by means of quantitative estimation of the absorbed doses of ionizing radiation on the basis of EPR spectrum parameters, case study is irradiated meat and fish.
ОБЪЕКТЫ И МЕТОДЫ ИССЛЕДОВАНИЯ
Cooled (0- (+2)°С) samples are taken for irradiation (primary sample):
– of beef and pork with a bone from the carcase shoulder after 48 hours since slaughter, with a mass of 2 kg;
– of chicken meat with a bone with a mass of 1.4 kg;
– of fish (Cyprinus carpio) with a mass of 1.5 kg.
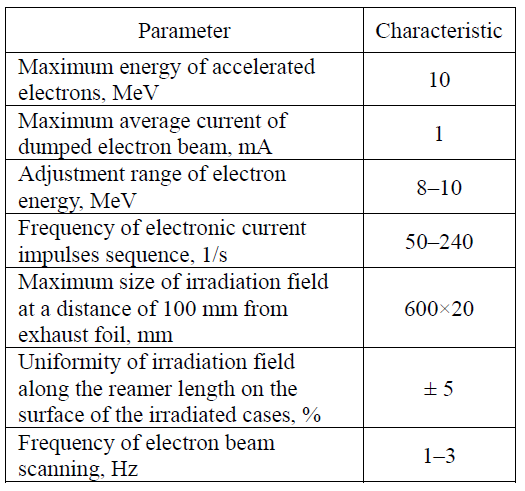
To determine the irradiation absorbed dose, fish and meat samples were subject to irradiation processing with the following doses: 3, 9, 10, 12 kGy in the Centre of Radiation Sterilization of the Ural Federal University named after the first President of Russia B.N. Yeltsin with UELR-10-10C2 linear electron accelerator (Russia) with energy up to 10 MeV, designed for irradiation of food products and medical instruments. The main characteristics of the electron beam are indicated in Table 1. To control the dose after irradiation, the method of photospectroscopy was used by means of measuring optical density of the irradiated polymer film on the spectrophotometer at a wavelength of 512 nm.
We have improved the method of sample preparation of bone tissue samples (BTS) to determine the absorbed dose of ionizing radiation: fish tubular bones and spine are cleaned from muscle tissue, the middle part of the bone with a length of 3–10 cm is cut out, and then they are fully cleaned with a scalpel from the remnants of meat, tendons, membranes and bone marrow. The bone is washed with distilled water and dried with filter paper. Then it is dried in a dryer at a temperature of 39–40°C during 24–30 hours until the residual moisture of 3–4 %, cooled, incubated at a room temperature during 30 40 minutes and crushed to the size of separate fragments up to 0.5x0.5x0.5 mm with a total mass of at least 0.05 g.
The mentioned technique of BTS preparation for research differs from the existing one with an increase in drying duration up to 24–30 hours, which allows to obtain more stable EPR spectra and, consequently, the higher reliability of the results at a lower error of the received data.
BTS are weighed in grams with an accuracy of the third decimal digits and are placed in marked glass phials. EPR spectrum is determined immediately after the preparation of the samples under research.
The choice of the dosimetry system (equipment) for determination of the absorbed dose is associated with the fact that one of the most effective and practicable methods of investigation and identification of radicals, induced by radiation, is electron paramagnetic resonance spectroscopy. Bone tissue density, structure and composition are heterogeneous, the variations of the absorbed dose differ on the surface, inside and in different parts of the sample, therefore the use of precisely the EPR method of the average sample allows to obtain reliable and repeatable results. EPR spectrometry was performed with the automated portable X-band EPR spectrometer of the brand Labrador Expert (Russia), which is the working dosimeter.
The main technical characteristics of EPR spectrometer are indicated in Table 2.
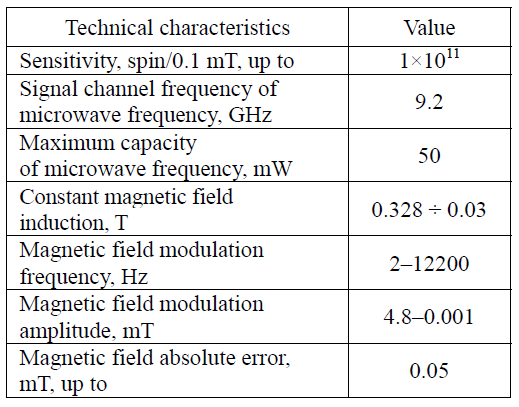
Quartz vessel with a height of 10.0 ± 0.5 mm was filled with BTS; then BTS were placed in the resonator operating area at a set fixed depth. BTS irradiation was performed at a temperature of 18–22°C indoors, atmospheric pressure of 746–748 mm Hg and air humidity of 45–59%. Studies were performed in tenfold replication at the irradiation frequency of 9200 MHz, in the range of magnetic field from 3000 to 3500 Gs with selection of optimum values of conversion time, modulation amplitude and gain. To normalize the signal-to-noise index, microwave frequency capacity was set between 4 and 6 dBm. Reference sample (high-stability reference) was used for comparison of signals: the number of paramagnetic centres (PC) on the basis of manganese oxide (with concentration of paramagnetic centres of 5.9·1014 spin/MT). As control samples, BTS of non-irradiated products were used, in which no EPR spectra were fixed.
Measurement and processing of EPR spectra was carried out using special computer programs to the EPR spectrometer, which allowed to set the parameters of the EPR spectrum for each sample of bone tissue. EPR spectrum parameters were shown in the automatic mode on the computer screen. The following parameters of radiation signal were determined: g-factor; amplitude; signal width and area. The same parameters with the same units of measurement are determined on the German spectrometers Bruker, which allows to compare the results of measurements.
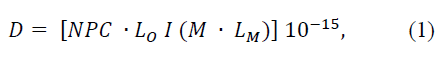
In the experiment the value, used for assessment of the degree of ionizing radiation impact on the BTS under study (the value is assigned in radiation process), was considered as radiation dose; energy of ionizing radiation, absorbed by irradiated BTS (was determined according to formula (1)), was considered as absorbed dose.
Formula (1) was used for determination of the absorbed dose of bone tissue samples.
The research results are analysed with the method of analysis of variance with the use of Student coefficient.
РЕЗУЛЬТАТЫ И ИХ ОБСУЖДЕНИЕ
After irradiation of pork samples with the dose of 3 kGy (g-factor 2.0047 ± 0.0002) in the field range of 3260–3285 Gs, peak amplitude is (3.06 ± 0.03)·10-5 p.u., signal width is 11.66 ± 0.63 Gs and peak area is (5.75 ± 0.04)·10-4 p.u. (p ≤ 0.05); with the dose of 9 kGy (g-factor 2.0035 ± 0.0001) at width signal decrease up to 9.81 ± 0.15 Gs or by 15.8%, there is an increase in peak amplitude either up to (2.15 ± 0.032)·10-4 p.u. or 7.0-fold-increase, in signal area there is an increase either up to (3.84 ± 0.21)·10-3 p.u. or 6.7-fold-increase (p ≤ 0,05); with the dose of 10 kGy (g-factor 2.0025 ± 0.0001) signal amplitude increased by 24.2% up to (2.67 ± 0.02)·10-4 p.u. in comparison with the pork samples, irradiated with the dose of 9 kGy, and peak area increased by 11.1% up to (4.27 ± 0.01)·10-3 p.u.; peak width decrease by 9.8% up to 8.85 ± 0.02 Gs (p ≤ 0.05) was indicated.
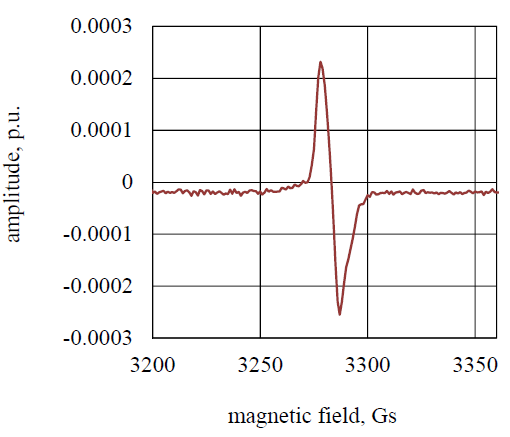
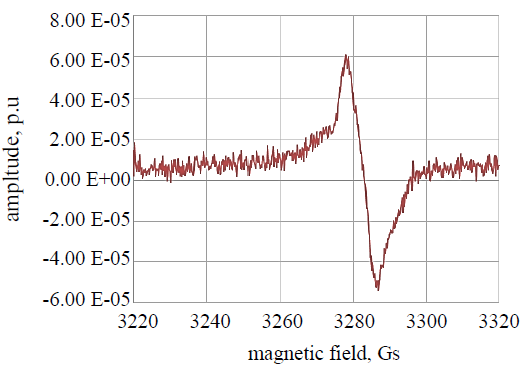
Pork samples irradiation with the dose of 12 kGy (Fig. 1) led to amplitude increase by 79.8% up to (4.8 ± 0.01)·10-4 p.u. and peak area increase by 57.6% up to (6.73 ± 0.29)·10-3 p.u. at signal width decrease by 5.3% up to 8.38 ± 0.02 Gs (p ≤ 0.05) in comparison with pork, irradiated with the dose of 10 kGy.
Beef samples, irradiated with the dose of 3 kGy (g-factor 2.0028 ± 0.0001) in the field range of 3260–3300 Gs, had peak amplitude of (2.78 ± 0.04)·10-5 p.u. and signal width of 10.51 ± 0.01 Gs. Peak area is (5.14 ± 0.05)·10-4 p.u. (p ≤ 0.05).
After beef samples irradiation with the dose of 9 kGy (g-factor 2.0027 ± 0.0001), there is a 8.1-foldincrease in peak amplitude up to (2.24 ± 0.03)·10-4 p.u. at width decrease by 18.7% up to 8.54 ± 0.18 Gs and 7.7-fold-increase of peak area up to (3.95 ± 0.03)·10-3 p.u. (p ≤ 0.05).
Analysis of beef samples, irradiated with the dose of 10 kGy (g-factor 2.0027 ± 0.0001), showed that at signal amplitude increase by 22.3% up to (2.74 ± 0.08)·10-4 p.u. and width by 0.8% up to 8.47 ± 0.08 Gs, signal area increase is indicated by 8.9% up to (4.3 ± 0.01)·10-3 p.u. (p ≤ 0.05) in comparison with the beef samples, irradiated with the dose of 9 kGy.
Beef BTS irradiation with the dose of 12 kGy (Fig. 2) leads to 1.9-fold-increase in EPR signal peak amplitude up to (5.08 ± 0.01)·10-4 p.u. and peak area increase by 61.4% up to (6.94 ± 0.02)·10-3 p.u. at signal width decrease by 1.8% up to (8.32 ± 0.12) Gs (p ≤ 0.05) in comparison with beef, irradiated with the dose of 10 kGy.

After poultry bone tissue samples irradiation with the dose of 3 kGy (g-factor 2.0046 ± 0.0001) in the field range of 3260–3290 Gs, peak amplitude is (1.67 ± 0.07)·10-4 p.u., signal width is 10.54 ± 0.40 Gs and peak area is (4.30 ± 0.04)·10-3 p.u. (p ≤ 0.05); with the dose of 9 kGy (g-factor 2.0048 ± 0.0001) there is a change in EPR signals parameters in comparison with the poultry bone tissue samples, irradiated with the dose of 3 kGy: 5.9-fold-increase in peak amplitude up to (9.92 ± 0.01)·10-5 p.u. at signal width increase by 14.9% up to 12.01 ± 0.03 Gs and 6.7-fold-increase in peak area up to (2.88 ± 0.11)·10-3 p.u. (p ≤ 0.05); with the dose of 10 kGy (g-factor 2.0051 ± 0.0001) signal peak amplitude increases by 0.6% up to (9.98 ± 0.11)·10-5 p.u. and peak area increases by 6.9% up to (3.08 ± 0.01)·10-3 p.u. in comparison with the poultry BTS, irradiated with the dose of 9 kGy; peak width increase is indicated by 6.7% up to 12.09 ± 0.05 Gs (p ≤ 0.05).
Poultry BTS irradiation with the dose of 12 kGy (Fig. 3) leads to 1.1-fold-increase in peak amplitude up to (1.11 ± 0.01)·10-4 p.u. and peak area increase by 20% up to (3.68 ± 0.04)·10-3 p.u. at signal width increase by 1.7% up to 12.29 ± 0.01 Gs (p ≤ 0.05) in comparison with the poultry BTS, irradiated with the dose of 10 kGy.
After fish samples irradiation with the dose of 3 kGy (g-factor 2.0047±0.0001) in the field range of 3260–3290 Gs, peak amplitude was (6.29 ± 0.01)·10-6 p.u., signal width was 9.81 ± 0.02 Gs and peak area was (4.07 ± 0.04)·10-4 p.u. (p ≤ 0.05).
Fish samples irradiation with the dose of 9 kGy (g-factor 2.0032 ± 0.0001) leads to change in EPR spectrum parameters: 5.1-fold-increase in peak amplitude is indicated up to (3.19 ± 0.01)·10-5 p.u., as well as increase in width by 38.1% up to 13.55 ± 0.01 Gs and 6.26-fold-increase in peak area up to (2.55 ± 0.01)·10-3 p.u. (p ≤ 0.05) in comparison with the fish BTS, irradiated with the dose of 3 kGy.
As a result of irradiation of fish BTS with the dose of 10 kGy (g-factor 2.0047 ± 0.0001), peak amplitude increase is indicated by 1.9% up to (3.25 ± 0.01)·10-5 p.u., as well as increase in signal width by 1.7% up to 13.78 ± 0.01 Gs and in peak area by 2.7% up to (2.62 ± 0.01)·10-3 p.u. (p ≤ 0.05) in comparison with fish BTS, irradiated with the dose of 9 kGy.
Increase in all parameters is indicated in fish BTS, irradiated with the dose of 12 kGy (Fig. 4) in comparison with fish BTS, irradiated with the dose of 10 kGy: of peak amplitude by 5.8% up to (3.44 ± 0.07)·10-5 p.u., of signal width by 7.0% up to 14.74 ± 0.05 Gs, of peak area by 17.2% up to (3.07 ± 0.01)·10-3 p.u. (p ≤ 0.05).

The results of research of samples of bone tissue of different animals, poultry and fish after processing with ionizing radiation with different doses (3, 9, 10, and 12 kGy) showed different ability to absorb ionizing radiation: cattle and pork bone tissue is the most susceptible of absorption.
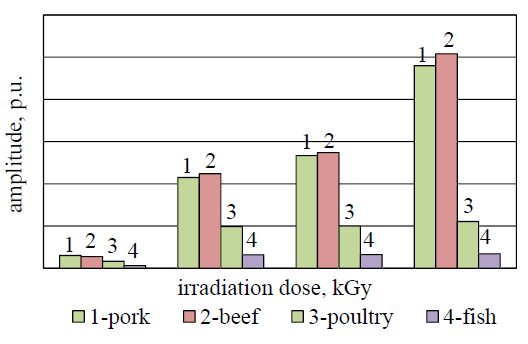
It is stated that the change in EPR signals amplitude of bone tissue samples does not depend linearly on irradiation dose (Fig. 5). EPR signals width has a clear dependence on irradiation dose and decreases with its increase in pork and beef BTS. EPR signals width increases in poultry and fish BTS (Fig. 6): a high degree is identified of correlation dependence of EPR signals width change and irradiation dose: for beef it is 0.97, for pork - 0.99, for poultry - 0.98 and for fish - 0.99.
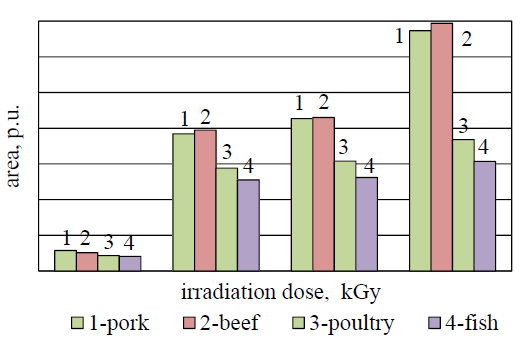
EPR signals area of pork and beef BTS increases significantly with the increase in irradiation dose of 9 kGy. A high correlation degree is identified for all samples: for beef and pork it is 0.98, for fish and poultry - 0.99 and 0.996 respectively (Fig. 7).
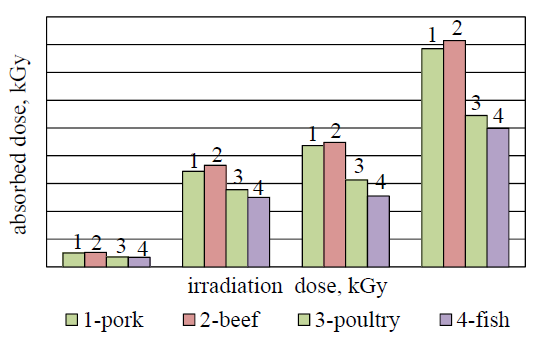
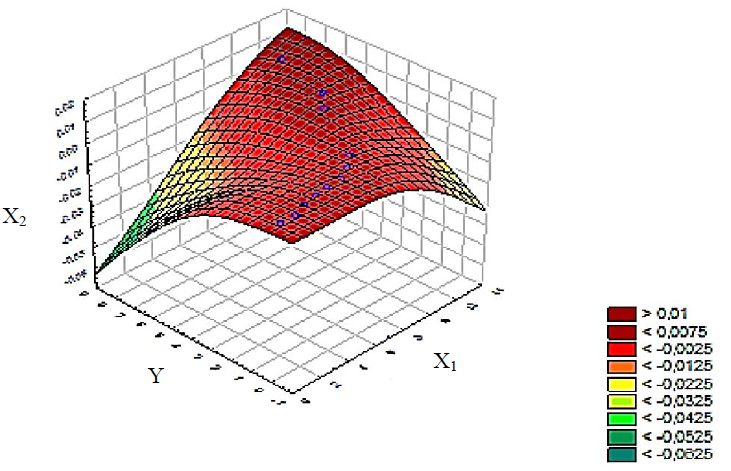
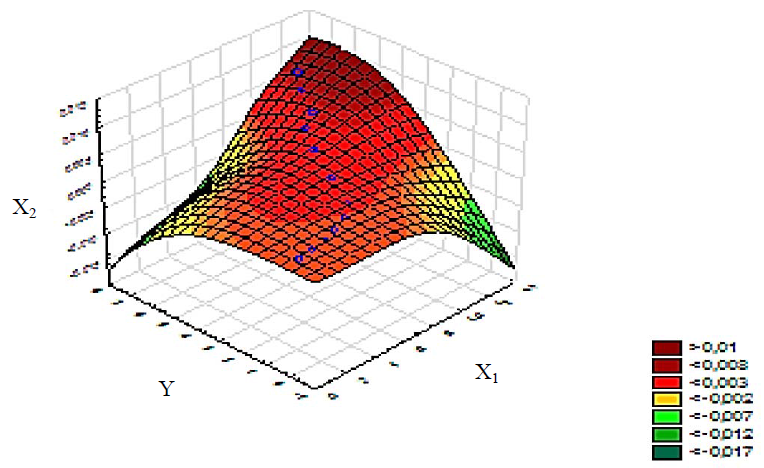
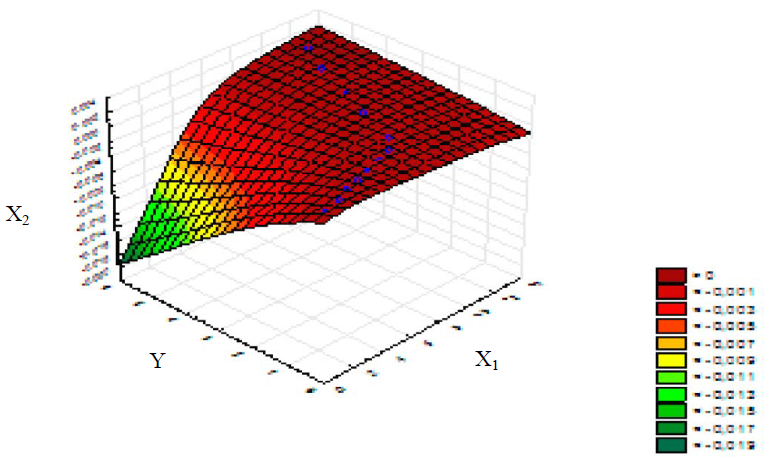
At increase in the irradiation dose the absorbed dose has a clear tendency towards an increase in all BTS (Fig. 8). For pork the multiple correlation coefficient (absorbed dose-irradiation dose-signal area) is 0.98; for beef - 0.99; for poultry - 0.94; for fish - 0.96. Dependence of change in the absorbed dose and irradiation dose, as well as signal area, for pork, beef, poultry and fish BTS, is indicated in Figures 9–12.

As a result of the conducted researches it is stated that at increase in irradiation dose of pork BTS from 3 kGy to 12 kGy, there is a 15.7-fold-increase in amplitude and 11.7-fold-increase in area, EPR signal width reduces up to 28.1% (p ≤ 0.05); in beef BTS the parameters change in the following way: amplitude increases 18.3 times, area - 13.5 times, peak width by 20.8% (p≤0.05). In poultry BTS there was an increase in all EPR signal parameters: amplitude increases 6.7 times, area - 8.6 times, peak width by 16.7% (p ≤ 0.05). Similarly there was a change in fish BTS parameters: respectively amplitude increased 5.5 times, peak area - 7.5 times, peak width by 50.3% (p ≤ 0.05).
Experiments showed that despite processing bone tissue samples with identical doses of ionizing radiation, the absorbed dose depends on the type of vertebrates, the tissue structure of the sample, waterholding capacity and on other factors. Pork and beef samples most reacted to the change in irradiation dose by all studied parameters. Thus, at increase in irradiation dose amplitude increases, peak width decreases and, consequently, area increases.
Stable correlation dependence of EPR signal area and irradiation dose is fixed: for beef and pork it is 0.99, for poultry and fish - 0.996 and 0.99 respectively (the strength degree of statistical relationship according to Cheddock is very high). The absorbed dose at increase in irradiation dose increases substantially, which is proved by the area under the EPR spectrum signal line. Correlation coefficient by the absorbed dose is high. It is: 0.94 for beef, pork and fish and 0.96 for poultry.
As a result of the conducted research, the technique of sample preparation is improved, which differs with the increase in duration of bone tissue samples drying up to 24 hours, which allows to obtain the stable EPR spectra in multiple replications. The technique is offered of processing of the obtained results of the irradiated meat and fish EPR spectrum, which allows to determine the absorbed dose of ionizing radiation (permissible variation of signal amplitude, width and area at the level of ± 4% at D›1):
– for pork bone tissue, irradiated with the dose of 3 kGy, amplitude is 3.06·10-5 p.u., width is 11.66 Gs, peak area is 5.75·10-4 p.u.; at the dose of 9 kGy amplitude is 2.15·10-4 p.u., width is 9.81 Gs, peak area is 3.84·10-3 p.u.; at the dose of 10 kGy amplitude is 2.67·10-4 p.u., width is 8.85 Gs, peak area is 4.27·10-3 p.u.; at the dose of 12 kGy amplitude is 4.8·10-4 p.u., width is 8.38 Gs, peak area is 6.73·10-3 p.u.;
– for beef bone tissue, irradiated with the dose of 3 kGy, amplitude is 2.78·10-5 p.u., width is 10.51 Gs, peak area is 5.14·10-4 p.u.; at the dose of 9 kGy amplitude is 2.24·10-4 p.u., width is 8.54 Gs, peak area is 3.95·10-3 p.u.; at the dose of 10 kGy amplitude is 2.74·10-4 p.u., width is 8.47 Gs, peak area is 4.3·10-3 p.u.; at the dose of 12 kGy amplitude is 5.08·10-4 p.u., width is 8.32 Gs, peak area is 6.94·10-3 p.u.;
– for poultry bone tissue, irradiated with the dose of 3 kGy, amplitude is 1.67·10-5 p.u., width is 10.54 Gs, peak area is 4.3·10-4 p.u.; at the dose of 9 kGy amplitude is 9.92·10-5 p.u., width is 12.01 Gs, peak area is 2.88·10-3 p.u.; at the dose of 10 kGy amplitude is 9.98·10-5 p.u., width is 12.09 Gs, peak area is 3.08·10-3 p.u.; at the dose of 12 kGy amplitude is 1.11·10-4 p.u., width is 12.29 Gs, peak area is 3.68·10-3 p.u.;
– for fish bone tissue, irradiated with the dose of 3 kGy, amplitude is 6.29·10-6 p.u., width is 9.81 Gs, peak area is 4.07·10-4 p.u.; at the dose of 9 kGy amplitude is 3.19·10-5 p.u., width is 13.55 Gs, peak area is 2.55·10-3 p.u.; at the dose of 10 kGy amplitude is 3.25·10-5 p.u., width is 13.78 Gs, peak area is 2.62·10-3 p.u.; at the dose of 12 kGy amplitude is 3.44·10-5 p.u., width is 14.74 Gs, peak area is 3.07·10-3 p.u.
The obtained results have an important significance for arrangement of the regulatory system in the framework of updating the requirements of the European and International standards for safety and quality assurance of food.
СПИСОК ЛИТЕРАТУРЫ
- Prodovol'stvennye poteri i pishchevye otkhody v kontekste ustojchivykh prodovol'stvennykh sistem [Food losses and food waste in the context of stable food systems]. Doklad Gruppy ekspertov vysokogo urovnya po voprosam prodovol'stvennoy bezopasnosti i pitaniya Komiteta po vsemirnoy prodovol'stvennoy bezopasnosti [Report of the High-level Expert Panel on food security and nutrition of the Committee on world food security. HLEP report]. Rome, 9 May, 2014. 13 p.
- Chereshnev V.A. and Poznyakovskiy V.M. The Food Supply Security Problem: National and International Aspects. Food Industry, 2016, no. 1(1), pp. 6-14. (In Russian).
- Kostenko Yu.G., Shurduba N.A., Shagova T.S., Telegina M.D., and Filatov V.I. Primenenie ioniziruyushchikh izlucheniy dlya uluchsheniya sanitarno-mikrobiologicheskikh pokazateley myasa i myasnykh produktov [The use of ionizing radiation for improvement of the sanitary-microbiological parameters of meat and meat products]. Moscow: Myasomolochnaya promyshlennost' Publ., 1992. 32 p.
- Lebskaya T.K. and Golembovskaya N.V. Application of gamma-radiation treatment to control maturation and to increase safety of the preserves from carp meat. Vestnik of Astrakhan State Technical University. Series: Fishing Industry, 2015, no. 2, pp. 116-122. (In Russian).
- Sakata R. Tendencies of development of technologies and researches of meat and meat products in Japan. Vse o myase [All about the meat], 2015, no. 1, pp. 20-24. (In Russian).
- Erkan N., Günlü A., and Genç İ.Y. Alternative seafood preservation technologies: ionizing radiation and high pressure processing. Journal of FisheriesSciences.com, 2014, vol. 8, no. 3, pp. 238-251.
- Genç İ.Y. and Diler А. Elimination of foodborne pathogens in seafoods by irradiation: Effects on quality and shelflife. Journal of Food Science and Engineering, 2013, no. 3, pp. 99-106.
- Toldrá F. and Reig M. The stability and shelf life of seafood. Food and Beverage Stability and Shelf Life, 2011, pp. 779-792. DOI: 10.1016/B978-1-84569-701-3.50028-1.
- Chiaravalle A.E., Mangiacotti M., Marchesani G., and Vegliante G. Electron spin resonance (ESR) detection of irradiated fish containing bone (gilthead sea bream, cod, and swordfish). Veterinary Research Communications, 2010, vol. 34, no. 1, pp. 149-152. DOI: 10.1007/s11259-010-9374-5.
- Tikhonov A.V., Anashkin R.S., and Kryukov A.E. Ispol'zovanie radiatsionnykh tekhnologiy v sel'skokhozyaystvennom proizvodstve [The use of radiation technologies in agricultural industry]. Sbornik nauchnykh trudov GNU SNIIZhK [Collection of scientific papers of the State Scientific Institution Stavropol Research Institute of Livestock Breeding and Fodder Production], 2013, no. 6, pp. 330-333.
- Della Monaca S., Fattibene P., Boniglia C., Gargiulo R., and Bortolin E. Identification of irradiated oysters by EPR measurements on shells. Radiation Measurements, 2011, vol. 46, no. 9, pp. 816-821. DOI: 10.1016/j.radmeas.2011.03.028.
- Alberti A., Chiaravalle E., Fuochi P., et al. Irradiated bivalve mollusks: Use of EPR spectroscopy for identification and dosimetry. Radiation Physicsand Chemistry, 2011, vol. 80, no. 12, pp. 1363-1370. DOI: 10.1016/j.radphyschem.2011.08.002.
- Poznyakovskiy V.M., Gorlov I.F., Tikhonov S.L., and Shelepov V.G. About the quality of meat with PSE and DFD properties. Food and Raw Materials, 2015, vol. 3, no. 1, pp. 104-110. DOI: 10.12737/11244.
- Chizh T.V., Koz'min G.V., Polyakova L.P., and Mel'nikova T.V. Radiation processing as technological method in order to improve the food security level. Russian Academy of Natural Sciences Bulletin, 2011, no. 4, pp. 44-49. (In Russian).
- Sin D.W.M., Wong Y.Ch., et al. Identification and stability study of irradiated chicken, pork, beef, lamb, fish and mollusks hellsby electron paramagnetic resonance (EPR) spectroscopy. European Food Research and Technology, 2005, no. 221, pp. 684-691.
- Anderle H., Steffan I., Wild E., et al. Detection and dosimetry of irradiated biominerals with thermoluminescence, radiolyoluminescence and electron spin resonance measurements: comparison of methods. Radiation Measurements, 1998, vol. 29, no. 5, pp. 531-551.
- Timakova R.T., Tikhonov S.L., Tararkov A.N., and Kudryashov L.S. Assessment of radiation safety of chilled meat using the method of electron paramagnetic resonance. Theory and practice of meat processing, 2016, no. 3, pp. 39-47. DOI: 10.21323/2414-438X-2016-1-3-57-65.
- Abdel-Rehim F., Basfar A.A., Al-Kahtani H.A., and Abu-Tarboush H.M. The use of electron spin resonance spectroscopy for the detection of irradiated mackerel. Applied Radiation and Isotopes, 1997, vol. 48, no. 2, pp. 241-245.
- Goulas A.E., Stahl M., and Riganakos K.A. Effect of various parameters of irradiated fish and oregano using the ESR and PSL methods. Food Control, 2008, vol. 19, no. 11, pp. 1076-1085. DOI: 10.1016/j.foodcont.2007.11.007.
