

Аннотация
Introduction. Our study aimed to apply medium infrared (MIR/FTIR) spectroscopy to evaluate the quality of various sports supplements available in the Polish shops and gyms.Study objects and methods. The study objects included forty-eight sports supplements: whey (15 samples), branched-chain amino acids (12 samples), creatine (3 samples), mass gainers (6 samples), and pre-workouts (12 samples). First, we determined the protein quantity in individual whey supplements by the Kjeldahl method and then correlated the results with the measured FTIR spectra by chemometric methods. The principal component analysis (PCA) was used to distinguish the samples based on the measured spectra. The samples were grouped according to their chemical composition. Further, we correlated the spectra with the protein contents using the partial least squares (PLS) regression method and mathematic transformations of the FTIR spectral data.
Results and discussion. The analysis of the regression models confirmed that we could use FTIR spectra to estimate the content of proteins in protein supplements. The best result was obtained in a spectrum region between 1160 and 2205 cm–1 and after the standard normal variate normalization. R2 for the calibration and validation models reached 0.85 and 0.76, respectively, meaning that the models had a good capability to predict protein content in whey supplements. The RMSE for the calibration and validation models was low (2.7% and 3.7%, respectively).
Conclusion. Finally, we proved that the FTIR spectra applied together with the chemometric analysis could be used to quickly evaluate the studied products.
Ключевые слова
Spectroscopy, FTIR, medium-infrared, chemometric, PCA, PLS, sports supplements, whey, creatine, BCAA, gainers, pre-workoutsВВЕДЕНИЕ
Food supplements are concentrated sources of nutrients (i.e. minerals and vitamins) or other substances with a nutritional or physiological effect that are marketed in “dose” form (e.g. pills, tablets, capsules, or liquids in measured doses) [1]. In the EU, food supplements are regulated as foods. Therefore, it is the responsibility of the manufacturer, importer, supplier or distributor to ensure the safety of food supplements placed on the market.
The use of dietary supplements is mainly widespread in sport. People are continually searching for supplements to help them lose weight, boost energy, and build muscles. There are some supplements which are commonly used to achieve these goals [2].
One of them is a whey protein supplement, the most important nutrient to boost athletic performance. Whey protein is popular among athletes, bodybuilders, fitness models, as well as people seeking to improve their performance in the gym. Numerous studies show that it can help increase strength, gain muscle, and lose significant amounts of body fat [3, 4]. Some specific types of protein are made for certain scenarios, such as casein protein for a slow-release protein and whey protein for a faster release. The main types of whey protein are concentrates (WPC), isolates (WPI), and hydrolysates (WPH).
The next commonly used supplement in sport is creatine which increases lean body mass, skeletal muscle strength, as well as muscle power and endurance [6]. Creatine supplementation appears to raise the creatine level in muscle cells and cause weight gain through an increase in lean body mass with no effect on fat mass [7, 8].
Pre-workout supplements are multi-ingredient dietary formulas designed to boost energy and athletic performance. While some pre-workout supplements have carbohydrates, most are carbohydrate- and calorie-free. Others contain caffeine, beet juice, or amino acids, such as arginine, citrulline, and ornithine, to increase blood flow to the muscles.
Mass gainers are products mostly directed for men who find it difficult to build lean muscle mass. They contain high amounts of calories, as well as carbohydrates and protein, making them a perfect meal replacement for people with quick metabolism.
Due to increased consumption of sports supplements and EU regulations, there is a need for a quick and precise method to evaluate their quality. The defects of traditional measurements create a possibility of adulteration. For example, the commonly used the Kjeldahl method, which determines protein content in samples, is time-consuming and unable to distinguish the protein nitrogen from the non-protein nitrogen [9]. Nowadays, adding inexpensive amino acids and amino acid derivatives to protein supplements to modify their content has become a common adulteration method which is hard to detect [9]. Moreover, dishonest producers provide incorrect information on the packaging regarding the amounts of ingredients.
Some methods have been proposed to ensure the quality of sports supplements. Jiao et al. used the Raman spectroscopy combined with multivariate analysis for rapid detection of adulterants in whey protein [8]. High values of R2 and low errors of prediction for partial least squares (PLS) analysis prove that it could be used to detect adulterants in WPC. Champagne and Emmel demonstrated the Fourier transform infrared (FTIR) with attenuated total reflectance (ATR) as a tool for detecting adulteration in raw materials of dietary supplements [10]. The researchers proved that vibrational spectroscopy could be used to identify the presence of known adulterants intentionally spiked into dietary ingredients, including erectile dysfunction drugs, steroids, weight loss drugs, and Melamine.
Pereira et al. proposed using fluorescence spectroscopy to detect and characterize adulterated whey protein supplements [11]. The adulteration was performed by adding creatine, caffeine, and lactose to WPC samples at different levels (10%, 20%, and 30% w/w). The time-resolved fluorescence analysis showed increased mean intensity lifetime in all adulterated samples, compared to pure WPC. This study proved that fluorescence spectroscopy was able to evince adulteration in WPC powders.
Another use of the fluorescence technique was reported by Pulgarin et al. [12]. The authors used the emission spectroscopy to characterize several whey samples subjected to different treatments and conditions. Their results indicated that the fluorescent amino acids, tyrosine and tryptophan, were responsible for the intrinsic fluorescence of whey. Martin et al. predicted the protein content in single wheat kernels using hyperspectral imaging, while Ingle et al. applied NIR spectroscopy to determine the protein content in powder mix products [13, 14].
High-performance liquid chromatography (HPLC) is one of the most common techniques used to determine the concentration of ingredients. The HPLC technique was applied by several authors to measure the concentration of taurine, caffeine or vitamins in energy drinks [15–17]. These studies exemplify a growing demand for new, more efficient techniques to assess the quality of food products and their ingredients. Compared to conventional techniques or chromatography analysis, infrared spectroscopy allows measuring the sample’s eco-friendliness – without sample preparation or the use of chemical reagents. In addition, FTIR spectroscopy can be successfully used in the analysis of amino acid profiles, as confirmed by [18, 19].
In this study, we applied FTIR spectroscopy coupled with chemometrics to evaluate the quality of sports supplements. This method is very efficient as the spectral profile in one measurement can provide various information about the product that could not be given by any conventional technique in common use.
Our main objectives were to create a regression model using PLS analysis to determine the total amount of protein in the product and to distinguish various ingredients by the FTIR spectra and principal component analysis (PCA).
ОБЪЕКТЫ И МЕТОДЫ ИССЛЕДОВАНИЯ
Samples. Our study objects included forty-eight samples of sports supplements from different producers: whey (15 samples), BCAAs (12 samples), creatine (3 samples), mass gainers (6 samples), and pre-workouts (12 samples). The samples were in the form of powders or liquids.
Protein determination. The protein content in whey protein samples was assessed by the Kjeldahl method, using a conversion factor of total nitrogen to protein (6.38 for milk products, 6.25 for meat products, and 5.70 for vegetables) [20]. Three parallel trials were performed for each sample. The percentage of protein in a sample (X) was calculated according to the formula [20]:
![]()
where a is the amount of the standard solution of hydrochloric acid used for titration of ammonia in a specific sample, cm3; n is the molar concentration of hydrochloric acid used for titration; m is the sample mass, g; f is the conversion factor of total nitrogen to protein (6.38 for milk products, 6.25 for meat products, and 5.70 for vegetables); 1.4 is the amount of nitrogen corresponding to 1 cm3 of 0.1 molar solution of hydrochloric acid, mg.
FTIR measurements. Medium infrared spectra were performed on a 4700 FTIR spectrometer (Jasco, Japan). Single beam spectra of the sample were collected and rationed against the background of air. For each sample, MIR spectra were recorded from 4000 to 600 cm–1 by co-adding 16 interferograms at a resolution of 4 cm–1. The measurements were performed in triplicate.
Data analysis. Principal component analysis (PCA). Principal component analysis was performed on the FTIR spectra of whey protein supplements to distinguish the samples. PCA is a multivariate technique that linearly transforms an original set of variables into a substantially smaller set of uncorrelated variables that represents most of the information in the original data set. Data for PCA are arranged in a two-way matrix, in which column vectors represent variables and row vectors represent the “objects” whose variables are measured [21]. The PCA analysis was carried out using Unscrambler X (CAMO, Oslo, Norway) software.
Partial least squares (PLS). The partial least squares (PLS) regression method was used to determine the relation between the samples’ spectra and the content of protein in whey supplements. We selected regions of spectra and data preprocessing options to optimize the model. In total, 45 spectra were measured (15 samples in triplicate). The set of independent variables X was the FTIR spectra and the set of dependent variables Y was the protein content. Full cross-validation was applied to the regression model.
The regression models were evaluated using the adjusted R2 and the root mean-square error of crossvalidation crossvalidation (RMSECV), as the term indicating the prediction error of the model. The quality models were evaluated by the ratio of the standard deviation of reference data for the validation samples to the RMSEP (RPD). The predicted values were compared to the reference values. The PLS analysis was carried out using Unscrambler X (CAMO, Oslo, Norway) software.
РЕЗУЛЬТАТЫ И ИХ ОБСУЖДЕНИЕ
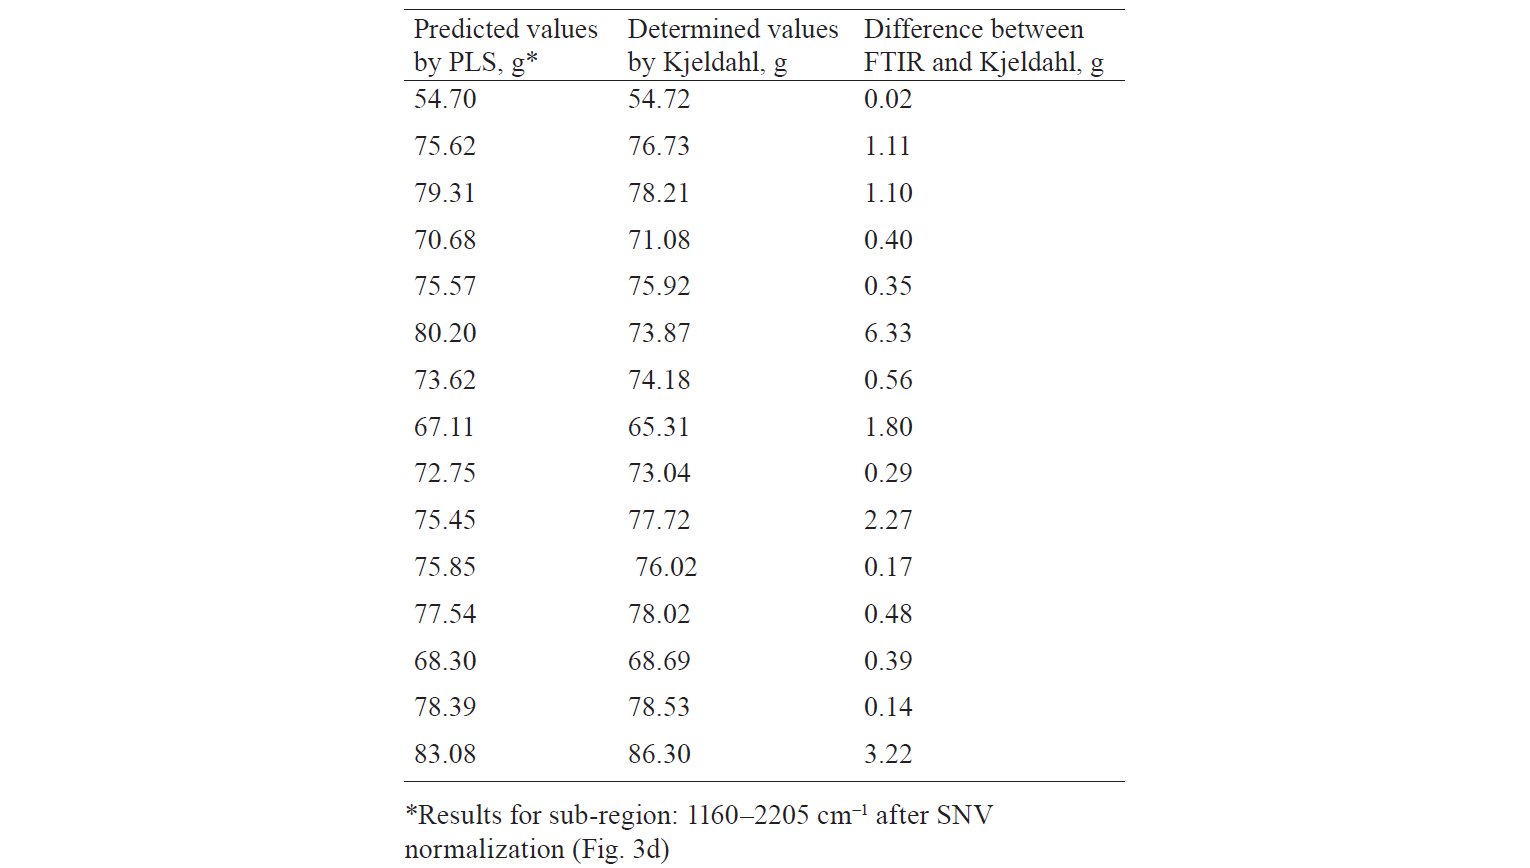
Protein determination. The protein contents in whey protein samples (measured by the Kjeldahl method) are given in Table 1.
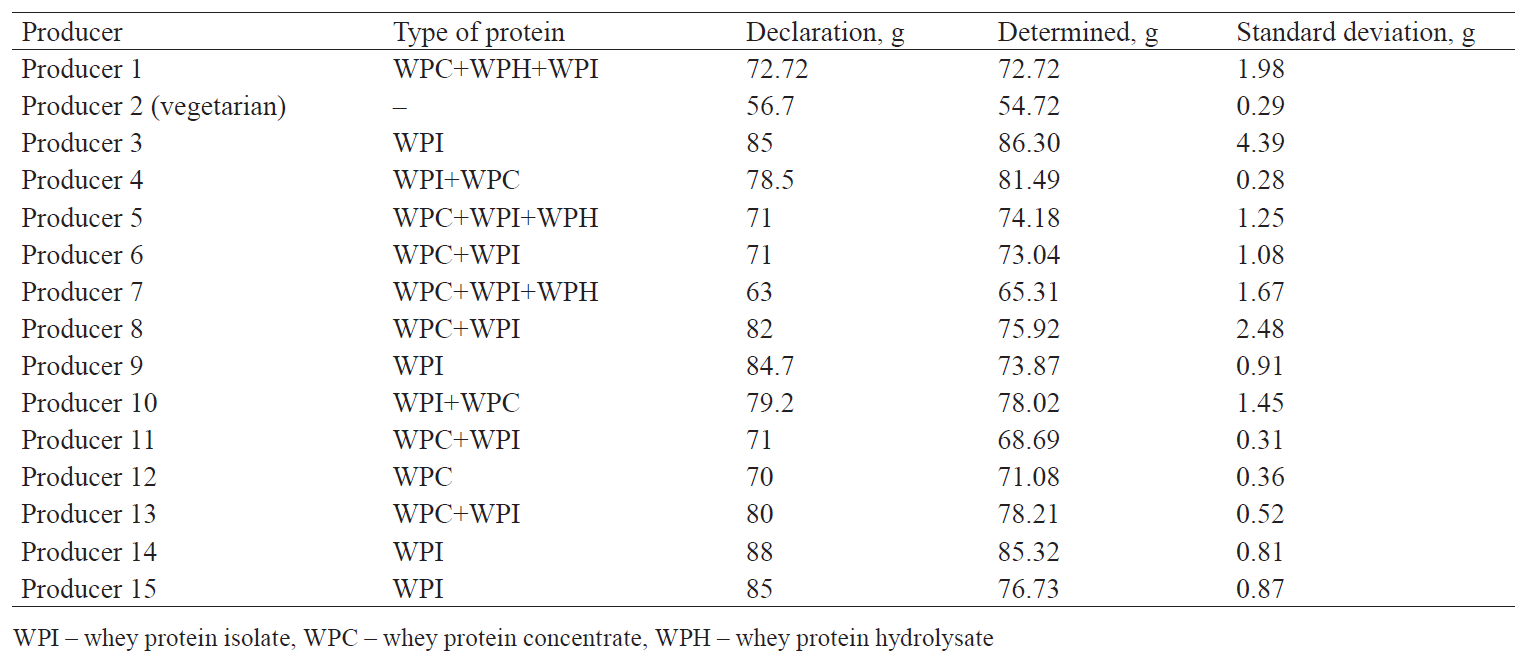
The results show that the producers declared similar values to those marked. For most producers, the differences from the declared values did not exceed 5 g/100 g of protein, which is considered as acceptable. The highest difference between the value declared and that determined by the Kjeldahl method was observed for three samples. They were from Producer 9 (84.7 g/100 g vs. 73.87 g/100 g), Producer 8 (82 g/100 g vs. 75.92 g/100 g), and Producer 15 (85 g/100 g vs. 76.73 g/100 g). However, most producers declared the correct protein value on the package of their products.
Sports supplements spectra in medium infrared range. The medium infrared absorption spectra of the sports supplements measured against air are presented in Fig. 1.
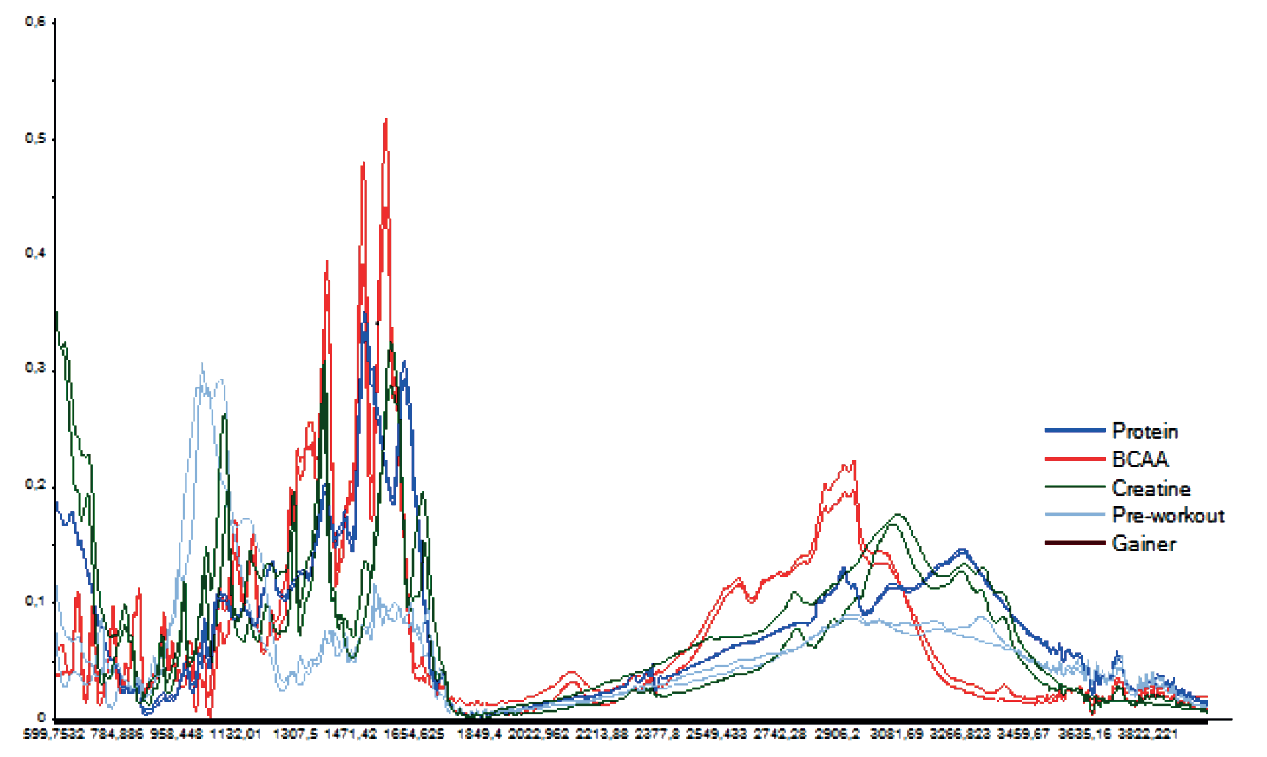
According to the data reported in [23], the absorption spectra of whey products had two prominent features, Amide I (about 1650 cm–1) and Amide II (about 1540 cm–1) bands. The former arose primarily from the C=O stretching vibration and the latter was attributed to the N-H bending and C-N stretching vibrations of the peptide backbone. The band with the maximum absorption at about 3268 cm–1 was assigned to Amide A. The band at 3000–2825 cm–1 corresponded to the C-H stretching vibration, while the low intensity bands at about 1241 cm–1 and 1100 cm–1 were assigned to the P-O stretching vibrations [23].
Zhu et al. [24] found that the absorption spectra of branched chain amino acids (BCAA) showed the concentration of effective wavelengths of amino acids (e.g. valine, leucine, isoleucine, and glycine) mainly in the fingerprint region (500–1700 cm–1). Based on the literature, we can describe the main bands in these products. The band with two maximum absorption peaks at about 1575 cm–1 and 1509 cm–1 could be assigned to isoleucine [24]. The band with the maximum at about 1400 cm–1 corresponded to glycine that does not contain asymmetric carbon atoms [24]. The valine bands were also observed in the fingerprint region. The band at 665 cm–1 was assigned as a bending mode of CO2. The bands at about 753 cm–1 and 776 cm–1 were assigned as wagging and bending of CO2 group, while vibrations between 900 and 965 cm–1 as mainly due to the C–C stretching vibration. The medium intensive band at 2817–3000 cm–1 was assigned to the C-H hydroxyl group [24].
The creatine MIR absorption spectra have not been widely reported in literature. Based on the chemical composition of creatine (which is also an organic acid), we can infer that the creatine spectrum should be similar to the BCAA spectrum. The differences in the intensity and shape of some bands are probably due to a high concentration of aminoacetic acid and guanidine in the creatine sample.
The pre-workout absorption spectra have not been widely described in literature either. According to the studies of caffeine determination in Singh et al. or Abdalla, pre-workouts containing caffeine have some typical bands for that component [25, 26]. Thus, it could be used to confirm the presence of this ingredient in the product.
Principal component analysis (PCA). The PCA was used to distinguish the medium infrared spectra obtained from different types of sports supplements. The PCA data were plotted on a graph of first principal component (PC1) vs. second principal component (PC2), as shown in Fig. 2. The PCA was conducted for all the products and for groups of products. The results were diversified into (1) all supplements, (2) protein supplements, (3) creatine supplements, (4) BCAAs, (5) mass gainers, and (6) pre-workout supplements (Fig. 2).
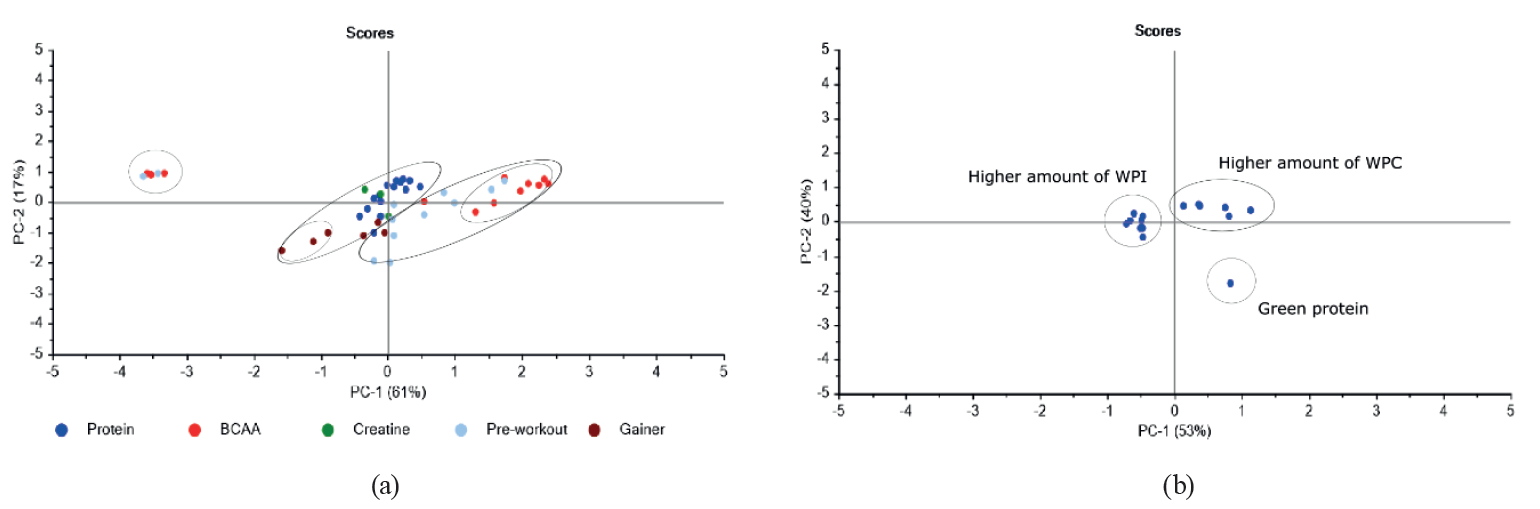
Sports supplements are products to which producers add various mixes of ingredients depending on market needs and prevailing trends. These ingredients may include vitamins, minerals, herbs, and amino acids. In our study, we applied the PCA analysis to the spectra acquired from forty-eight samples which were measured in triplicate and then averaged. For the whole spectrum (4000–400 cm–1), the first and second principal components (PC1 and PC2) described 78% of total variation (61% and 17%, respectively), as shown in Fig. 2a.
Based on the data in Fig. 2a, we identified three main groups of products. The first one included products characterized by positive values of PC1 and negative values of PC2 (BCAAs and pre-workouts). These products differed from the others in their physical state (they were liquids). The second group was products which primarily contained proteins and amino acids. They included mostly proteins, mass gainers, and creatine. The third group (mostly with a positive PC1) was composed of BCAAs and pre-workouts. The main ingredient in these products was branched amino acids.
The PCA results for protein supplements are presented in Fig. 2b. For the whole spectrum, the first and second principal components described 93% of total variation (53% and 40%, respectively). Based on the distribution of the samples, we distinguished three groups of protein products. The first group included supplements with high amounts of whey protein isolate (WPI) and negative values of PC1. The second group contained supplements made from whey protein concentrate and characterized by positive PC1 and PC2. Finally, the third group included products based on green protein (plant proteins for vegans) with positive PC1 and negative PC2.
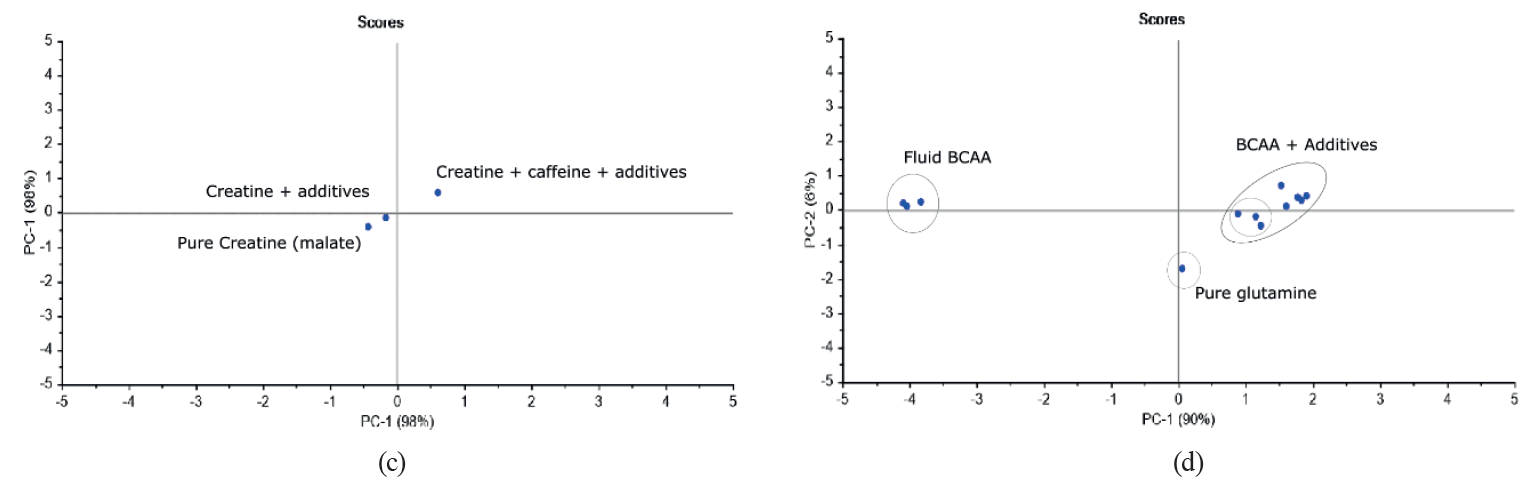
Fig. 2c presents the PCA results for creatine samples. According to the data, creatine with the addition of caffeine was characterized by positive values of PC1 and PC2. Pure creatine and creatine with additives were in the opposite sites (negative values of PC1) and close together.
The PCA results for BCAA supplements are shown in Fig. 2d. The first and second principal components described 96% of total variation (90% and 6%, respectively). Based on the distribution of samples, we identified three main groups of BCAA products. Fluid BCAAs were characterized by negative values of PC1 and positive values of PC2. Solid samples had a positive PC1. Pure glutamine was in the quarter which had a positive PC1 and a negative PC2. We also found some BCAA samples with additives in that quarter. According to the information on the packaging, these samples contained glutamine. The rest of the BCAA supplements (with positive values of PC1 and PC2) were samples without glutamine.
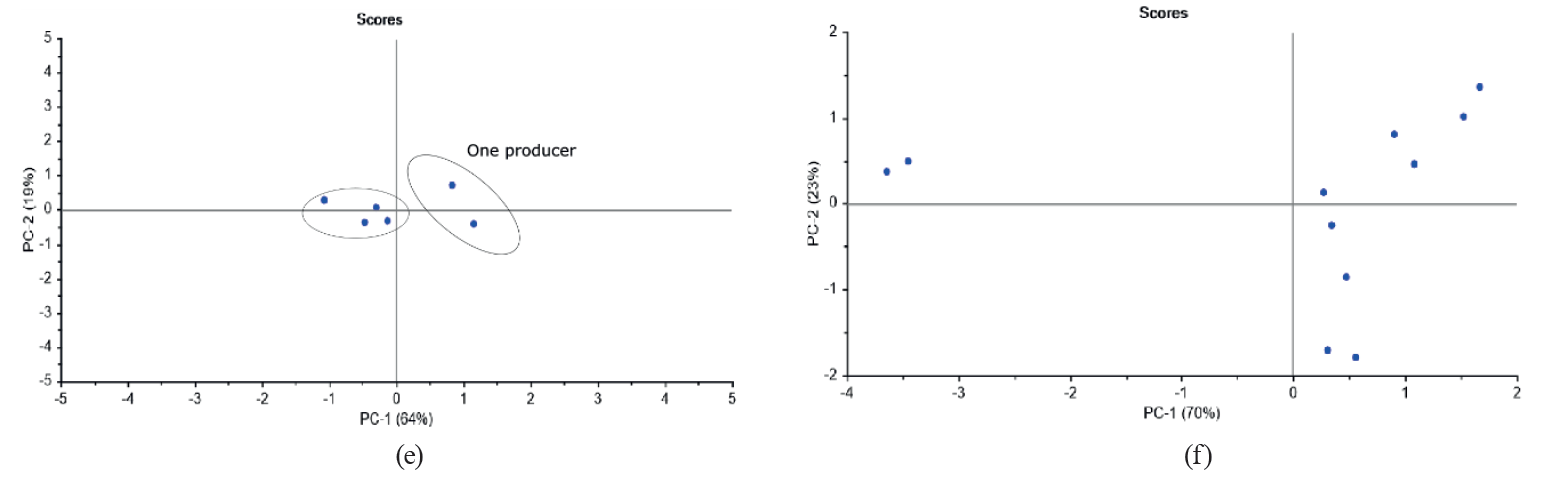
Fig. 2d features the PCA results for mass gainer supplements. We found that the first and second principal components described 83% of total variation (64% and 19%, respectively). Based on the data, we distinguished two groups of gainers. The first group was characterized by negative values of PC1 while the second, by positive values of PC1. Due to insufficient information on the packaging, it was hard to determine the differences between them. It is worth emphasizing that group A contained supplements from various producers, while group B had only two products of the same producer. In addition, the products in group B could be found on a low-price shelf on the market.
The last group of sports supplements exposed to PCA included pre-workout products (Fig. 2e). The first and second principal components described 93% of total variation (70% and 23%, respectively). We identified two groups of pre-workout supplements. The first group included liquid samples with negative values of PC1, while the second contained solids with positive values of PC1. The samples in the second group differed from each other in the amount of caffeine. Those with lower amounts of caffeine had negative values of PC2, while those with higher amounts of caffeine had positive values of PC2.
Partial least squares regression (PLS). PLS was used to quantitatively evaluate the concentration of protein in whey protein supplements based on their spectral characteristics. Different types of mathematical pre-processing were applied to the spectra before building the model. First, we analyzed complete spectra in all the spectral regions. Next, we chose specific subregions, relying on the regression coefficients for the complete spectra and the chemical information in the specific sub-regions (Fig. 3).
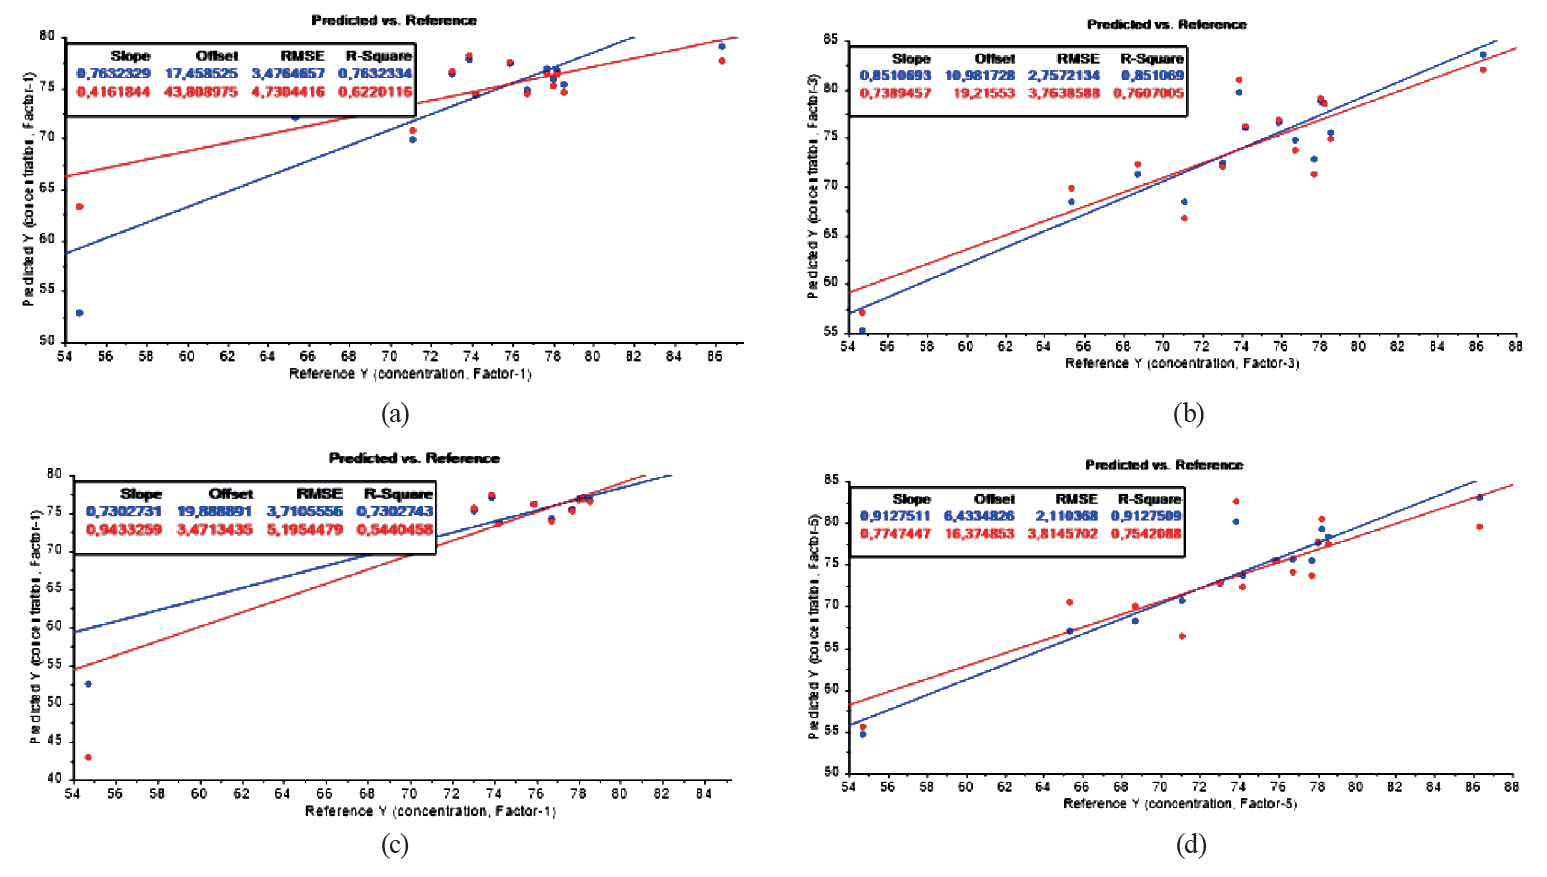
The PLS regression results for the full spectrum (4000–400 cm–1) without any pretreatment revealed a correlation between the spectra and the protein composition. R2 for the calibration and validation models amounted to 0.76 and 0.62, respectively. It meant that the models had a medium-good capability to predict the protein content in whey supplements. The RMSE for the calibration and validation models was also low (3.5% and 4.7 %, respectively), confirming their medium-good quality (Fig. 3a). The regression results were improved when specific spectral regions were used instead of the complete spectra. R2 for the calibration and validation models reached 0.85 and 0.76, respectively. It meant that the models had a good capability to predict the protein content in whey supplements. The RMSE for the calibration and validation models was also low (2.7% and 3.7%, respectively), confirming the good quality of the models (Fig. 3b).
Next, we performed the mathematical preprocessing of the spectra (using SNV normalization). R2 for the calibration (full spectrum) and validation models equaled 0.73 and 0.54, respectively. The RMSE was also low (3.7% and 5.2%, respectively), which confirmed that the quality of the models was mediumgood (Fig. 3c). The regression results were improved when specific spectral regions were used instead of the complete spectra. R2 for the calibration and validation models amounted to 0.91 and 0.75, respectively. This suggested a good capability of the models to predict the protein content in whey supplements. The RMSE for the calibration and validation models was also low (2.1% and 3.8%, respectively), which confirmed their good quality (Fig. 3d).
Based on the results, we found that the rapid FTIR method had an accuracy comparable to the Kjeldahl method. The difference between the values determined by the Kjeldahl method and those predicted by FTIR was about 1.2 g (Table 2). In addition, our complementary method offered several advantages: it is simple, fast (less than a minute) and requires no chemicals or reagents, compared to traditional methods.
ВЫВОДЫ
Our study aimed to investigate the potential of medium infrared (FTIR) radiation in combination with a multiway analysis in monitoring the quality of sports supplements. The spectra of selected sports supplements had a different shape and intensity, depending on the chemical composition. Based on the characteristic spectra, the FTIR could be used to confirm the presence or absence of a given ingredient in the sample.
The results of the PCA analysis (sample distribution) showed that the FTIR spectra coupled with PCA offered a promising tool for distinguishing sports supplements based on their ingredients.
The regression analysis (PLS) indicated that FTIR spectroscopy could replace the time-consuming Kjeldahl method as a much faster technique to predict the concentration of protein in whey supplements that does not require any reagents.
Thus, we found FTIR spectroscopy to be a promising approach to quality evaluation of sports supplements.
КОНФЛИКТ ИНТЕРЕСОВ
The author declares that there is no conflict of interest.
СПИСОК ЛИТЕРАТУРЫ
- Food supplements [Internet]. [cited 2020 Feb 20]. Available from: https://www.efsa.europa.eu/en/topics/topic/foodsupplements.
- Bianco A, Mammina C, Thomas E, Bellafiore M, Battaglia G, Moro T, et al. Protein supplementation and dietary behaviours of resistance trained men and women attending commercial gyms: a comparative study between the city centre and the suburbs of Palermo, Italy. Journal of the International Society of Sports Nutrition. 2014;11(30).DOI: https://doi.org/10.1186/1550-2783-11-30.
- Ha E, Zemel MB. Functional properties of whey, whey components. and essential amino acids: mechanisms underlying health benefits for active people (review). The Journal of Nutritional Biochemistry. 2003;14(5):251–258. DOI: https://doi.org/10.1016/s0955-2863(03)00030-5.
- Valenta R, Dorofeeva YuA. Sport nutrition: the role of macronutrients and minerals in endurance exercises. Foods and Raw Materials. 2018;6(2):403–412. DOI: httsp://doi.org/10.21603/2308-4057-2018-2-403-412.
- Shimomura Y, Murakami T, Nakai N, Nagasaki M, Harris RA. Exercise promotes BCAA catabolism: Effects of BCAA supplementation on skeletal muscle during exercise. Journal of Nutrition. 2004;134(6):1583S–1587S. DOI: https://doi.org/10.1093/jn/134.6.1583S.
- Lawler JM, Barnes WS, Wu GY, Song W, Demaree S. Direct antioxidant properties of creatine. Biochemical and Biophysical Research Communications. 2002;290(1):47–52. DOI: https://doi.org/10.1006/bbrc.2001.6164.
- Harris RC, Soderlund K, Hultman E. Elevation of creatine in resting and exercised muscle of normal subjects by creatine supplementation. Clinical Science. 1992;83(3):367–374. DOI: https://doi.org/10.1042/cs0830367.
- Volek JS, Duncan ND, Mazzetti SA, Staron RS, Putukian M, Gomez AL, et al. Performance and muscle fiber adaptations to creatine supplementation and heavy resistance training. Medicine and Science in Sports and Exercise. 1999;31(8):1147–1156. DOI: https://doi.org/10.1097/00005768-199908000-00011.
- Jiao XX, Meng YY, Wang KK, Huang W, Li N, Liu TC-Y. Rapid detection of adulterants in whey protein supplement by Raman spectroscopy combined with multivariate analysis. Molecules. 2019;24(10). DOI: https://doi.org/10.3390/molecules24101889.
- Champagne AB, Emmel KV. Rapid screening test for adulteration in raw materials of dietary supplements. Vibrational Spectroscopy. 2011;55(2):216–223. DOI: https://doi.org/10.1016/j.vibspec.2010.11.009.
- Pereira CG, Andrade J, Ranquine T, de Moura IN, da Rocha RA, Furtado MAM, et al. Characterization and detection of adulterated whey protein supplements using stationary and time-resolved fluorescence spectroscopy. LWT – Food Science and Technology. 2018;97:180–186. DOI: https://doi.org/10.1016/j.lwt.2018.06.050.
- Pulgarín JAM, Molina AA, Pardo MTA. Fluorescence characteristics of several whey samples subjected to different treatments and conditions. Analytica Chimica Acta. 2005;536(1–2):153–158. DOI: https://doi.org/10.1016/j.aca.2004.12.087.
- Caporaso N, Whitworth MB, Fisk ID. Protein content prediction in single wheat kernels using hyperspectral imaging. Food Chemistry. 2017;240:32–42. DOI: https://doi.org/10.1016/j.foodchem.2017.07.048.
- Ingle PD, Christian R, Purohit P, Zarraga V, Handley E, Freel K, et al. Determination of protein content by NIR spectroscopy in protein powder mix products. Journal of AOAC International. 2016;99(2):360–363. DOI: https://doi.org/10.5740/jaoacint.15-0115.
- Rai KP, Rai HB, Dahal S, Chaudhary S, Shrestha S. Determination of caffeine and taurine contents in energy drinks by HPLC-UV. Journal of Food Science and Technology Nepal. 2016;9:66–73. DOI: https://doi.org/10.3126/jfstn.v9i0.16199.
- Lage-Yusty MA, Villar-Blanco L, Lopez-Hernandez J. Evaluation of caffeine. vitamins and taurine in energy drinks. Journal of Food and Nutrition Research. 2019;58(2):107–114.
- Sawabe Y, Tagami T, Yamasaki K. Determination of taurine in energy drinks by HPLC using a pre-column derivative. Journal of Health Science. 2008;54(6):661–664. DOI: https://doi.org/10.1248/jhs.54.661.
- Mohamed ME, Mohammed AMA. Experimental and computational vibration study of amino acids. International Letters of Chemistry Phyisics and Astronomy. 2013;15:1–17. DOI: https://doi.org/10.18052/www.scipress.com/ILCPA.15.1.
- McDermott A, Visentin G, De Marchi M, Berry DP, Fenelon MA, O’Connor PM, et al. Prediction of individual milk proteins including free amino acids in bovine milk using mid-infrared spectroscopy and their correlations with milk processing characteristics. Journal of Dairy Science. 2016;99(4):3171–3182. DOI: https://doi.org/10.3168/jds.2015-9747.
- Official methods of analysis of AOAC International, 20th Edition. Gaithersburg: The Association of Official Analytical Chemists, 2016.
- Stuart BH. Infrared spectroscopy: fundamentals and applications. Chichester: John Wiley & Sons; 2004. 224 p. DOI: https://doi.org/10.1002/0470011149.
- Krzysztof W. Applying NIR spectroscopy to evaluate quality of whey supplements available on the Polish market. Zywnosc. Nauka. Technologia. Jakosc/Food. Science. Technology. Quality. 2018;25(2):59–70. DOI: https://doi.org/10.15193/ZNTJ/2018/115/233.
- Miller LM, Bourassa MW, Smith RJ. FTIR spectroscopic imaging of protein aggregation in living cells. Biochimica et Biophysica Acta – Biomembranes. 2013;1828(10):2339–2346. DOI: https://doi.org/10.1016/j.bbamem.2013.01.014.
- Zhu GY, Zhu X, Fan Q, Wan XL. Raman spectra of amino acids and their aqueous solutions. Spectrochimica Acta Part A: Molecular and Biomolecular Spectroscopy. 2011;78(3):1187–1195. DOI: https://doi.org/10.1016/j.saa.2010.12.079.
- Singh BR, Wechter MA, Hu YH, Lafontaine C. Determination of caffeine content in coffee using Fourier transform infra-red spectroscopy in combination with attenuated total reflectance technique: A bioanalytical chemistry experiment for biochemists. Biochemical Education. 2010;26(3):243–247. DOI: https://doi.org/10.1016/S0307-4412(98)00078-8.
- Abdalla MA. Determination of caffeine, the active ingredient in different coffee drinks and its characterization by FTIR/ATR and TGA/DTA. International Journal of Engineering and Applied Sciences (IJEAS). 2015;2(12):85–89.
