

Аннотация
In this study, we used a water-in-oil (W/O) emulsion encapsulation technique to enhance green coffee extract in the novel kashk product and protect it against hot filling. Green coffee extracts (GCE) in free (1%, 0.5%, and 0.25%) and encapsulated form (EGCE) (5%, 2.5%, and 1.25%) were added to kashk during hot filling, and their physicochemical and sensory properties were investigated. The EGCE kashk had higher oxidative stability (0.43 h) than the control due to the extract’s high phenolic content and DPPH radical scavenging activity (74%). Although a high concentration of GCE caused a higher pH (4.02), the latter declined in all the samples during the storage period. Further, the size of droplets in the emulsion varied from 3.20 to 8.51 μm, confirming the well-encapsulated GCE by Fourier transform infrared. In addition, palmitic acid and oleic acid were detected in GCE by gas chromatography as the main saturated and unsaturated fatty acids, respectively. All the treatments had similar rheological properties and the highest flow index was observed in the samples with EGCE 5% on day 60. The sensory evaluation showed that the assessors preferred the kashk formulated with 1% GCE. Finally, GCE encapsulation protected the color of the samples, and the b* value remained unchanged, whereas the lightness (L*) increased. We suggest that a W/O emulsion is a successful technique for GCE encapsulation in kashk and can offer the latter to consumers as an alternative type of flavored dairy product with a better shelf life and health benefits.Ключевые слова
Antioxidant activity, encapsulation, green coffee extract, kashk, rheological propertiesВВЕДЕНИЕ
Fortified dairy products appeal to a wide variety of consumers and help them increase their intake of bioactive components. Kashk is a local name for a traditional low-fat dried yogurt in Iran. It is obtained from boiled and concentrated yogurt and is available in a semi-liquid or dried form. Liquid kashk contains 20–25% nonfat solids, 1% fat, 3% salt, and at least 13% protein [1].
Coffee is one of the most consumed and commercialized food products in the world and one of the most traded commodities, second only to petroleum [1]. It has various biological and pharmacological properties, such as antioxidant, anti-inflammatory, and antimicrobial properties, as well as other health benefits [2].
Natural therapy is a modern approach to preventing common diseases. Therefore, coffee bean extract or powder can be used in cosmetic products and numerous functional foods [1, 3–5]. However, natural antioxidants are usually heat sensitive and susceptible to oxidation, which limits their application in food industry [6].
Microencapsulation is a promising technique that protects bioactive materials and controls the release of entrapped ingredients [1]. Over the last few years, encapsulation has attracted much attention in food, pharmaceutical, and cosmetic industries due to its wide application in the design of functional products [1]. Encapsulation techniques are often based on drying processes, such as spray-drying or freeze-drying, due to the liquid nature of extracts containing bioactive compounds [7]. Several studies have investigated the protective role of these techniques against adverse conditions to which extracts can be exposed. They found that encapsulation promoted better volatile retention and increased the shelf life of bioactive components and extracts [8–11]. There are numerous studies about encapsulation of coffee extract and its antioxidant compounds [12–14].
The incorporation of green coffee extract (GCE) in kashk has not been reported so far. Since kashk is prepared using hot filling, and heating causes a loss of antioxidants, GCE was encapsulated using a waterin-oil (W/O) emulsion technique. Thus, our aim was to investigate the physicochemical and sensory characteristics of kashk incorporated with free and microencapsulated GCE during the storage period.
ОБЪЕКТЫ И МЕТОДЫ ИССЛЕДОВАНИЯ
Materials. Green coffee (Robusta coffee) was supplied from the local market of Shiraz (Fars, Iran). Starter culture (-CH1-DVS-50U) was purchased from Christian Hansen (Denmark), and all chemical reagents were obtained from Merck Co. (Germany).
The research was conducted at the Fars Agricultural and Natural Resources Research and Education Center.
Green coffee extraction. According to the slightly modified method of Upadhyay and Ramalakshmi, 10 g of ground coffee was added to 100 mL of distilled water and held in a hot water bath for 30 min [2]. Then the slurry was cooled at room temperature and filtered to obtain a clear extract for analysis.
Microencapsulation. GCE was microencapsulated using a W/O emulsion technique based on the Tran et al. method with slight modifications [15]. Glycerol monostearate (GMS) with HLB 3.8 (1.5 wt%) was added to canola oil and shaken at 4000 rpm at 70°C. Then, the aqueous solution containing the GCE was heated to 40°C. The W/O emulsion (10:90) was prepared by blending the GCE-containing aqueous phase and the GMS-containing canola oil phase at 27000 rpm and 70°C for 2 min. Then, the suspension was cooled while stirring with a magnetic at 1000 rpm for 2 h and left for 30 min for microcapsules to precipitate. Finally, the suspension was centrifuged at 350 g and 4°C for 10 min. The precipitate was washed twice with saline and filtered. The obtained microcapsules were stored in a refrigerator until usage.
GCE kashk production. Liquid kashk was prepared according to the method described in [1]. Then, free and encapsulated green coffee extracts in different amounts (0.25‒5%) were added to kashk. The samples were named GCE 1%, GCE 0.5%, GCE 0.25%, EGCE 5%, EGCE 2.5%, and EGCE 1.25%. The sample without GCE was used as a control.
Total phenolic content. The amount of total phenol in different concentrations of the extracts was determined according to Folin-Ciocalteu as described by Ballesteros et al., with some modifications [12]. Briefly, the samples (0.1 mL) were introduced into test tubes containing 0.75 mL of Folin–Ciocalteu’s reagent and 0.75 mL of 2% sodium carbonate. The tube was mixed and kept for 1 h in the darkness at room temperature. The absorbance was measured at 765 nm using a UNICO 2100 UV–vis spectrophotometer. Phenolic compounds were measured in triplicate, and the results were averaged. A calibration curve of gallic acid (ranging from 25 to 100 mg mL–1) was prepared in methanol. The results, which were determined by the regression equation of the calibration curve (y = 0.000245x – 0.0377; correlation coefficient r = 0.998), were expressed as gallic acid (GA) mg equivalents g–1 sample.
Antioxidant activity. The free radical scavenging activity of GCE was measured by using the 1,1-diphemyl-2-picryl-hydrazyl (DPPH) following the method of Ribeiro et al. with a slight modification [16]. A DPPH solution was added to the extract and mixed. Then, the mixture was kept at room temperature in the darkness for 1 h. The absorbance of resulting solutions was measured at 515 nm. The blank sample was prepared in the same manner except that methanol was used instead of the DPPH solution. A standard curve was prepared using TBHQ (tertiary butylhydroquinone) at different concentrations. The percentage of scavenging activity was calculated as below:
![]()
where A0 is the absorbance of the control and A1 is the absorbance of the sample turbidity factor. Finally, IC50 (an absorbance value of 0.5 in the reducing power assay) was calculated.
Oxidative stability. The 892 Professional Rancimat (Metrohm, Herisau, Switzerland) was used to determine the oxidation stability of the samples. Three grams of the sample was heated at 110°C under a purified air flow rate of 20 L h–1.
pH value. The pH of kashk enriched with GCE was measured using a pH meter (Greisinger electronic, Germany).
Particle size distribution. The mean particle size of the microcapsules was measured using a dynamic light scattering technique at ambient temperature (Nano Particle Analyzer SZ-100, Horiba, Germany).
Fourier transform infrared spectroscopy (FTIR). The FTIR analysis of GCE and EGCE was recorded by a Perkin-Elmer Spectrum RXI spectrometer (USA) in the transmit mode in the range of 400–4000 cm–1 in KBr pellets at a resolution of 4 cm–1. A DLaTGS (Deuterated Triglycine Sulphate Doped with L-Alanine) detector was used to perform the measurements at room temperature (25 ± 0.5°C) at 24 scan/min to find possible functional groups.
Fatty acid composition. The fatty acid composition was determined according to the Golmakani et al. method [17].
Rheological measurements. Viscosity was measured using a Brookfield rotational viscometer (Model LVDV I+, Version 3.0, Stoughton, MN, USA) with a spindle C30 and a heating circulator. The kashk samples were mixed for 5 min at room temperature at 60 rpm. Flow behavior was described using the Power law, Bingham, and Casson models according to equations:

where τ is the shear stress, Pa; γ is the shear rate, s–1; k is the consistency coefficients, Pa·sn; η is Bingham plastic viscosity; kc is Casson plastic viscosity; n is the flow index, and σ0 and k0c are yield stress of Bingham and Casson models, respectively.
Color analysis. Changes in kashk color were measured using a Choroma CR-400 meter (Japan). L, a and b values were expressed as L* (black to white), a* (green to red), and b* (blue to yellow) [18].
Sensory analysis. Sensory properties of the samples were determined by 30 panelists. Sensory analysis included aroma, color, taste, and overall acceptability. It used a five-point hedonic scale, with 5 indicating “like extremely” and 0 “dislike extremely”, compared to the control sample. The analysis lasted 7 consecutive days [19].
Statistical analysis. A one-way analysis of variance (ANOVA) was performed at a confidence level of 0.05 (SPSS version 16.0). The means were compared using the Duncan’s multiple range at a significance level of 0.05. All experiments were performed in triplicate.
РЕЗУЛЬТАТЫ И ИХ ОБСУЖДЕНИЕ
Total phenolic content. The total phenolic content of GCE is presented in Table 1.

The content of phenols in a 1200 ppm concentration of GCE was 39.08 mg GA g–1, confirming its antioxidant activity due to the polyphenolic compound [12]. These results were close to those found by Siva, Rajikin [20]. They reported total phenolic contents of GCEs obtained by isopropanol and methanol to be 30.65 mg GA g–1 and 16.26 mg GA g–1, respectively. Similarly, Naidu et al. reported 32.19% and 31.71% for arabica and robusta isopropanol/water extracts, respectively [21]. However, the total phenolic content of coffee depends on its variety [6]. Bidchol et al. and Ballesteros et al. also found that extracts of spent coffee grounds had 19.99 ± 3.56 mg 100 mL–1 chlorogenic acid and 350.28 ± 11.71 mg GAE 100 mL–1 [7, 12].
The most common polyphenols in coffee are phenolic acids, mainly caffeic acid, a type of transcinnamic acid, and its derivative, chlorogenic acid [22]. Chlorogenic acid is able to directly interact with reactive oxygen species (ROS), making it an effective OH• scavenger [12]. However, the content of chlorogenic acid in green coffee beans varies depending on genes, species, climate, nutrient state of soil, processing techniques such as decaffeination, degree of ripeness, and also roasting. Since phenolic acid is heat sensitive, green coffee beans have a higher content of chlorogenic acid [8]. In addition, it was found that coffee extract exhibited an antioxidant activity similar to grapes and pomegranates [12].
Antioxidant activity. According to Table 1, the IC50 of GCE is 1.95 mg mL–1, which is higher than that of TBHQ (1.04 mg mL–1). Based on the data, we calculated the DPPH radical scavenging activity of GCE (74%) [23]. The high total phenolic content of GCE found in our study confirmed its high radical scavenging activity and antioxidant potential. In addition, the technique we used and the coating material had a great impact on the retention of phenolic compounds and antioxidant activity of encapsulated samples [12].
Similar results were revealed by Naidu et al. who reported 92, 87, and 76% antioxidant activity for arabica and 88, 82, and 78% for robusta at 60:40, 70:30, and 80:20 isopropanol/water ratios, respectively [21]. Jeszka-Skowron et al. also found that the antioxidant capacities of arabica and robusta green coffee averaged 56.3% [24]. Interacting with DPPH, antioxidants transfer an electron or a hydrogen atom to DPPH, thus neutralizing its free radical character [25]. The degree of discoloration indicates the scavenging potential of the antioxidant extract. This radical scavenging ability is mostly related to the types and amounts of antioxidative components in the extract and their ability to donate a hydrogen group [7]. The antioxidant constituents in green coffee are chlorogenic, ferulic, caffeic, and coumaric acids [26]. Chlorogenic and caffeic acids are considered the most relevant markers in coffee samples [27]. However, other compounds such as caffeine, trigonelline, and phenylalanines (formed during coffee roasting) have antioxidant properties as well.
Oxidative stability. The oxidative stability curve and the induction time for different treatments of kashk samples are shown in Fig. 1.
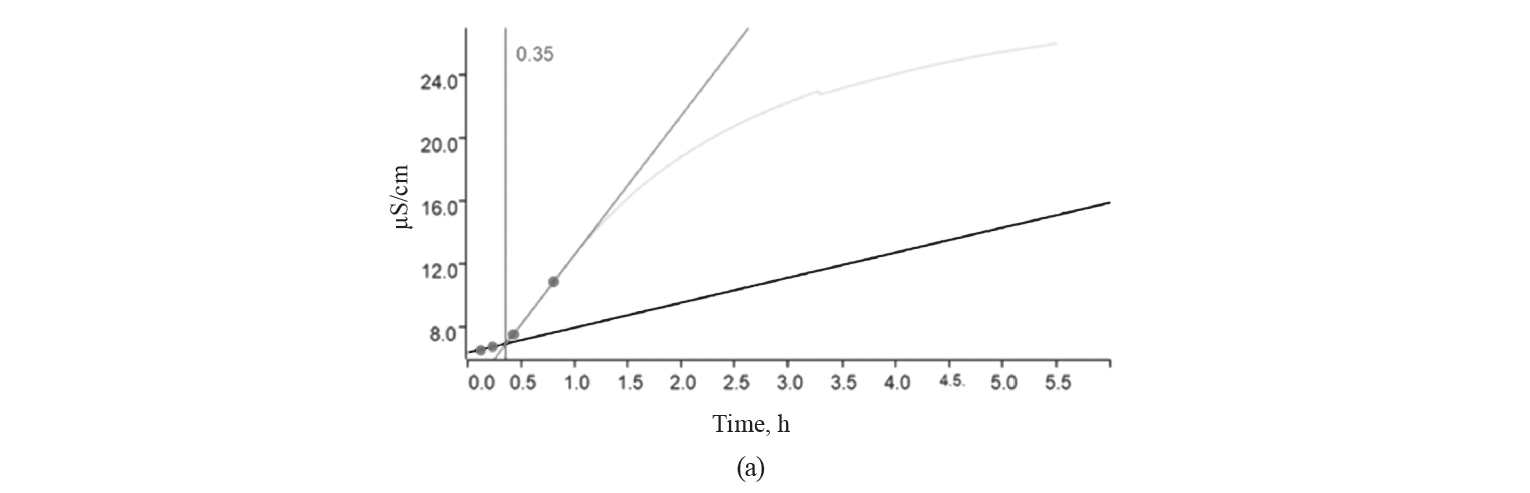
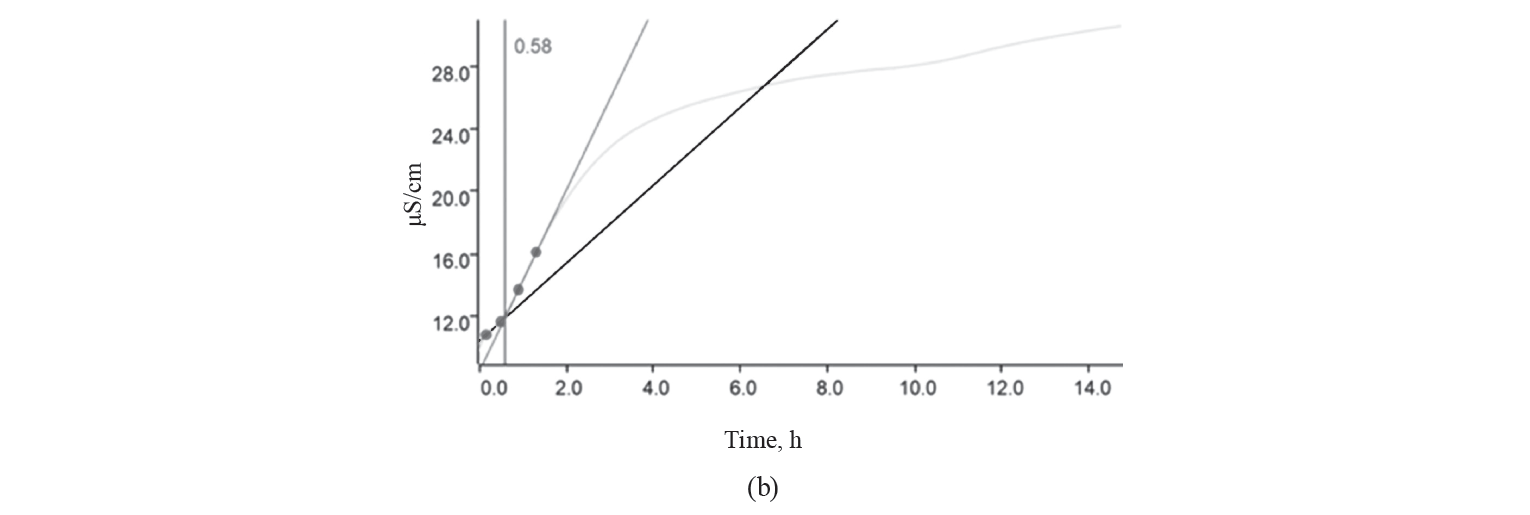
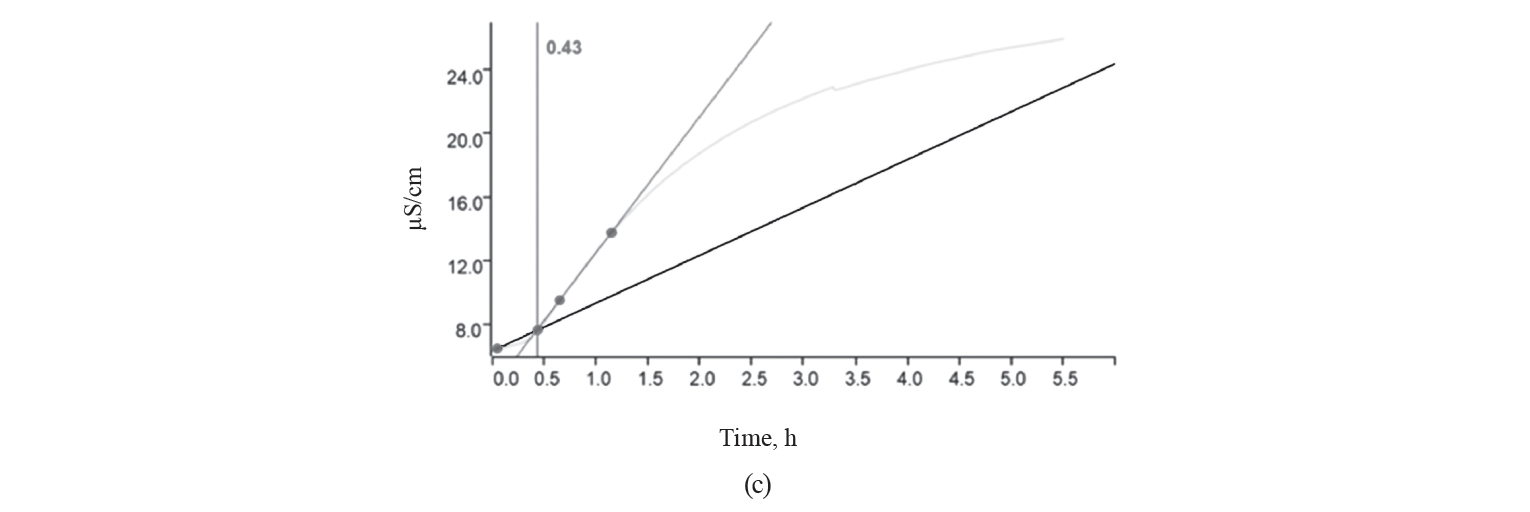
As we can see, the longer the induction time, the greater the oxidative stability. The induction time of the control, GCE, and EGCE were 0.35, 0.58, and 0.43 h, respectively. The kashk samples containing GCE (free or encapsulated) showed a longer induction time than the control due to GCE’s antioxidant activity. Noteworthily, food products supplemented with extracts rich in polyphenols have an increased antioxidant potential [2, 4, 28]. However, encapsulation shortened induction time, which was in contrast to [2, 29, 30]. Many studies that used microencapsulation managed to avoid the deterioration of unsaturated fatty acids by oxidation. Indeed, the wall materials surrounded droplets and protected them from environmental conditions [31–33]. As expected, canola oil is sensible to oxidation due to a high amount of unsaturated fatty acids [34].
pH. According to Table 2, the initial pH of the control was significantly higher than that of other samples (P < 0.05). It decreased from 4.04 to 3.81 during storage. However, the GCE kashk showed the reverse trend for 30 days, followed by a pH decrease (P < 0.05). We also found that higher GCE concentrations led to higher pH of the samples, even at the end of the storage period. According to Carvalho et al., the pH of GCE is approximately 5.77–5.95 [31].
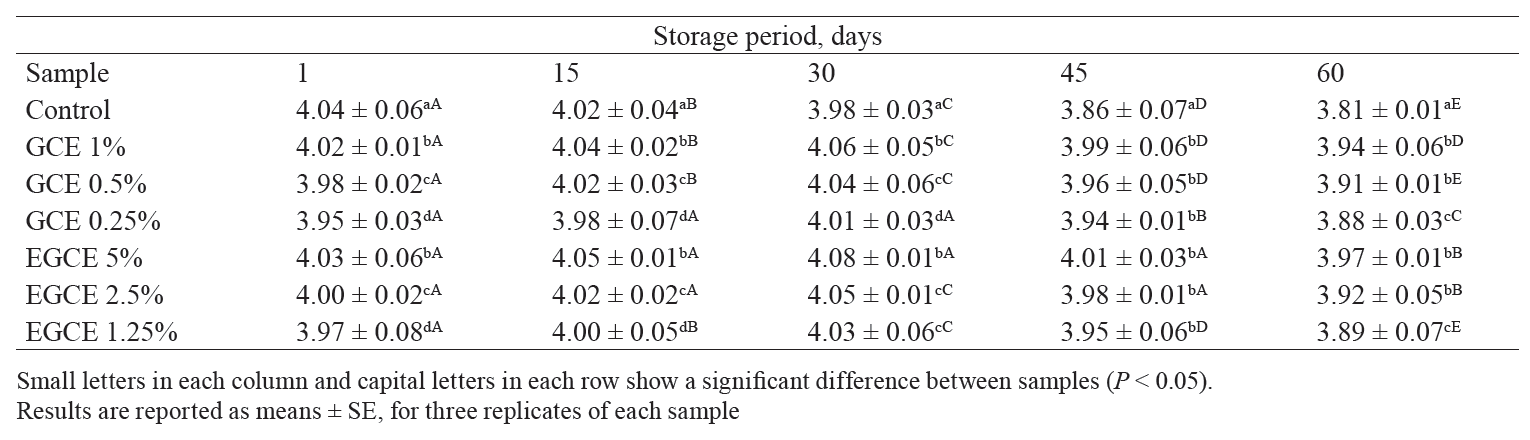
The acidity of all kashk samples containing GCE microencapsules also increased throughout the whole storage period, which was in agreement with Lee et al. [35]. This phenomenon was due to the production of lactic acid during storage. The activity of lactic acid bacteria, hydrolysis, and lipid oxidation resulted in lactic acid accumulation. Thus, the reduction of pH occured [36].
On the other hand, increased acidity during storage, called post-acidification, is attributed to the activity of kashk starter cultures at refrigerated temperature. They include Streptococcus thermophilus and Lactobacillus delbruekii subsp. bulgaricus that produce small amounts of lactic acid by fermenting lactose [37]. In addition, the positive effect of GCE on probiotic bacteria found in our study was confirmed by Marhamatizadeh et al. [38]. They reported that adding coffee extract at 0.4%, 0.8%, and 1.2% (w/v) had a positive effect on the fermentation and survival of probiotic bacteria in milk and yoghurt. According to Lee et al., the reduction of pH in all kashk samples containing GCE microencapsules was related to the production of lactic acid during storage [35].
Particle size distribution. The average particle size of the initial emulsion droplets is presented in Fig. 2. According to the curves, the droplets size was in the range of 3.20 to 8.51 μm.

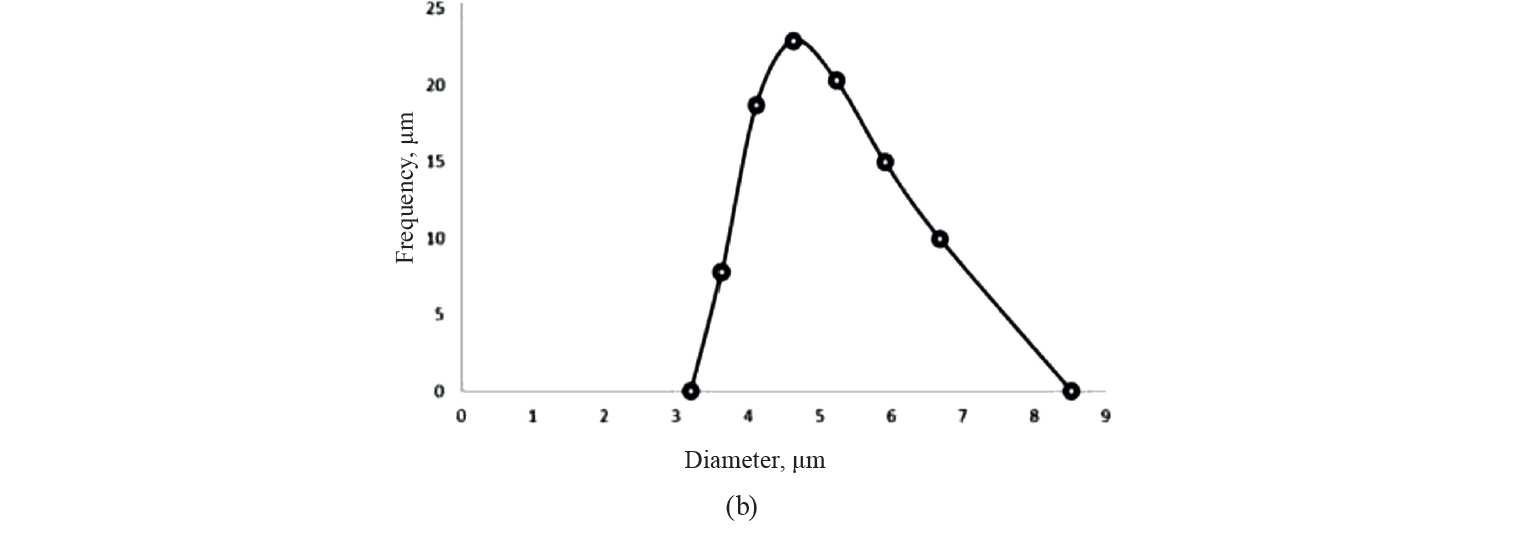
These results confirm a microscopic size of encapsulated emulsion droplets. Particle size has a great influence on such features as the surface oil and the final content of the ultimate encapsulated powder [39]. For instance, particles larger than 30 μm may create a sandy feel in the mouth. The average diameter of vegetable oil droplets was 32 μm in the initial emulsion and 1–4 μm in D-limonene primary emulsion [40, 41]. Our results were in agreement with Karim et al. and Silva et al. [29, 31].
FTIR analysis. The average values of typical FTIR spectra for GCE and EGCE are depicted in Fig. 3.
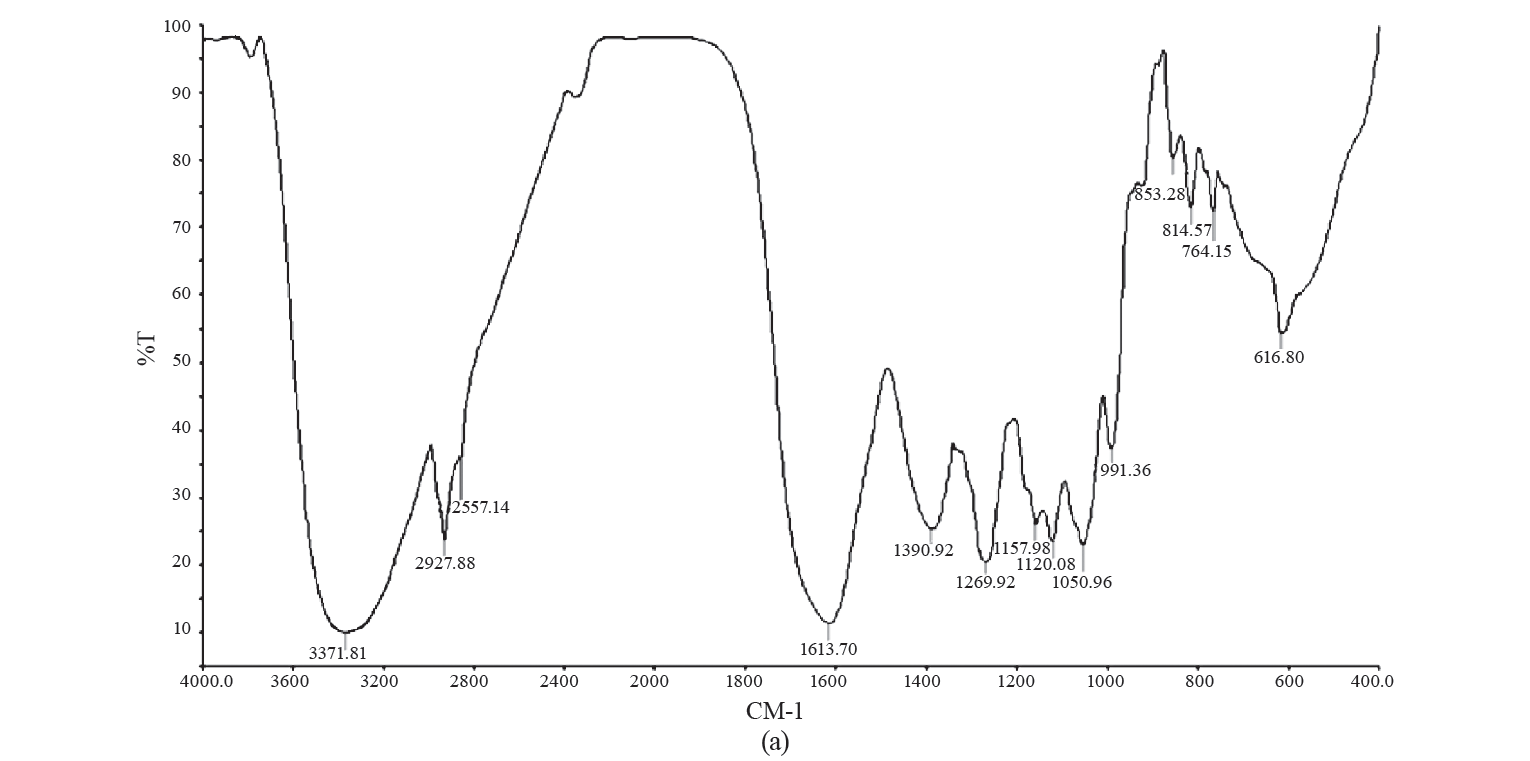
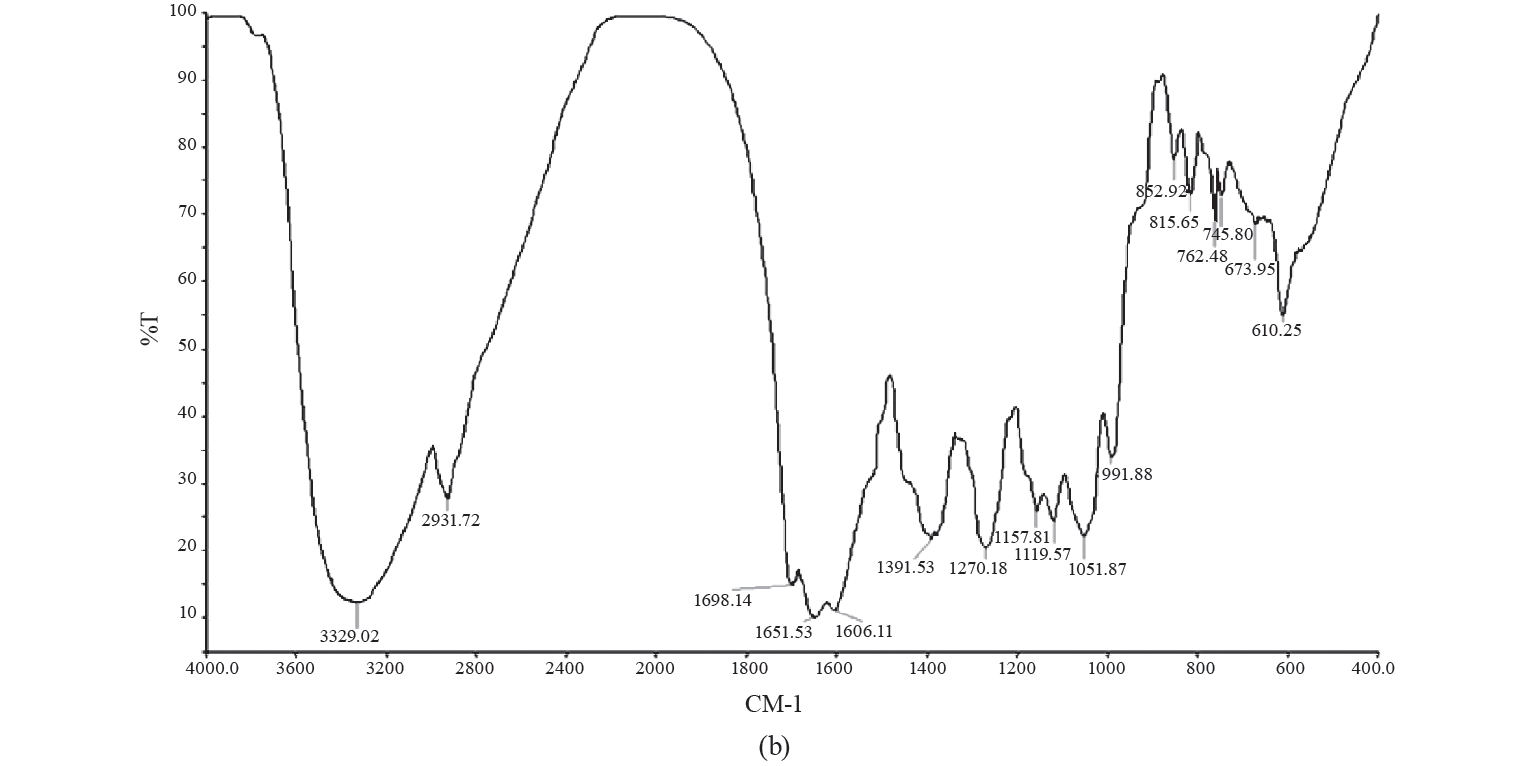
There, we can see characteristic broad low-frequency absorption bands at 3371 and 3329 cm−1 respectively, in the hydroxyl region (4000–3000 cm−1). These bands represented the stretching vibrations of O–H in the constituent sugar residues and adsorbed water [36]. We also observed three sharp peaks in the range of 3000 to 2800 cm–1 (2927, 2931, and 2852 cm–1) for both arabica and robusta roasted coffee samples, but no identification was attempted. Nonetheless, FTIR analysis of caffeine in soft drinks revealed two sharp peaks at 2882 and 2829 cm–1, which were attributed to the asymmetric stretching of C-H bonds of methyl (-CH3) group in the caffeine molecule and the peak region.
These findings were successfully used by Chemat et al. to develop predictive models for quantitative analysis of caffeine [42]. In their study, the wave number in the region between 1400–900 cm–1 was identified by vibrations of several types of bonds, including C-H, C-O, C-N, and P-O. The stretching of the cis = C-H and cis -C=C- at 1651 cm–1 was an indicator of unsaturated fatty acids in vegetable oils [1]. Alcohols, saturated aldehydes and α, β-unsaturated aldehydes are major secondary oxidation products. In the region between 1730–1680 cm–1, all aldehydes exhibit C=O stretching bands [2]. It is evident that carbonyl stretching around 1698 cm–1 may represent acetone [27]. The disappearance of peaks at 2857 cm–1 and the appearance of two peaks at 1698 and 1651 cm−1 in the EGCE treatment was due to the presence of canola oil and indicated well-encapsulated GCE.
Fatty acid composition. As can be seen in Table 3, the samples containing encapsulated GCE had a lower content of fatty acids than the others. The results indicated the protective role of encapsulation against the oxidation reaction. This finding was in agreement with the results of Fantoni et al. and Sun-Waterhouse et al. [19, 43]. In addition, EGCE treatment provided higher amounts of linoleic, oleic, and elaidic acids. The significant difference found in the contents of oleic and linoleic acids was due to the presence of canola oil in the encapsulated samples. Indeed, oleic acid and linoleic acid are two main fatty acids found in canola oil [44]. Dubois et al. claimed that oleic acid is the principal ingredient of various vegetable oils, including olive and rapeseed oils, and is a major dietary monoenoic acid [45]. Among PUFAs (polyunsaturated fatty acids), linoleic acid is the only one that reduces LDL-cholesterol. Consequently, encapsulation of canola oil has health benefits, as well as protective properties.
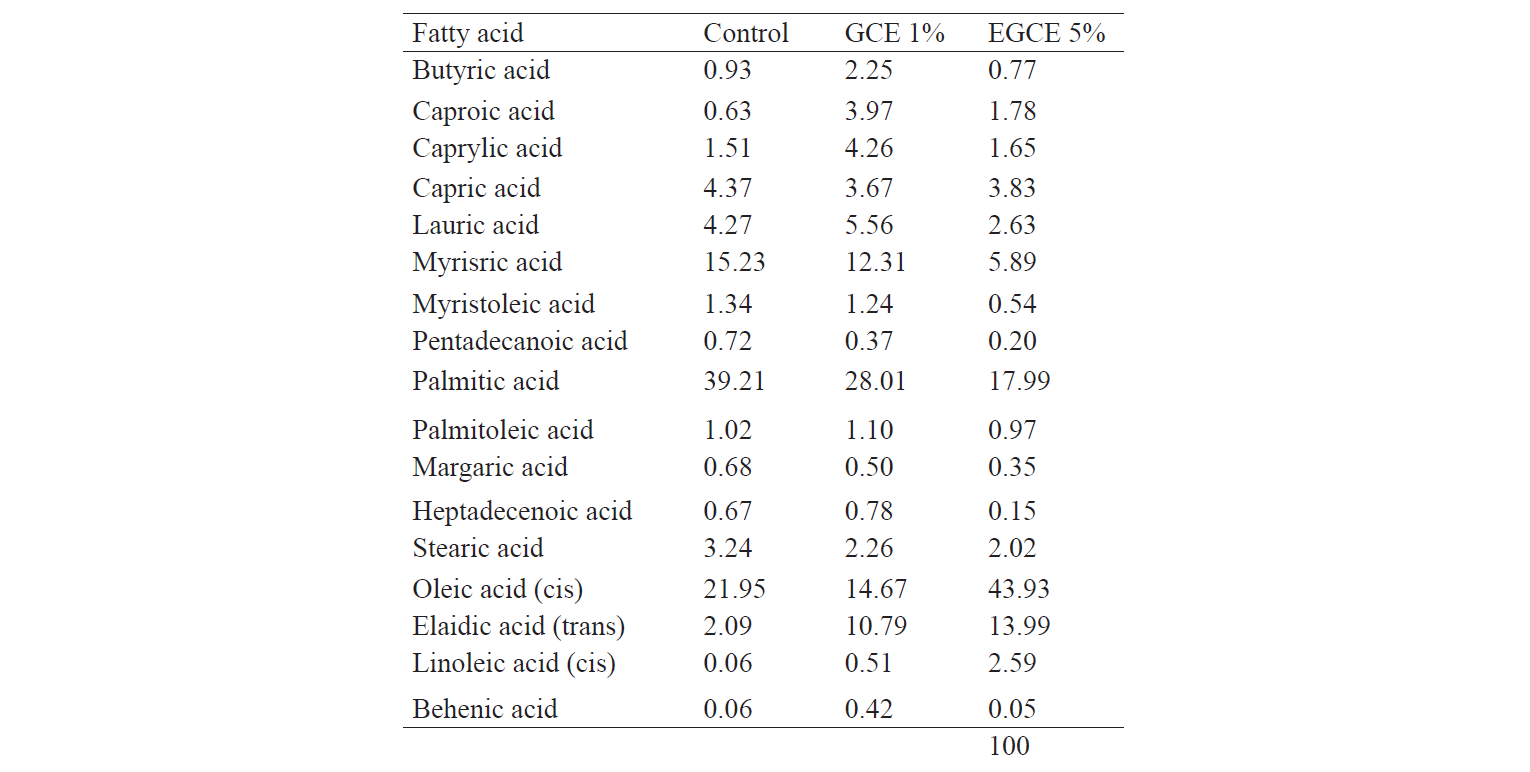
According to the fatty acid profile, the control had a slightly higher content of total saturated fatty acids than the GCE kashks, while the EGCE samples had the lowest. The EGCE had the largest content of PUFAs and MUFAs due to the presence of canola oil.
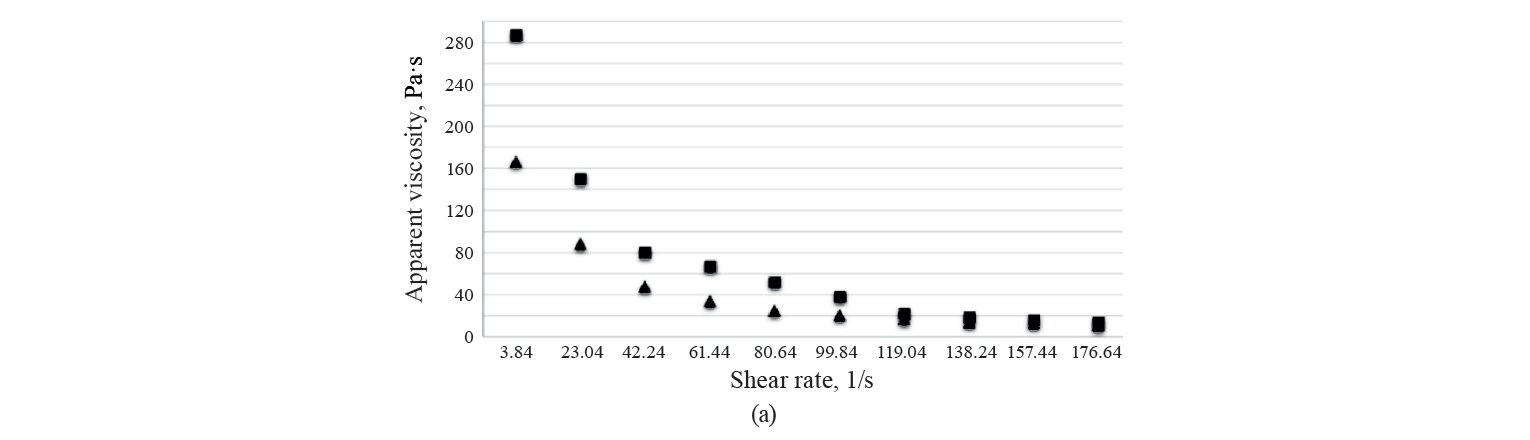
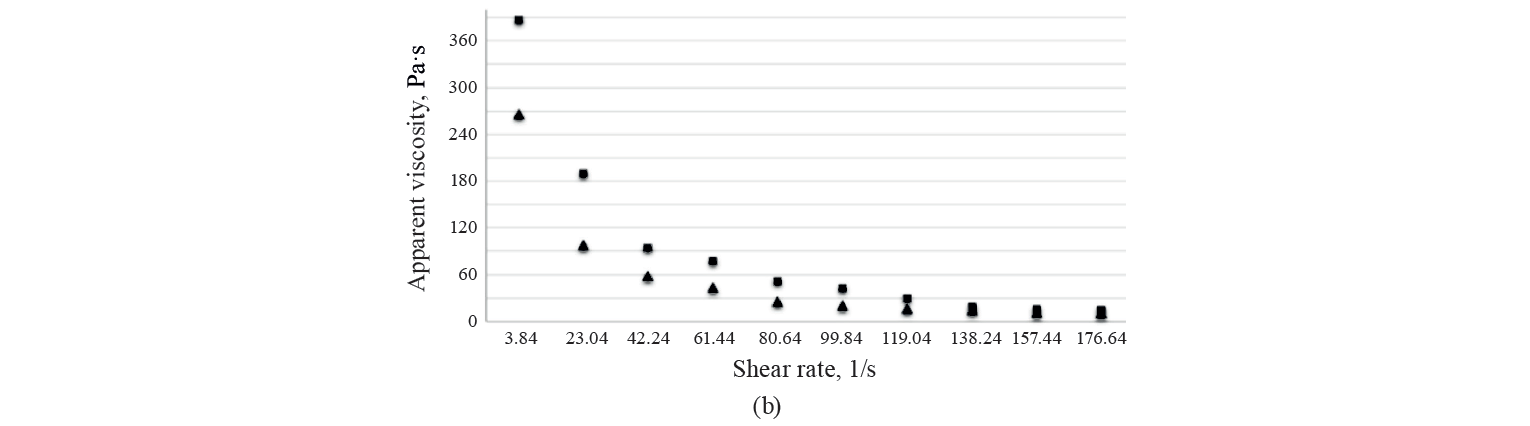
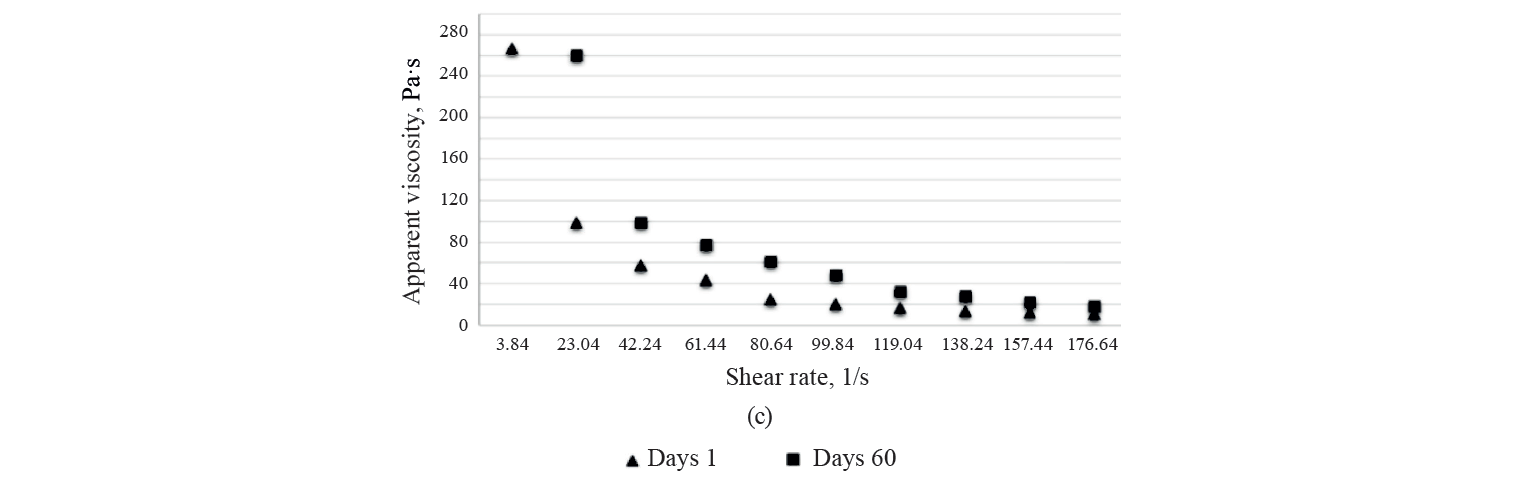
Rheological characteristics. The rheological parameters of the three kashk samples (control, GCE 1%, and EGCE 5%) on days 1 and 60 of the storage period are presented in Table 4. We found no significant differences in the viscosity of the treatments. As shown in Fig. 4, the samples’ viscosity increased after 60 days of storage. Noteworthily, post-acidification caused a decline in the negative electric charge of casein micelles by dissolving calcium and inorganic phosphate. It attenuates colloidal stability and subsequently casein becomes insoluble near its isoelectric pH (about 4.6). This phenomenon, strengthening protein-protein complexes and protein-polyphenol interaction, enhances serum released from the gel matrix and, at the same time, increases viscosity [46]. To explain the consistency coefficient, flow index, and yield stress of the samples, we used different rheological models, namely Power law, Bingham, and Casson models. According to R2 of the samples (higher than 0.97), the data fitted the Power Law model more than the others (Table 4). As can be seen, there were no significant differences in flow index values between all the samples at the beginning and at the end of storage (P > 0.05). The same trend was observed in the other model parameters throughout storage.
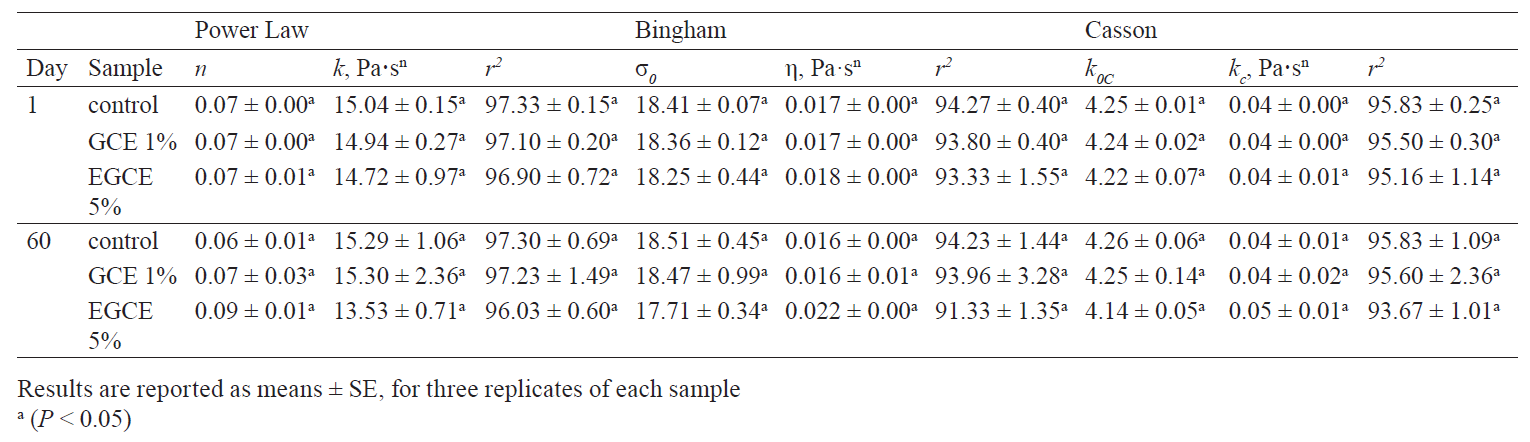
According to the Power law equation, the kashks containing GCE 1% and EGCE 5% had the highest and the lowest consistency coefficient on the first day of storage, respectively. At the end of storage, however, the control and the EGCE 5% kashk had the lowest (0.064) and the highest (0.090) flow index.
In Bingham’s equation, the control had the lowest (0.016) and the EGCE 5% sample had the highest (0.018) consistency coefficient at the beginning of storage. The same trend was revealed on day 60. The highest yield stress (18.51) was observed in the control and the lowest (17.71) in the EGCE 5% kashk on day 60. Further, no significant differences were seen among the samples.
The Casson equation showed the same trend at the end of storage. However, we recorded the lowest yield stress (4.14) in EGCE 5% and the highest (4.26) in the control on day 60. Values within this range were found in kashk with and without the addition of gum tragacanth [1]. A higher consistency coefficient and a lower flow index can be considered appropriate to achieve a high viscosity and a clean mouthfeel [1]. Overall, all the samples showed a plastic-shear thinning behavior because of lower flow index (n) values (< 1) and a higher consistency coefficient.
Color. Table 5 summarizes the color characteristics of the kashk samples supplemented with GCE on days 1 and 60.
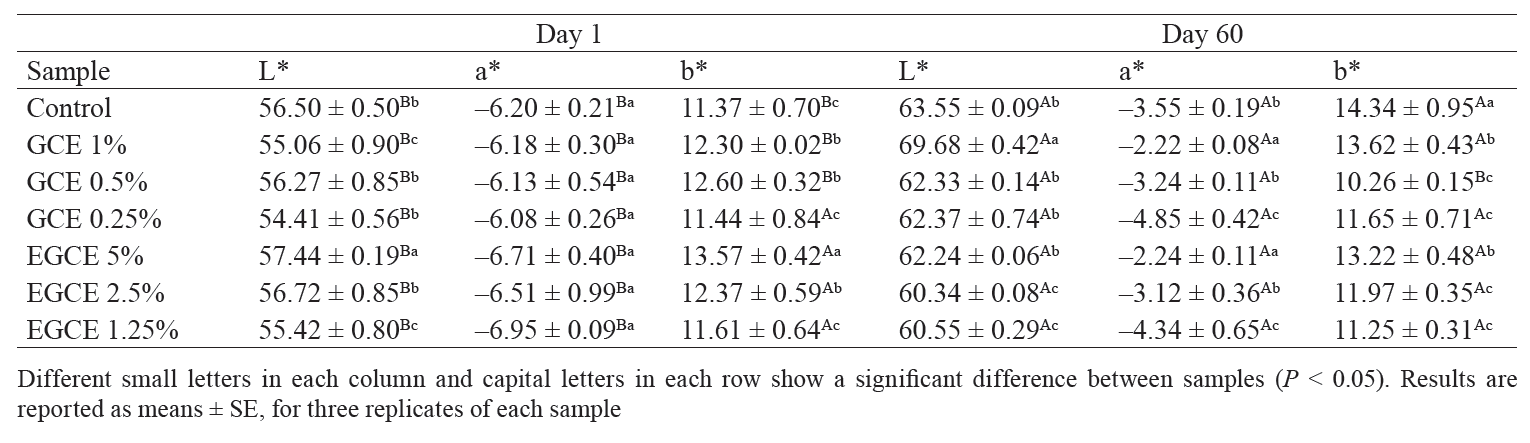
Increasing the concentration of GCE (microencapsulated or free) led to higher b* and L* values. We found that the highest b* value was related to the brownish yellow color of coffee extract. Among all the samples, those incorporated with microencapsulated GCE had higher b* and L* values compared with the others (P < 0.05). The higher L* value might be due to the reflection properties of lipid droplets or microencapsulated particles.
In general, we noticed no differences in the a* value of the kashk samples incorporated with GCE (free or microencapsulated). The L* and a* values of all the treatments increased throughout storage (60 days) (P < 0.05). However, the b* value did not change significantly in the microencapsulated GCE samples, while increasing considerably in the control (P < 0.05) due to the brownish yellow color of coffee extract. This result was in agreement with the studies of Lee et al. and Alavi et al. who reported enhanced L* and a* values in yoghurt enriched with powder peanut sprout extract microcapsules during 16 days [35, 36]. However, the b* value remained almost unchanged.
Sensory analysis. Sensory attributes of the samples were evaluated on the first and last days of storage (Fig. 5).
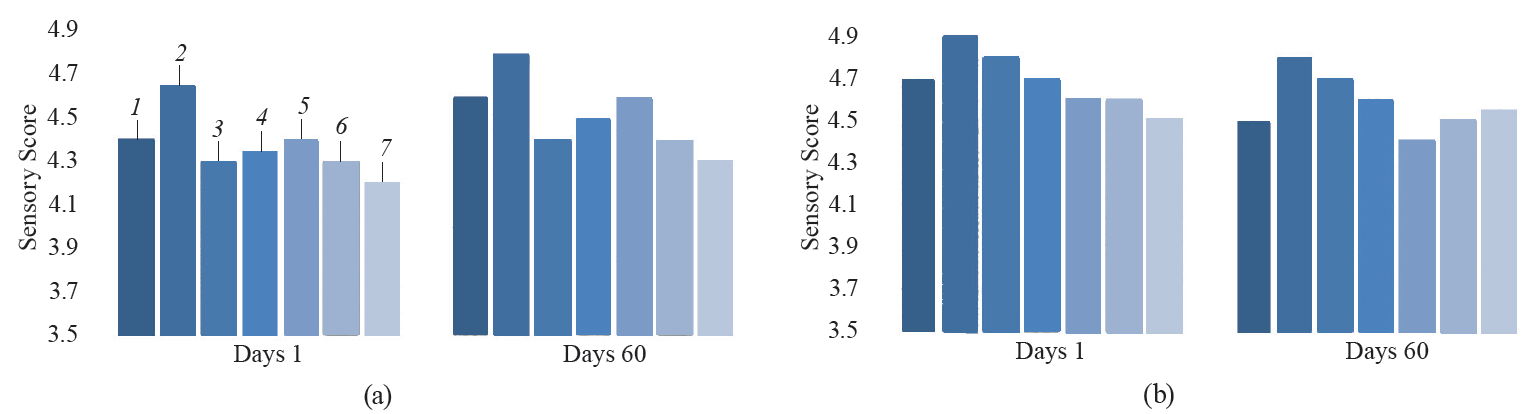
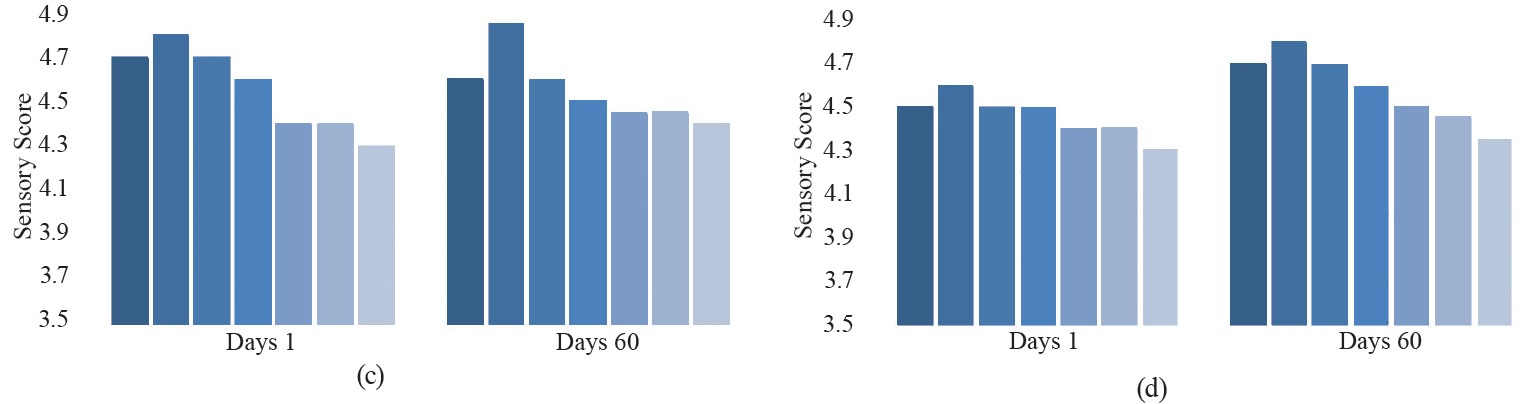

We found significant differences between the color of the kashk samples at the beginning (P < 0.05). The GCE 1% sample had a higher score, whereas the EGCE 0.25% had a lower score (P < 0.05). The color of all the samples improved throughout storage. The GCE 1% had a better score, which was attributed to the light greenish yellow color of the coffee extract. However, it seems that GCE encapsulation protected the color of the kashk samples. As expected, the product with GCE 1% (free form) had better odor, taste, consistency, and overall acceptancy than the others.
Among all the samples, the EGCE 1.25% kashk obtained a lower score (P < 0.05). As predicted, the odor of kashk containing a free form of GCE improved with the concentration increased. This finding confirms a positive effect of GCE on kashk products. Nevertheless, a decline in odor was observed during storage due to the loss of some volatile compounds. We found that the samples’ consistency improved with the extract concentration (free form) increased. Overall, the kashk fortified with GCE 1% was favored by the assessors, possibly due to its oily appearance.
Nonetheless, the type of microencapsulation technique influences the protective effects of odor/flavor components. For instance, Rodrigues et al. used cashew gum and Arabic gum as a wall material for microencapsulation of coffee extract during spray drying [47]. Both Arabic gum and cashew gum had similar aroma protective effect and showed no differences between the control and experimental samples. Furthermore, there is some dependence between the product’s sensory properties and the type of herbal extract. Ribeiro et al. evaluated the color parameter of cottage cheese incorporated with free and encapsulated mushroom extract and revealed no changes in cottage cheese color [16]. However, the samples’ color improved after 7 days (P < 0.05). Also, Gurkan et al. analyzed the taste and flavor characteristics of yogurt enriched with basil (Ocimum basilicum L.) powder or extract during three weeks of storage at 4°C [48]. They identified 49 volatile compounds which enhanced the sensory score of yogurts. The presence of some volatile carboxylic acids gave yogurt an acceptable acidic taste.
ВЫВОДЫ
We employed a W/O emulsion to encapsulate GCE in kashk at different concentrations. Among all the samples, the kashk incorporated with a high amount of GCE had a higher pH. However, pH reduced throughout storage due to the production of a small amount of lactic acid. Furthermore, GCE possessed antioxidant activity, mainly due to its high phenolic content, and the samples containing GCE and EGCE had high oxidative stability. In addition, we confirmed a protective effect of encapsulation against the oxidation reaction. The EGCE sample had higher contents of only three free fatty acids (linoleic, oleic, and elaidic) due to the presence of canola oil in its composition. The control had the highest content of total saturated fatty acids.
The FTIR spectra indicated that the GCE was well encapsulated. The rheological behavior of the samples, a plastic-shear thinning behavior, fitted the Power Law model more than the others. Since particles larger than 30 μm may create a sandy feel in the mouth and the emulsion droplets in our study had a micrometer size lower than 30 μm, we could claim that the EGCE kashk had the best texture. Adding GCE (free and microencapsulated) to kashk affected its sensory properties. The kashk with 1% of GCE was preferred by the assessors. In addition, the coffee aroma was felt at the end of storage, which is a positive effect of using GCE in dairy products. Finally, GCE encapsulation protected the color of the samples and the b* value remained unchanged, while lightness (L*) increased. Overall, using a W/O emulsion can be successfully employed as a technique for GCE encapsulation in kashk and the resulting product can be offered to consumers as an alternative type of flavored dairy product.
БЛАГОДАРНОСТИ
The authors thank the Department of Food Science at Sarvestan Islamic Azad University for their great assistance during the research. We did not receive any specific grants from funding agencies in the public, commercial or not-for-profit sectors.
СПИСОК ЛИТЕРАТУРЫ
- Adam F, Abert-Vian M, Peltier G, Chemat F. “Solvent-free” ultrasound-assisted extraction of lipids from fresh microalgae cells: A green, clean and scalable process. Bioresource Technology. 2012;114:457–465. DOI: https://doi.org/10.1016/j.biortech.2012.02.096.
- Aguiar J, Estevinho BN, Santos L. Microencapsulation of natural antioxidants for food application – The specific case of coffee antioxidants – A review. Trends in Food Science & Technology. 2016;58:21–39. DOI: https://doi.org/10.1016/j.tifs.2016.10.012.
- Zain MZM, Baba AS, Shori AB. Effect of polyphenols enriched from green coffee bean on antioxidant activity and sensory evaluation of bread. Journal of King Saud University Science. 2018;30(2):278–282. DOI: https://doi.org/10.1016/j.jksus.2017.12.003.
- Budryn G, Zaczynska D, Oracz J. Effect of addition of green coffee extract and nanoencapsulated chlorogenic acids on aroma of different food products. LWT – Food Science and Technology. 2016;73:197–204. DOI: https://doi.org/10.1016/j.lwt.2016.06.019.
- Dziki D, Gawlik-Dziki U, Pecio L, Rozylo R, Swieca M, Krzykowski A, et al. Ground green coffee beans as a functional food supplement – Preliminary study. LWT – Food Science and Technology. 2015;63(1):691–699. DOI: https://doi.org/10.1016/j.lwt.2015.03.076.
- Bisht S, Sisodia S. Coffea arabica: A wonder gift to medical science. Journal of Natural Pharmaceuticals. 2010;1(1): 58–62. DOI: https://doi.org/10.4103/2229-5119.73595.
- Bidchol AM, Wilfred A, Abhijna P, Harish R. Free radical scavenging activity of aqueous and ethanolic extract of Brassica oleracea L. var. italica. Food and Bioprocess Technology. 2011;4(7):1137–1143. DOI: https://doi.org/10.1007/s11947-009-0196-9.
- Chatterjee D, Bhattacharjee P. Comparative evaluation of the antioxidant efficacy of encapsulated and un-encapsulated eugenol-rich clove extracts in soybean oil: Shelf-life and frying stability of soybean oil. Journal of Food Engineering. 2013;117(4):545–550. DOI: https://doi.org/10.1016/j.jfoodeng.2012.11.016.
- Ezhilarasi PN, Indrani D, Jena BS, Anandharamakrishnan C. Freeze drying technique for microencapsulation of Garcinia fruit extract and its effect on bread quality. Journal of Food Engineering. 2013;117(4):513–520. DOI: https://doi.org/10.1016/j.jfoodeng.2013.01.009.
- Martins A, Barros L, Carvalho AM, Santos-Buelga C, Fernandes IP, Barreiro F, et al. Phenolic extracts of Rubus ulmifolius Schott flowers: characterization, microencapsulation and incorporation into yogurts as nutraceutical sources. Food and Function. 2014;5(6):1091–1100. DOI: https://doi.org/10.1039/c3fo60721f.
- Silva PI, Stringheta PC, Teofilo RF, de Oliveira IRN. Parameter optimization for spray-drying microencapsulation of jaboticaba (Myrciaria jaboticaba) peel extracts using simultaneous analysis of responses. Journal of Food Engineering. 2013;117(4):538–544. DOI: https://doi.org/10.1016/j.jfoodeng.2012.08.039.
- Ballesteros LF, Ramirez MJ, Orrego CE, Teixeira JA, Mussatto SI. Encapsulation of antioxidant phenolic compounds extracted from spent coffee grounds by freeze-drying and spray-drying using different coating materials. Food Chemistry. 2017;237:623–631. DOI: https://doi.org/10.1016/j.foodchem.2017.05.142.
- Getachew AT, Chun BS. Optimization of coffee oil flavor encapsulation using response surface methodology. LWT – Food Science and Technology. 2016;70:126–134. DOI: https://doi.org/10.1016/j.lwt.2016.02.025.
- Palupi NW, Praptiningsih Y. Oxidized tapioca starch as an alginate substitute for encapsulation of antioxidant from coffee residue. International Conference on Food, Agriculture and Natural Resources, Ic-Fanres 2015. 2016;9: 304–308. DOI: https://doi.org/10.1016/j.aaspro.2016.02.136.
- Tran T, Green NL, Ghosh S, Rousseau D. Encapsulation of water-in-oil emulsion droplets within crystal spheroids. Colloids and Surfaces A: Physicochemical and Engineering Aspects. 2017;524:1–7. DOI: https://doi.org/10.1016/j.colsurfa.2016.12.054.
- Ribeiro A, Ruphuy G, Lopes JC, Dias MM, Barros L, Barreiro F, et al. Spray-drying microencapsulation of synergistic antioxidant mushroom extracts and their use as functional food ingredients. Food Chemistry. 2015;188:612–618. DOI: https://doi.org/10.1016/j.foodchem.2015.05.061.
- Golmakani MT, Rezaei K, Mazidi S, Razavi SH. γ-Linolenic acid production by Arthrospira platensis using different carbon sources. European Journal of Lipid Science and Technology. 2012;114(3):306–314. DOI: https://doi.org/10.1002/ejlt.201100264.
- Fantoni CM, Cuccio AP, Barrera-Arellano D. Brazilian encapsulated fish oils: Oxidative stability and fatty acid composition. Journal of the American Oil Chemists Society. 1996;73(2):251–253. DOI: https://doi.org/10.1007/bf02523904.
- Chang PR, Yu JG, Ma XF. Preparation of porous starch and its use as a structure-directing agent for production of porous zinc oxide. Carbohydrate Polymers. 2011;83(2):1016–1019. DOI: https://doi.org/10.1016/j.carbpol.2010.08.076.
- Demirel Z, Yilmaz-Koz FF, Karabay-Yavasoglu UN, Ozdemir G, Sukatar A. Antimicrobial and antioxidant activity of brown algae from the Aegean sea. Journal of the Serbian Chemical Society. 2009;74(6):619–628. DOI: https://doi.org/10.2298/jsc0906619d.
- Naidu MM, Sulochanamma G, Sampathu SR, Srinivas P. Studies on extraction and antioxidant potential of green coffee. Food Chemistry. 2008;107(1):377–384. DOI: https://doi.org/10.1016/j.foodchem.2007.08.056.
- Alothman M, Bhat R, Karim AA. Antioxidant capacity and phenolic content of selected tropical fruits from Malaysia, extracted with different solvents. Food Chemistry. 2009;115(3):785–788. DOI: https://doi.org/10.1016/j.foodchem.2008.12.005.
- Farah A, Donangelo CM. Phenolic compounds in coffee. Brazilian Journal of Plant Physiology. 2006;18(1):23–36. DOI: https://doi.org/10.1590/S1677-04202006000100003.
- Jeszka-Skowron M, Stanisz E, De Pena MP. Relationship between antioxidant capacity, chlorogenic acids and elemental composition of green coffee. LWT – Food Science and Technology. 2016;73:243–250. DOI: https://doi.org/10.1016/j.lwt.2016.06.018.
- Naik GH, Priyadarsini KI, Satav JG, Banavalikar MM, Sohoni DP, Biyani MK, et al. Comparative antioxidant activity of individual herbal components used in Ayurvedic medicine. Phytochemistry. 2003;63(1):97–104. DOI: https://doi.org/10.1016/s0031-9422(02)00754-9.
- Yashin A, Yashin Y, Wang JY, Nemzer B. Antioxidant and antiradical activity of coffee. Antioxidants. 2013;2(4): 230–245. DOI: https://doi.org/10.3390/antiox2040230.
- Brezova V, Slebodova A, Stasko A. Coffee as a source of antioxidants: An EPR study. Food Chemistry. 2009;114(3):859–868. DOI: https://doi.org/10.1016/j.foodchem.2008.10.025.
- Sainsbury J, Grypa R, Ellingworth J, Duodu KG, De Kock HL. The effects of antioxidants and shelf life conditions on oxidation markers in a sunflower oil salad dressing emulsion (SOSDE). Food Chemistry. 2016;213:230–237. DOI: https://doi.org/10.1016/j.foodchem.2016.06.081.
- Karim FT, Ghafoor K, Ferdosh S, Al-Juhaimi F, Ali E, Bin Yunus K, et al. Microencapsulation of fish oil using supercritical antisolvent process. Journal of Food and Drug Analysis. 2017;25(3):654–666. DOI: https://doi.org/10.1016/j.jfda.2016.11.017.
- Ifeduba EA, Akoh CC. Microencapsulation of stearidonic acid soybean oil in complex coacervates modified for enhanced stability. Food Hydrocolloids. 2015;51:136–145. DOI: https://doi.org/10.1016/j.foodhyd.2015.05.008.
- Carvalho AGS, Silva VM, Hubinger MD. Microencapsulation by spray drying of emulsified green coffee oil with two-layered membranes. Food Research International. 2014;61:236–245. DOI: https://doi.org/10.1016/j.foodres.2013.08.012.
- Zhong JF, Yang R, Cao XY, Liu X, Qin XL. Improved physicochemical properties of yogurt fortified with fish oil/γ-oryzanol by nanoemulsion technology. Molecules. 2018;23(1). DOI: https://doi.org/10.3390/molecules23010056.
- Robert P, Fredes C. The encapsulation of anthocyanins from berry-type fruits. Trends in foods. Molecules. 2015;20(4):5875–5888. DOI: https://doi.org/10.3390/molecules20045875.
- Wang W, Waterhouse GIN, Sun-Waterhouse D. Co-extrusion encapsulation of canola oil with alginate: Effect of quercetin addition to oil core and pectin addition to alginate shell on oil stability. Food Research International. 2013;54(1):837–851. DOI: https://doi.org/10.1016/j.foodres.2013.08.038.
- Lee Y-K, Al Mijan M, Ganesan P, Yoo S, Kwak H-S. The physicochemical properties of yoghurt supplemented with microencapsulated peanut sprout extract, a possible functional ingredient. International Journal of Dairy Technology. 2013;66(3):417–423. DOI: https://doi.org/10.1111/1471-0307.12047.
- Alavi N, Golmakani MT. Improving oxidative stability of virgin olive oil by addition of microalga Chlorella vulgaris biomass. Journal of Food Science and Technology-Mysore. 2017;54(8):2464–2473. DOI: https://doi.org/10.1007/s13197-017-2689-2.
- Chuyen HV, Nguyen MH, Roach PD, Golding JB, Parks SE. Microwave-assisted extraction and ultrasound-assisted extraction for recovering carotenoids from Gac peel and their effects on antioxidant capacity of the extracts. Food Science & Nutrition. 2018;6(1):189–196. DOI: https://doi.org/10.1002/fsn3.546.
- Marhamatizadeh MH, Ehsandoost E, Gholami P. The effect of coffee extract on the growth and viability of Lactobacillus acidophilus and Bifidobacterium bifidum in probiotic milk and yoghurt. Journal of Food Biosciences and Technology. 2014;4(1):37–48.
- Jafari SM, Assadpoor E, He YH, Bhandari B. Encapsulation efficiency of food flavours and oils during spray drying. Drying Technology. 2008;26(7):816–835. DOI: https://doi.org/10.1080/07373930802135972.
- Fuchs M, Turchiuli C, Bohin M, Cuvelier ME, Ordonnaud C, Peyrat-Maillard MN, et al. Encapsulation of oil in powder using spray drying and fluidised bed agglomeration. Journal of Food Engineering. 2006;75(1):27–35. DOI: https://doi.org/10.1016/j.jfoodeng.2005.03.047.
- Soottitantawat A, Bigeard F, Yoshii H, Furuta T, Ohkawara M, Linko P. Influence of emulsion and powder size on the stability of encapsulated D-limonene by spray drying. Innovative Food Science & Emerging Technologies. 2005;6(1):107–114. DOI: https://doi.org/10.1016/j.ifset.2004.09.003.
- Chemat F, Rombaut N, Sicaire AG, Meullemiestre A, Fabiano-Tixier AS, Abert-Vian M. Ultrasound assisted extraction of food and natural products. Mechanisms, techniques, combinations, protocols and applications. A review. Ultrasonics Sonochemistry. 2017;34:540–560. DOI: https://doi.org/10.1016/j.ultsonch.2016.06.035.
- Sun-Waterhouse D, Zhou J, Miskelly GM, Wibisono R, Wadhwa SS. Stability of encapsulated olive oil in the presence of caffeic acid. Food Chemistry. 2011;126(3):1049–1056. DOI: https://doi.org/10.1016/j.foodchem.2010.11.124.
- Mir Z, Goonewardene LA, Okine E, Jaegar S, Scheer HD. Effect of feeding canola oil on constituents, conjugated linoleic acid (CLA) and long chain fatty acids in goats milk. Small Ruminant Research. 1999;33(2):137–143. DOI: https://doi.org/10.1016/s0921-4488(99)00016-4.
- Dubois V, Breton S, Linder M, Fanni J, Parmentier M. Fatty acid profiles of 80 vegetable oils with regard to their nutritional potential. European Journal of Lipid Science and Technology. 2007;109(7):710–732. DOI: https://doi.org/10.1002/ejlt.200700040.
- Donmez O, Mogol BA, Gokmen V. Syneresis and rheological behaviors of set yogurt containing green tea and green coffee powders. Journal of Dairy Science. 2017;100(2):901–907. DOI: https://doi.org/10.3168/jds.2016-11262.
- Rodrigues RAF, Grosso CRF. Cashew gum microencapsulation protects the aroma of coffee extracts. Journal of Microencapsulation. 2008;25(1):13–20. DOI: https://doi.org/10.1080/02652040701725486.
- Gurkan H, Hayaloglu AA. Volatiles and sensory characteristics of yogurt manufactured by incorporating basil (Ocimum basilicum L.). International Journal of Food Properties. 2017;20:S779–S789. DOI: https://doi.org/10.1080/10942912.2017.1311344.
