

Аннотация
Flax seeds are an excellent source of polyunsaturated fatty acids and high-grade protein. They are also rich in non-starch polysaccharides that are concentrated in their mucus cells. Flaxseed polysaccharides are soluble dietary fibres, which makes them an indispensable functional food ingredient. They can also serve as an additive, thus improving the structure of food, e.g. as a stabilizer, structure former, water and fat retention agent, etc. According to various researches, the functional and technological properties of polysaccharide flaxseed products are largely determined by the ratio of polysaccharide fractions and protein content, which depend on the production process. This research featured the effect of the method of obtaining flaxseed polysaccharide products on the protein content. The study employed chemical analysis and attenuated total internal reflection infrared spectroscopy (ATR-IR). The protein polysaccharide products under analysis were obtained by water extraction from two varieties of whole flax seed (Russia), under various conditions of treatment, cleaning, and fractionation. The conditions included pH, temperature, and process time. During water extraction of whole flax seeds, polypeptide-containing polysaccharide complexes were removed from the seed coats. The number, composition, and binding force between the peptide fragments and the polysaccharide matrix depended on the technological parameters of the process. The polysaccharide products were tested for total protein content. The results were consistent with the band intensity in the range of 1700–1500 cm–1, where protein carbonyl groups are usually manifested.Ключевые слова
Flax seeds, polysaccharides, proteins, extraction, IR-spectra of polysaccharide productsВВЕДЕНИЕ
Polysaccharides have remained in the centre of scientific attention for several decades. Previously, polysaccharides were used mainly as auxiliary substances in the pharmaceutical industry and were considered as biologically active substances. However, they are currently used as functional food ingredients and technological additives in many areas of food industry.
Polysaccharides are highly beneficial for human organism. According to various researches, polysaccharides can produce pronounced antihypoxic, expectorant, anti-inflammatory, immunotropic, enterosorbing, hepatoprotective, hypolipidymic, antitumour, and general tonic effects [1, 2].
Polysaccharides ensure the quality and texture of food products, e.g. hardness, brittleness, density, thickening, viscosity, stickiness, gel-forming ability, etc. Many food products owe their soft, fragile, swollen, or jelly-like structure to polysaccharides. Their impressive variety of functions can be explained by the structural properties of individual polysaccharides used as food additives. They act as a gelling, thickening, filling, emulsifying, swelling, or foaming agent. They can prevent crystallization and syneresis. They increase both viscosity and the biological and nutritional value of the product. No other food additive can perform such a variety of functions.
and technological properties, as well as their effect on biological activity, are studied by such modern methods as nuclear magnetic resonance (NMR), infrared spectroscopy, ultraviolet imaging, etc. [3, 4].
Flax seeds are known not only as a source of polyunsaturated fatty acids and high-grade protein, but also as a source of non-starch polysaccharides that are concentrated in their mucus cells. Non-starch polysaccharides represent a group of low-digestible carbohydrates, or dietary fibre [5]. The polysaccharides of flaxseed mucus are highly soluble in water. They also reduce the glycaemic index and cholesterol. In addition, they possess a prebiotic effect [6, 7].
The polysaccharides of flaxseed mucus are a mixture of two fractions – neutral (75%) and acidic (25%) [8–10]. The neutral fraction has a high molecular weight and contains arabinoxylan, while the acidic fraction contains ramnegalacturonan. Flaxseed polysaccharide complex contains 4–20% of proteins, depending on the flax genotype and extraction conditions [10]. Proteins are bound with acidic fraction polymers by non-covalent bonds, while no protein has been found in the neutral fraction.
Flaxseed polysaccharides are a source of soluble dietary fibre, which is an indispensable functional food ingredient. They are also a technological additive that regulates the structure of food mass and can act as a stabiliser, structure former, water and fat-holding agent, etc. The functional properties that affect food systems may result from the synergistic effect they produce together with proteins [11]. According to Qian et al., an acidic fraction with 8% of protein showed higher emulsion properties as compared with the neutral fraction [12]. Functional and technological properties of flaxseed polysaccharide products are also determined by the ratio of fractions, which depends on the conditions of the technological process. According to Kaushik et al., the ratio of neutral and acidic fractions fell from 6.7 to 5.7 when the extraction temperature reached 90°C, while water absorption capacity and emulsion activity decreased [13].
Flaxseed polysaccharides have good prospects as a multifunctional food ingredient. However, there are not enough data on their component composition, functional and technological properties, and production conditions. Flax seeds of Russian varieties remain especially understudied.
The research objective was to use IR-spectroscopy to study the effect of the method of obtaining flaxseed polysaccharide products on the protein content.
ОБЪЕКТЫ И МЕТОДЫ ИССЛЕДОВАНИЯ
The comparative study featured polysaccharide products extracted from two Russian varieties of whole flax seeds. The first variety was industrial and corresponded with State Standard 10582-76. The second variety was of LM-98 brand. All the products differed in extraction conditions: pH, temperature, time, and extraction rate. The technological operations included the following areas:
– neutral extraction at pH 6–7;
– acidic extraction at pH 4–5;
– fractionation of the polysaccharide complex obtained in the neutral medium;
– combined sequential extraction.
Distilled water was used to extract polysaccharides from flax seeds by constant stirring. The ratio of seed mass and solvent volume (hydromodule) was 1:20. The extract obtained was separated from the flax seeds using a 4-layer gauze filter. After that, the target product was obtained in two ways:
(1) The extract was dried in a thin layer of ≤ 0.5 cm at 60–65°C and then crushed to obtain a dry extract of polysaccharides;
(2) Polysaccharides were precipitated in a 3-fold excess of ethanol. The residue was pressed, washed with acetone, and dried in a drying cabinet at ≤ 50°C to obtain a purified polysaccharide complex.
Thus, the main study objects were the dry extract of polysaccharides (PS-extract) and a purified polysaccharide complex (PS-complex). Protein content was determined according to State Standard 13496.4-93.
A Tensor 37 Fourier spectrometer (Bruker, Germany) was used to define the IR-spectra of ATR-IR on the surface of the dry samples. The device had an ATR diamond element. The OPUS software package had standard calibration capabilities in the frequency range of 4000–500 cm–1 (32 scans) in absorption format.
РЕЗУЛЬТАТЫ И ИХ ОБСУЖДЕНИЕ
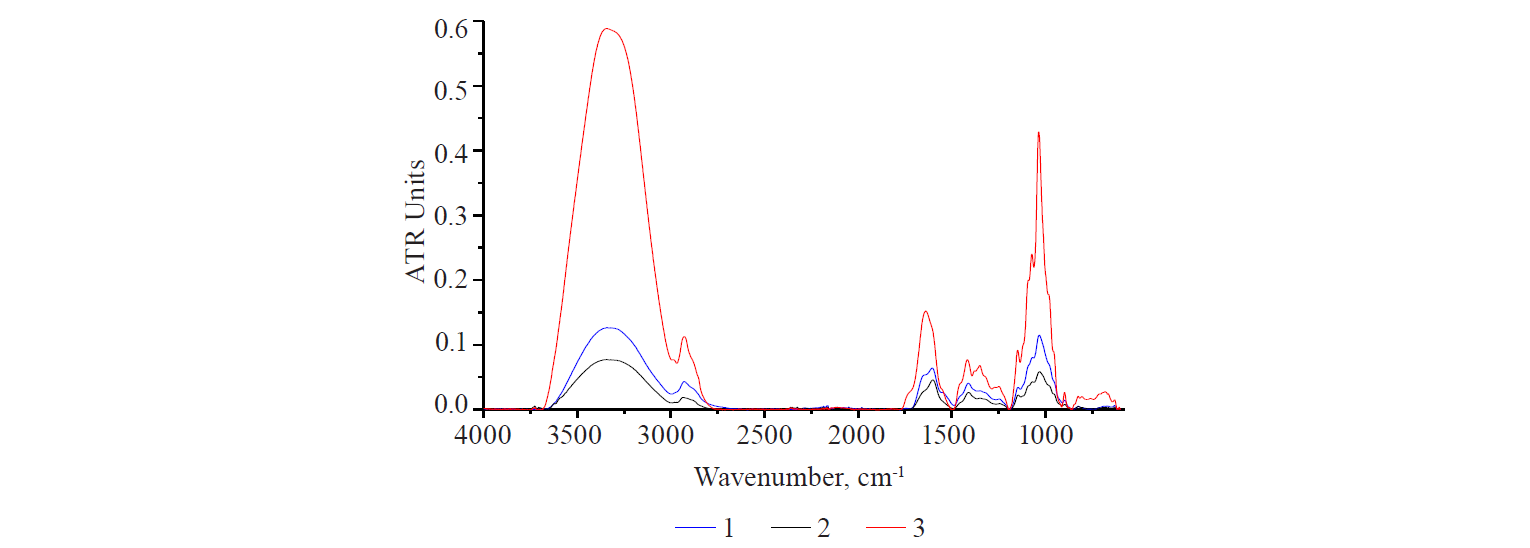
Spectra language. Natural polysaccharides, as a rule, are not pure substances but multicomponent and diverse complexes. They may include protein and lipid components or their fragments. These fragments can be identified by vibrational spectroscopy. To give a clearer interpretation, Fig.1 illustrates the IR-spectra of three main classes of biological substances: proteins, lipids, and carbohydrates. They were obtained from dry samples of polysaccharide obtained from flax seeds, egg albumin, and linseed oil. In the spectrum of egg albumin, proteins appeared as a pair of typical bands in the range of 1680–1540 cm–1. They were caused by the vibrations of the carbonyl C=O groups of Amide I and Amide II [14, 15]. The spectrum of flaxseed oil is typical of plant and animal lipids. It is clearly different from the spectrum of other substances. The narrow band at 1743 cm–1 was caused by the vibrations of C=O groups of fatty acids in triglycerides. The trident-shaped band with a peak at 1160 cm–1 was due to the vibrations of C–O and C–O–C bonds of carboxylic acids.
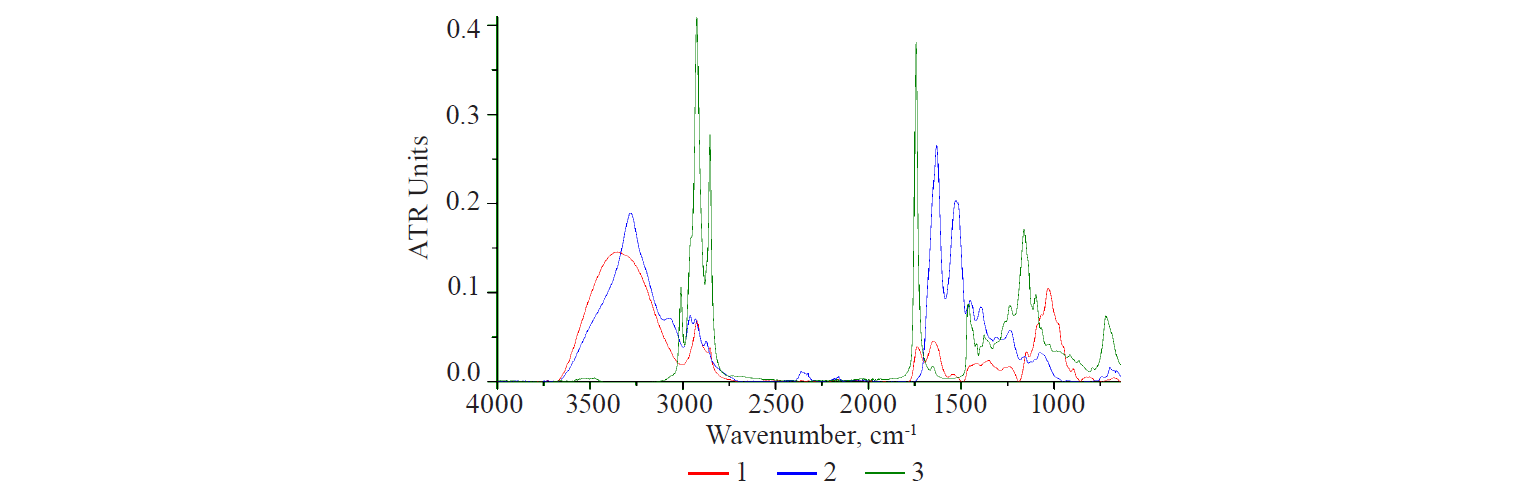
A broad structured band with a peak at 1030 cm–1 is typical of polysaccharides. It partially overlapped the lipid band (1160 cm–1). The spectra of all three samples contained bands in the range of 3010–2800 cm–1, which reflected the vibrations of CHn functional groups that appeared in all classes of substances. Lipids with unsaturated fatty acids in their composition were marked with stretching and bending bands of CH functional group with a CH double bond (3008 cm–1 and 722 cm–1, respectively). Vibrations of OH groups often overlap in the range of 3400–3220cm–1. These are bound water molecules and NHn groups, which quite clearly manifest themselves in the albumin spectrum as bands of different intensity with peaks at 3250 and 3020 cm–1.
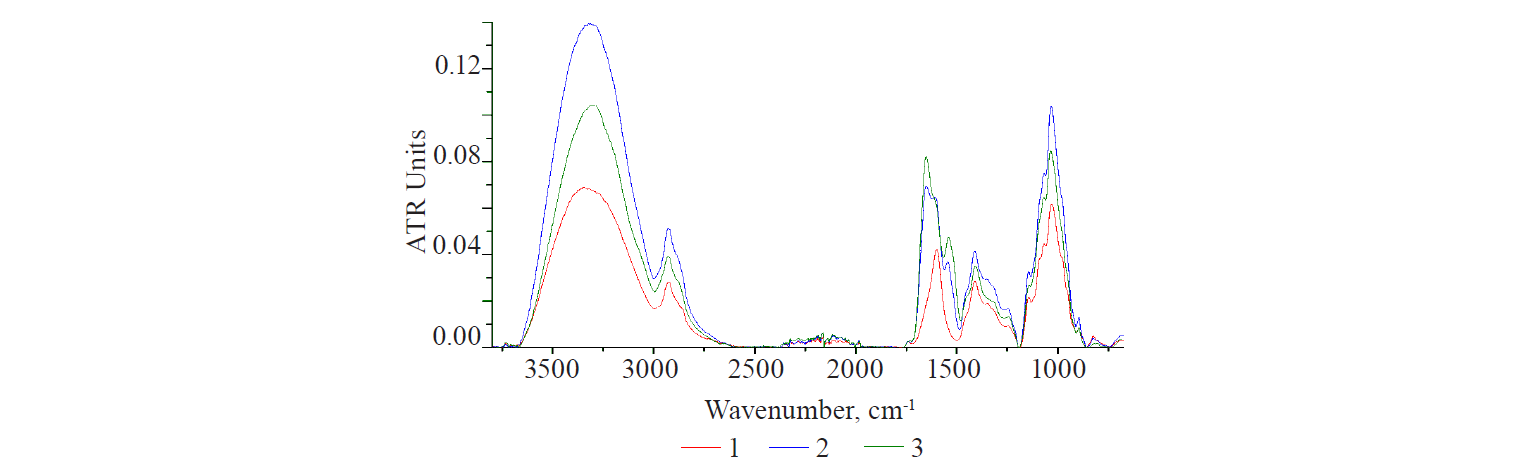
The optical characteristics of various polysaccharides showed some remarkable results, if compared. Figure 2 demonstrates the spectra of dry preparations of plant and animal polysaccharides. According to the structure of all bands, animal polysaccharides differed from plant polysaccharides. However, they had a common spectral absorption region, although there can be no absolute coincidence of bands on the wave-number scale.
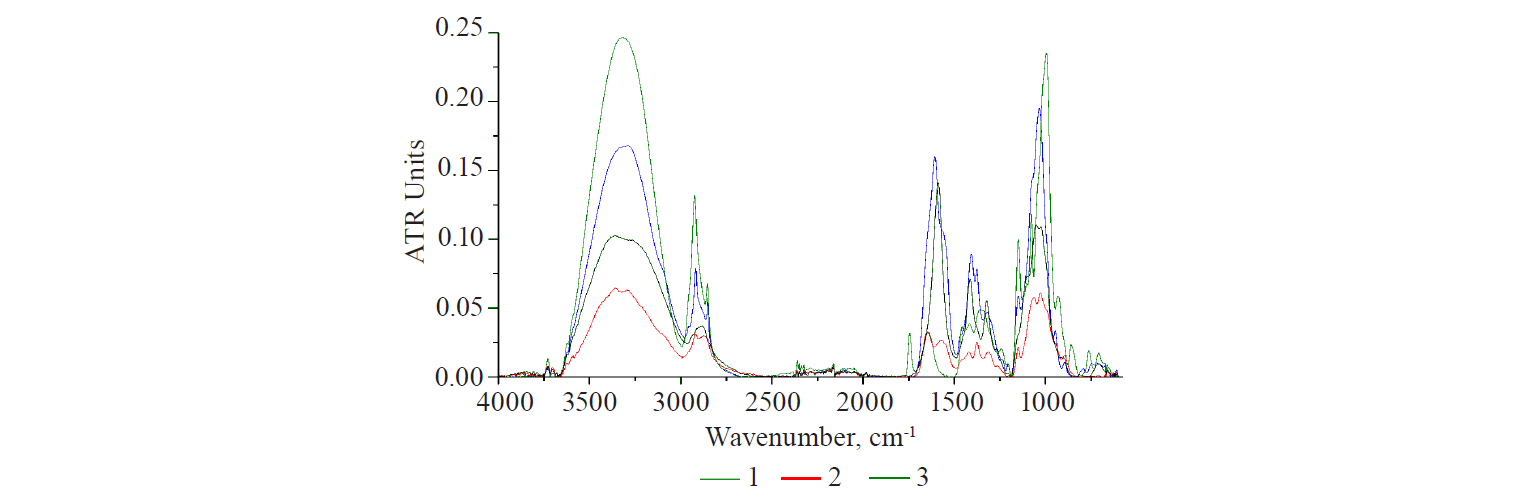
Hyaluronic acid is the main carbohydrate component of the mucopolysaccharides in animal connective tissue [16, 17]. In the area of protein structures (1700–1500 cm–1), its spectrum showed an intense band with a shoulder on the right branch. This was due to the hyaluronic acid dimer, which had carbonyls (C=O) in the COOH group and the CONH group, a peptide bond analogue. The mucopolysaccharide spectrum showed an intense structured carbohydrate band with a peak at 1031 cm–1, which was typical of plant polysaccharides.
Chitosan is obtained from chitin and is a precursor of a number of glycosaminoglycans. The chitin deacetylation reaction is incomplete [16, 17]. As a result, it contained up to 30% of residual acetyl groups bound to the amine CH3CONH. CONH-composition is typical of hyaluronic acid. It was the presence of the CONHcomposition in the structure of chitosan that explained a narrow intense band with a peak at 1640 cm–1 in its spectrum.
Starch and cellulose showed one and two weak bands in this region, respectively. They might result from both the natural properties of the samples and the technological features of the production process. Thus, the granules of insoluble starch are enclosed in a thin protein shell, which is partially damaged during grinding, washing, and drying. Its manifestation can be seen in the starch spectrum. To obtain soluble starch, the protein shell of starch granules is destroyed by acid treatment. Currently, starch can be obtained synthetically. This starch is identical to the natural product, except that it lacks the granular structure typical of natural plant products. Cellulose production is much more complicated and includes a greater number of chemical treatment stages.
All linear polymers, i.e. hyaluronic acid, chitosan, and cellulose, have bands with adjacent peaks, according to the analysis of the structure of the carbohydrate band in the polysaccharide spectra. Chitosan and cellulose are structural analogues [18]. The intensity of the bands with double peaks in their spectra is significantly lower than that of mucopolysaccharide. Starch is a mixture of branched and helicoid macromolecules of two polysaccharides: amylopectin and amylase. Starch is clearly separated from the group. The peak of its broad band is bathochromically shifted by 40 cm–1 from the peak of linear polysaccharides.
1. Products of primary and secondary flaxseed extraction in neutral medium (pH 6–7). In Minevich et al., we described the kinetics of primary extraction of polysaccharides from industrial flax seeds in a neutral medium at 60°C [19]. The time interval was 5–120 min, and standard methods of chemical analysis were used as control. However, we would like to point it out again that the extraction process proceeds in steps. According to our own results, supported by various scientific data, the process starts with low molecular weight fractions entering the solution and ends with high molecular weight fractions doing the same. All the fractions contained various amounts of protein components.
Figure 3 shows the kinetics of extraction process studied by means of IR-spectroscopy. The intensity of the bands in the range of 1540–1680 cm–1 at different extraction times correlated with the total protein content measured by chemical methods. The fractions that entered the solution in the first 10 min presumably contained the maximum amount of protein substances (8.6%). The next peak in the total protein content (17%) could be explained by the fact that it was released directly from the nucleus when the seed coat swelled and partially slipped off.
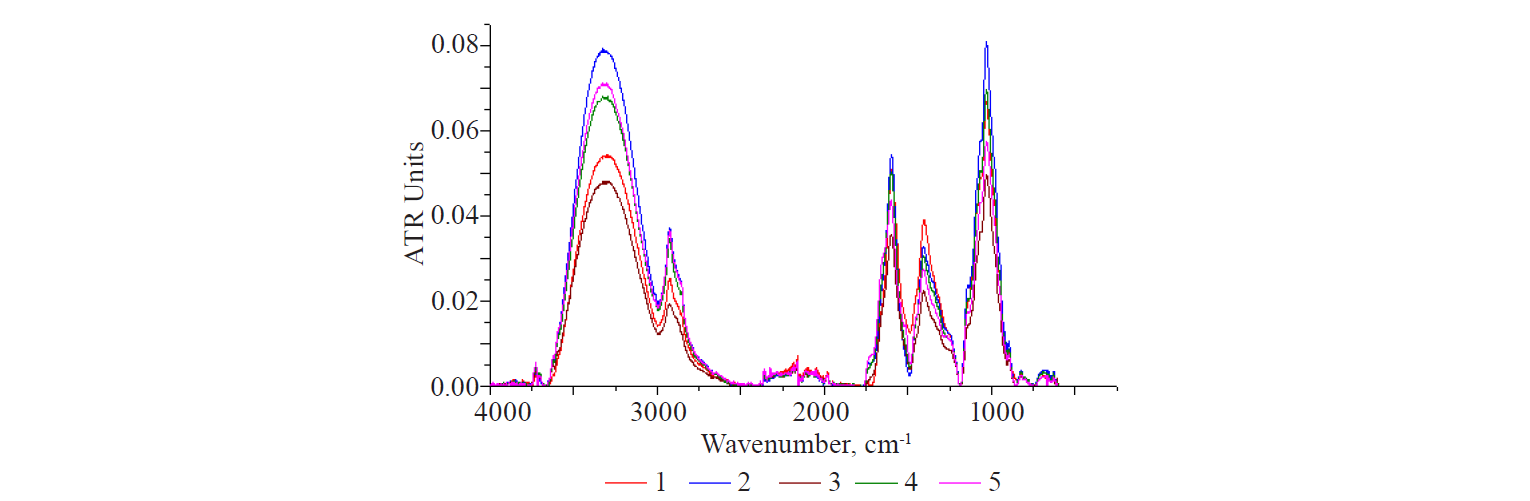
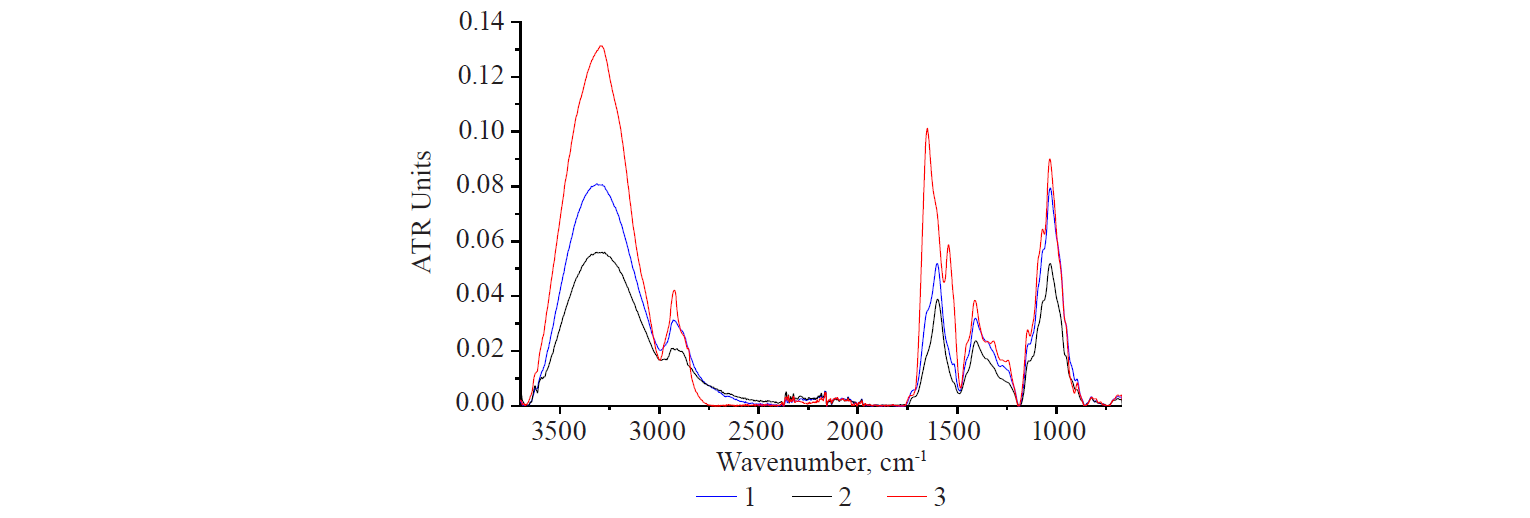
Protein constituents were present in all extraction products obtained from whole flax seeds, both in the PS-extracts and in the PS-complexes. It was indicated by a broad structured band of 1540–1680 cm–1. The spectra of the obtained extraction products were compared with the egg albumin spectrum (Fig. 1, curve 2). However, the results suggested that water extraction released polysaccharides with polypeptide fragments of different composition and, possibly, size. This assumption was confirmed by the increase in the fragment of this region (Fig. 4a). All the samples had a single band with variously structured peaks in the range of 1595–1605 cm–1.
Only the spectrum of sample 5 (25 min) showed two clear undifferentiated bands in the form of a structured shoulder (≈ 1670 cm–1 and 1520 cm–1) on the right and left branches of the global peak. This, in turn, could indicate a different binding force, both of the washed out polysaccharide segments and the protein components. The longer the sample contacted with the solvent, the lower the binding force.
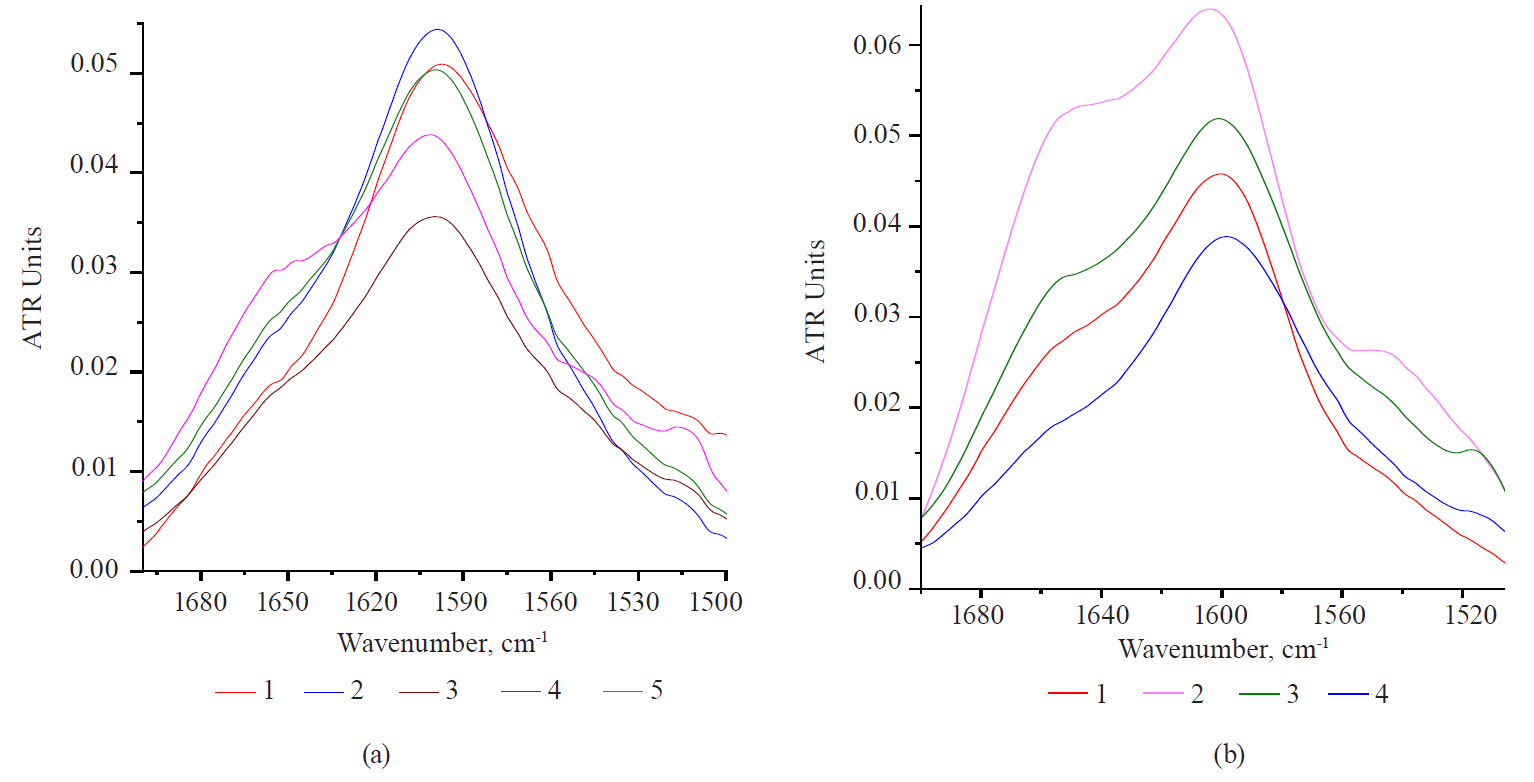
In our previous research, we analysed this fragment of the spectra for the PS-extracts and PS-complexes obtained from industrial and LM-98 flax seeds under identical conditions (60°C, 20 min), as in Fig. 4b [19]. All samples showed structuring of the global band (1590 cm–1) with the same wave numbers in varying degrees. However, it was most pronounced in the products derived from industrial flax seeds (1640 and 1540 cm–1). Moreover, in all the cases under consideration, the structure of the global band was more clearly manifested in the position and shape of the left, high-frequency branch of the band.
In addition, differences in the structure of the bands in these samples suggested a greater variety of chemical bonds between the protein and polysaccharide in the PS-extract obtained from industrial flax seeds. In its spectrum, the right branch of the central peak revealed a clear band in the range of 1540 cm–1. The band was practically absent in the spectrum of PS-extract obtained from LM-98 variety.
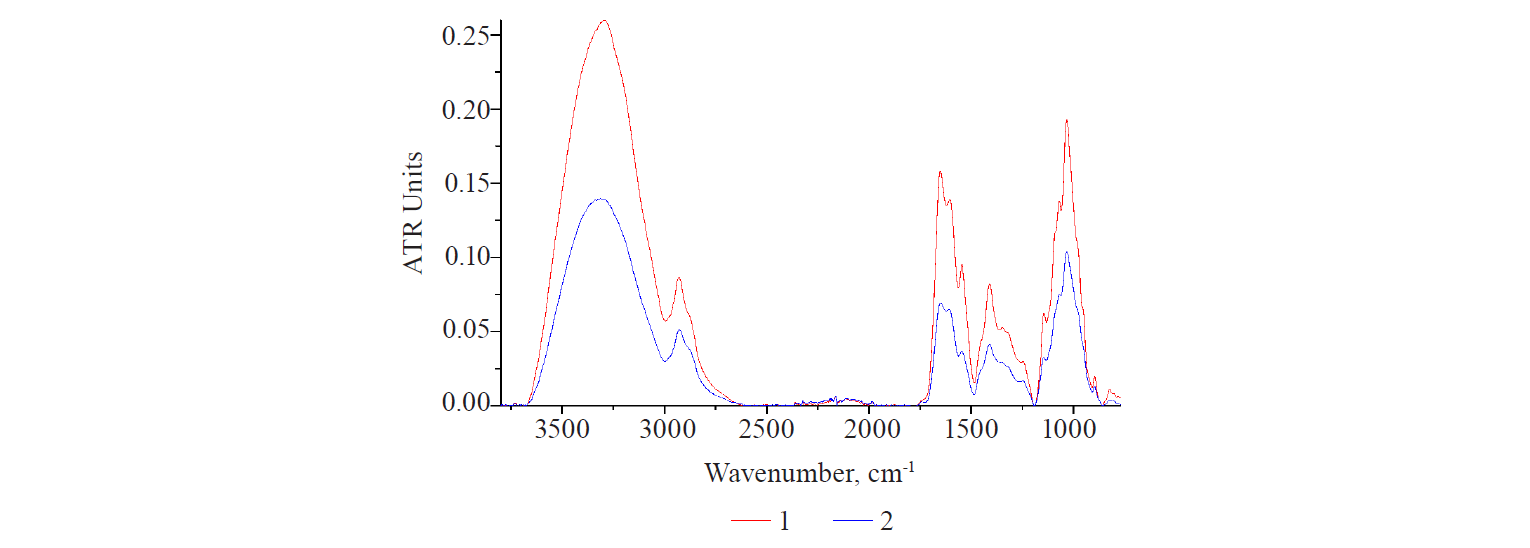
An analysis of the full spectra (Fig. 5) showed the following results. Dry PS-extracts obtained in the primary extraction cycle (curves 1 and 2) had similar spectra of polysaccharide bands. However, the spectrum of the PS-extract obtained from industrial flax seeds was higher throughout the entire wave range. It may indicate a higher degree of extractability of both the polysaccharide and protein components from the raw material of this variety.
Curves 1 and 3 characterized the spectra of primary and secondary PS-extracts from industrial flax seeds. Their comparison showed that they had almost identical structure of the bands: the highest peak corresponded to the position of the left shoulder, while the second, less intense peak corresponded to the position of the right shoulder. The central maximum in the spectrum of the primary PS-extract corresponded to a small right-sided shoulder in the spectrum of the secondary PS-extract. This suggested a redistribution of the contribution of fractions of different forms of polypeptide structures with a polysaccharide base. Thus, an increase in extraction cycles could trigger significant changes in the structure of the entire protein-carbohydrate complex.
PS-complexes of secondary extraction were obtained to study the possibility of an additional extraction cycle that could follow the separation of primary extracts and the re-treatment of the oil cake. Table 1 features the conditions and results of both extraction cycles. However, unlike the secondary cycle, the primary extraction had different technological parameters.

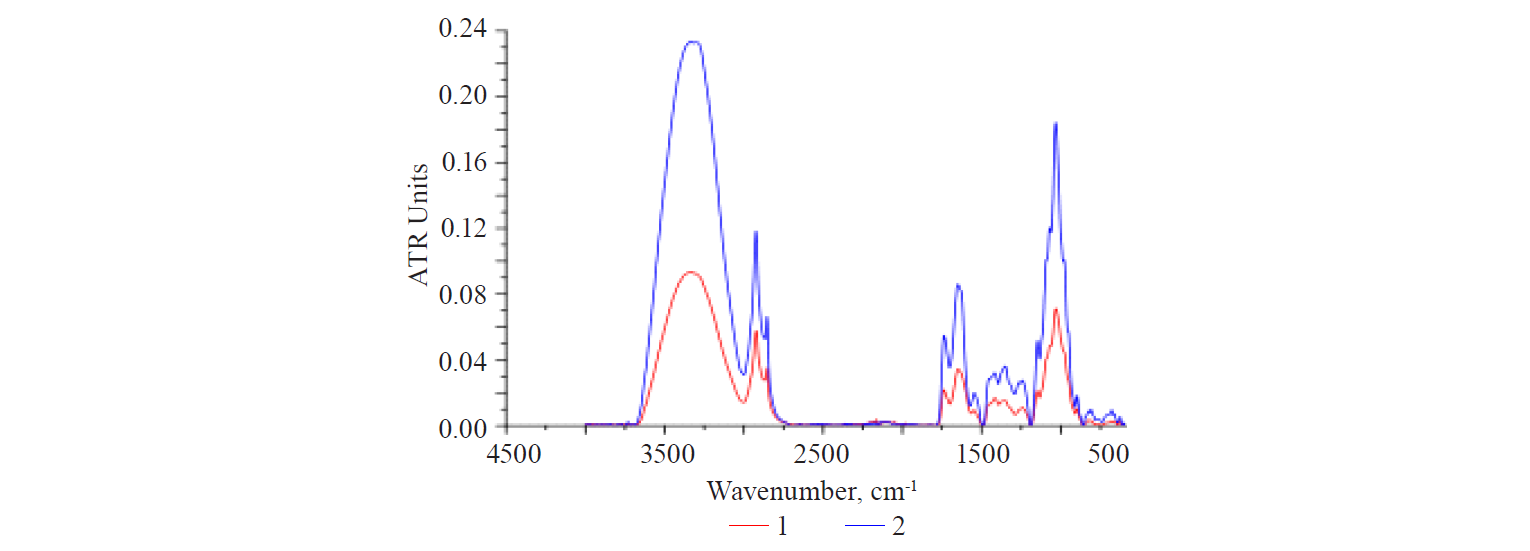
Figure 6 shows a comparative study of the spectral parameters of polysaccharide products of secondary extraction. The position of the peaks, as well as the shape and pattern of the bands show that these parameters are almost identical qualitatively. The main difference was in the intensity of the bands, which was much higher in the spectrum of sample A. This was also true for the bands of protein structures, whose intensity ratio corresponds to the results of the chemical analysis. Table 1 proves that the extraction efficiency of PS-complexes with a high content of the protein in sample A was due to the state of the oil cake after the initial treatment, i.e. temperature and time of the primary extraction.
However, both samples revealed three distinct peaks in the structure of the protein band. This experimental fact may indicate the possibility of at least three ways polypeptide fragments can be bound with the polysaccharide matrix, depending on the technological conditions of the process.
2. Flaxseed extraction in an acidic medium (pH 4–5). The extraction was carried out at 50°C for 30 min. When re-precipitated with an excess of ethanol, two products were obtained: fibrous and amorphous. A chemical analysis showed that they had the same content of total protein: 2.60–2.63%. The IR-spectra of these samples (Fig. 7) showed that the amorphous sample had a much higher intensity of the bands. The difference is associated with the features of the less dense, amorphous structure, which results from the formation of lower molecular weight segments due to partial hydrolysis and the destruction of chemical bonds.
The spectra of the samples under consideration revealed three clearly manifested peaks with similar intensity ratio in the region of protein structures. However, the central peak dominated in either case.
3. Fractionation of the PS-complex obtained by water extraction (pH 6–7). Of the two polysaccharide fractions present in the mucus of flax seeds, it is the acid fraction that contains most of the total protein to be released during extraction [12]. The PS-complex was fractionated to study the protein-polysaccharide interactions. Table 2 shows the processing steps.

Sample D was extracted from the PS-complex (sample C) in an acidic medium (pH-5). After the extraction, the residue of the PS-complex was dissolved in water, and sample E was precipitated in an excess of ethanol. A purified PS-complex (sample E) was, in fact, obtained as a result of additional purification removal of acid-soluble substances. Its protein content was 1.49%.
Figure 8 shows the IR spectra of the amorphous sample of the dry extract obtained by acidic extraction, PS-complex obtained by water extraction (sample C, Table 2), and the first fractionation product obtained by acidic extraction (sample D, Table 2). The obtained data showed a decrease in the spectra of the samples as the initial extract was purified. The decrease in the total protein was relatively small: 2.60–2.36%. The pattern of the bands and the position of the peaks changed greatly in the region of absorption of protein structures.
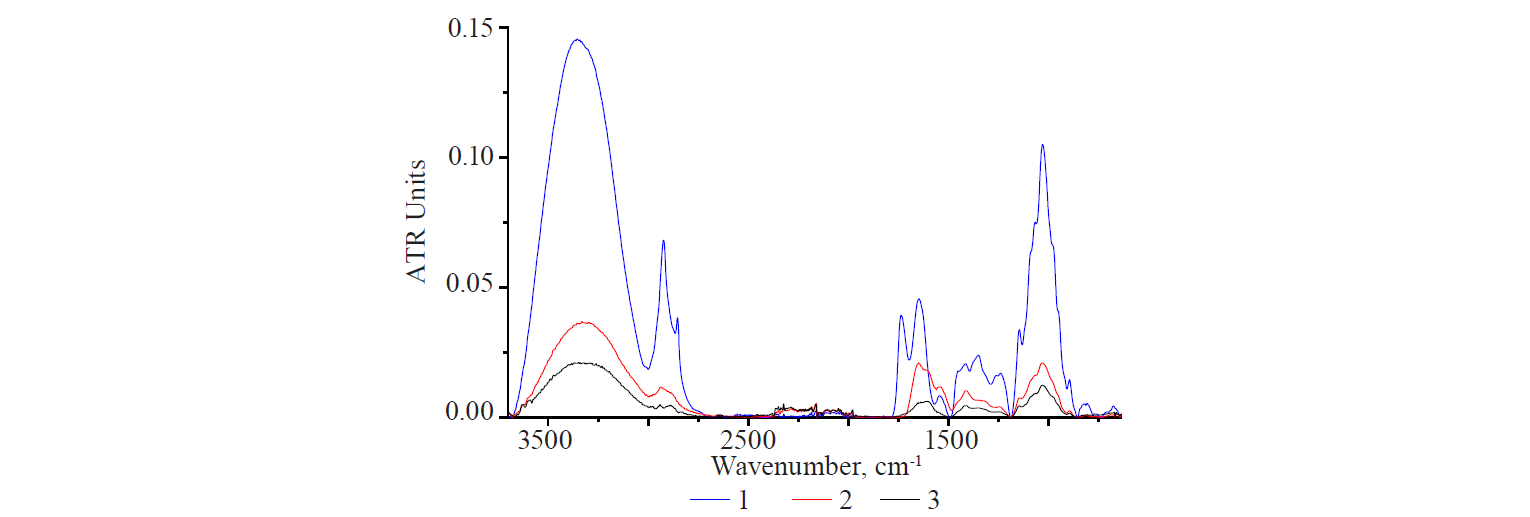
Sample D (Fig. 8) was obtained in an acidic medium, while sample E (Fig. 9) was a PS-complex (1.49% protein) purified from compounds soluble in an acidic medium. However, a comparison of their IR-spectra showed a significant rise in the entire spectrum of sample E. The intensity of the bands increased in the region of the absorption of protein components, in spite of the fact that their content in the sample decreased. The same was true for all the samples of the PScomplexes obtained from various flax seeds. In addition, the spectrum of sample E showed a distinctive single peak in the region of 1640 cm–1.
Thus, the conditions of polysaccharide extraction from flax seeds and the subsequent processing of the products affect not both the content of polypeptide fragments and structural relationships with the polysaccharide matrix.
4. Combined sequential extraction. Extraction conditions have an effect on the protein content in polysaccharide products and protein-polysaccharide interrelations. To study the process, a sequential extraction of polysaccharide products from industrial flax seeds was conducted at different temperature and pH values. Table 3 shows the scheme of the experiment.

Stage I involved an aqueous extraction at room temperature for 60 min. Polysaccharide complex PSC-1 was precipitated from the extract with an excess of ethanol During stage II, the seed residue (primary oil cake) was subjected to the second water extraction at 70°C for 60 min. Polysaccharide complex PSC-2 was obtained from the secondary oil cake with an excess of ethanol. The seeds that remained after the second extraction, or secondary oil cake (stage II, Table 3), were subjected to a third aqueous extraction at pH 4 and 40°C for 1 h (stage III). Polysaccharide complex PSC-3 was precipitated from the extract with an excess of ethanol. Table 3 demonstrates the total protein content in the resulting products.
For this series of samples, IR-spectra showed a logical relationship with the amount of total protein, if to analyse one band of 1750–1500 cm–1, which is the structured band of stretching vibrations of C=O groups of protein components. However, this band demonstrated significant qualitative differences between the products. Samples PSC-2 and PSC-3 had two clear peaks of different intensity and a well-structured shoulder of the same intensity on the right branch of the first peak. The PSC-1 spectrum showed one narrow peak of a relatively low intensity. Its position corresponded with the shoulders at the most intense peaks of PSC-2 and PSC-3.
The general contour of the polysaccharide bands of 1030 cm–1 remained the same. However, their intensity in the spectra of PSC-2 and PSC-3 changed their relative position, if compared to the sequence of the curves in the protein band. PSC-2 had a more intense band. For these samples, this sequence in the arrangement of the spectral curves remained in the bands of 3500–2750 cm–1 and 1500–1250 cm–1. These bands characterized the stretching and bending vibrations of the CHn, NHn, and OH groups. All the bands in the PSC-1 sample showed the lowest intensity. However, the vibration bands of these functional groups shifted to a higher frequency region, which indicated a stronger bond. It could also indicate a stronger or more compact structure of the sample.
ВЫВОДЫ
The study featured polysaccharide products obtained with different technological extraction parameters from two Russian varieties of whole flax seeds. The results make it possible to draw the following conclusions:
(1) The content of the protein component (polypeptides) in the polysaccharide extracts and their complexes was affected by the pH of the medium, temperature, time and sequence of the technological stages. An increase in the extraction temperature and a decrease in the pH of the medium contributed to a significant increase in the protein content of the polysaccharide product – by 5–10 times.
(2) The same technological parameters predetermined the proportion, the force, and the mechanism of chemical bond with the polysaccharide matrix for at least three types of polypeptide structures. This was clearly manifested in the variation of the intensity, shape, structure pattern, and the position of the peaks in the band in the range of 1700–1500 cm–1. This range reflected protein components within polysaccharide complexes.
Thus, the choice of technological parameters determines the component composition of polysaccharide products during their extraction from flax seeds. The protein component affects the functional and technological properties of the products. As a result, one can obtain polysaccharide products with programmed functional properties for various food technologies.
Flaxseed polysaccharides are a dietary fibre, which makes them a physiologically necessary dietary component. Thus, flaxseed polysaccharides are both a technological additive and a biologically valuable functional ingredient. In this regard, their production may expand the range of domestic functional food ingredients.
КОНФЛИКТ ИНТЕРЕСОВ
The authors declare that there is no conflict of interest related to this article.
ФИНАНСИРОВАНИЕ
The research was conducted according to the research plan of the Federal Research Center for Bust-Fibre Crops.
СПИСОК ЛИТЕРАТУРЫ
- Krishtanova NA, Safonova MYu, Bolotova VC, Pavlova ED, Sakanyan EI. The prospects of the use of vegetable polysaccharides as medical and medical and preventive drugs. Proceeding of Voronezh State University. Series: Chemistry. Biology. Pharmacy. 2005;(1):212–221. (In Russ.).
- Sytchev IA, Kalinkina OV, Lacksaeva EA. Biological activity of the vegetable polysaccharides. I.P. Pavlov Russian Medical Biological Herald. 2009;17(4):143–148. (In Russ.).
- Generalov EA. Physico-chemical approaches to the analysis of natural polysaccharides. Auditorium. 2015;8(4):38–54. (In Russ.).
- Olennikov DN, Kashchenko NI. Polysaccharides. Current state of knowledge: an experimental and scientometric investigation. Chemistry of plant raw material. 2014;(1):5–26. (In Russ.). DOI: https://doi.org/10.14258/jcprm.1401005.
- Englyst KN, Liu S, Englyst HN. Nutritional characterization and measurement of dietary carbohydrates. European Journal of Clinical Nutrition. 2007;61:S19–S39. DOI: https://doi.org/10.1038/sj.ejcn.1602937.
- Gutte KB, Sahoo AK, Ranveer RC. Bioactive Components of Flaxseed and its Health Benefits. International Journal of Pharmaceutical Sciences Review and Research. 2015;31(1):42–51.
- Tarasova RN, Ozhimkova EV, Uschapovsky IV. The study of prebiotic properties heteropolysaccharides of linum usitatissimum on bacteria Lactobacillus Acidophilus. Bulletin of the Tver State Technical University. 2018;33(1):61–63. (In Russ.).
- Warrand J, Michaud P, Picton L, Muller G, Courtois B, Ralainirina R, et al. Structural investigations of the neutral polysaccharide of Linum usitatissimum L. seeds mucilage. International Journal of Biological Macromolecules. 2005;35(3–4):121–125. DOI: https://doi.org/10.1016/j.ijbiomac.2004.12.006.
- Warrand J, Michaud P, Picton L, Muller G, Courtois B, Ralainirina R, et al. Large-scale purification of water-soluble polysaccharides from flaxseed mucilage, and isolation of a new anionic polymer. Chromatographia. 2003;58(5–6):331–335.
- Qian K-Y, Cui SW, Nikiforuk J, Goff HD. Structural elucidation of rhamnogalacturonans from flaxseed hulls. Carbohydrate Research. 2012;362:47–55. DOI: https://doi.org/10.1016/j.carres.2012.08.005.
- Rabetafika HN, Van Remoortel V, Danthine S, Paquot M, Blecker C. Flaxseed proteins: food uses and health benefits. International Journal of Food Science and Technology. 2011;46(2):221–228. DOI: https://doi.org/10.1111/j.1365-2621.2010.02477.x.
- Qian KY, Cui SW, Wu Y, Goff HD. Flaxseed gum from flaxseed hulls: Extraction, fractionation and characterization. Food Hydrocolloids. 2012;28(2):275–283. DOI: https://doi.org/10.1016/j.foodhyd.2011.12.019.
- Kaushik P, Dowling K, Adhikari R, Barrow CJ, Adhikari B. Effect of extraction temperature on composition, structure and functional properties of flaxseed gum. Food Chemistry. 2017;215:333–340. DOI: https://doi.org/10.1016/j.foodchem.2016.07.137.
- Tarasevich BN. IK spektry osnovnykh klassov organicheskikh soedineniy [IR-spectra of the main classes of organic compounds]. Moscow: Lomonosov Moscow State University; 2012. 55 p. (In Russ.).
- Prech EH, Byulʹmann F, Affolʹter K. Opredelenie stroeniya organicheskikh soedineniy. Tablitsy spektralʹnykh dannykh [Tables of Spectral Data for Structure Determination of Organic Compounds]. Moscow: Mir: BINOM; 2006. 251–318 pp. (In Russ.).
- Plotnikova LV, Nechiporenko AP, Orekhova SM, Plotnikov PP, Ishevskii AL. A study of muscular tissue of animal origin by reflection-spectroscopy methods. Optics and Spectroscopy. 2017;122(6):1051–1054. (In Russ.). DOI: https://doi.org/10.7868/S0030403417060162.
- Plotnikova LV, Nechiporenko AP, Orehova SM, Uspenskaya MV, Plotnikov PP, Ishevskiy AL. Reflection spectroscopy in the study of muscle tissue of animal origin. Part I. Scientific Journal NRU ITMO. Series: Processes and Food Production Equipment. 2017;(2):29–39. (In Russ.). DOI: https://doi.org/10.17586/2310-1164-2017-10-2-29-39.
- Skryabin KG, Vikhoreva GA, Varlamov VP. Khitin i khitozan: Poluchenie, svoystva i primenenie [Chitin and chitosan: Preparation, properties, and application]. Moscow: Nauka; 2002. 368 p. (In Russ.).
- Minevich IE, Osipova LL, Nechiporenko AP, Smirnova EI, Melnikova MI. The peculiarities of mucilage polysaccharide extraction from flax seeds. Scientific Journal NRU ITMO. Series: Processes and Food Production Equipment. 2018;(2):3–11. (In Russ.). DOI: https://doi.org/10.17586/2310-1164-2018-11-2-3-11
